On the status of the dip in UHECR spectrum
Abstract
The status of the pair-production dip as a spectral feature, produced by interaction of Ultra High Energy extragalactic protons with CMB is discussed.
Greisen-Zatsepin-Kuzmin (GZK) cutoff [1] is the most spectacular prediction for Ultra High Energy Cosmic Ray (UHECR) spectrum, which status is still uncertain in the present observations. As physics is concerned, detection of the GZK cutoff means discovery of UHE proton interaction with CMB radiation. Another prediction for interaction of UHE protons with CMB is pair-production dip, the spectral feature originated from electron-positron pair production by extragalactic UHE protons propagating through CMB: . Originally proposed for diffuse spectrum in early work [2], this feature has been studied recently in Refs. [3, 4]. An alternative explanation of the observed pair-production dip, widely discussed now [5], was first put forward in works [6] and [7] in terms of a two-component model as the transition from galactic to extragalactic cosmic rays. Being a quite faint feature, the -production dip is not seen well in the naturally presented spectrum vs. . The dip is more pronounced when analyzed in terms of the modification factor [2, 8], , where is the spectrum calculated with all energy losses included, and is the unmodified spectrum calculated with adiabatic energy losses only. The observed modification factor is given by , where is the observed spectrum and is the exponent of the generation spectrum in terms of initial proton energies .
The pair-production dip is clearly seen in the energy-dependence of and is reliably confirmed [3, 4, 9] by observational data, as Fig. 1 shows. The comparison of the predicted dip with observational data includes only two free parameters: exponent of the power-law generation spectrum (the best fit corresponds to ) and normalization constant to fit the -production dip to the measured flux. The number of energy bins in the different experiments is 20 - 22. The fit is characterized by for AGASA, HiRes and Yakutsk data. For the Auger data is larger mainly due to the low flux in the first energy bin at EeV where measurements are made with the help of surface detectors (see Fig. 1).
The theoretical pair-production dip has two flattenings: one at
energy eV and the other at eV. One can see that at the
experimental modification factor, as measured by Akeno and HiRes,
exceeds the theoretical modification factor. Since by definition
modification factor must be less than one, this excess signals the
appearance of a new component of cosmic rays at eV, and thus the transition from extragalactic to galactic
cosmic rays, starting at energy .
The second flattening automatically explains
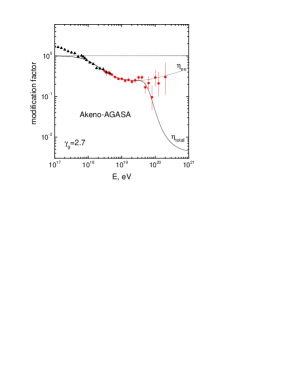
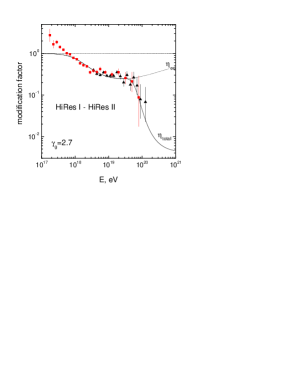
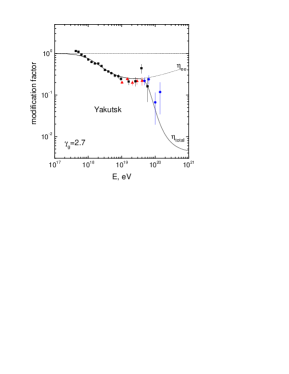
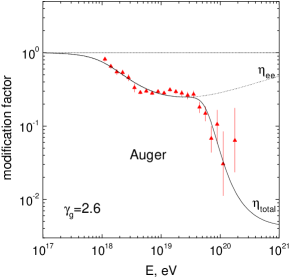
the ankle, the feature seen in all experiments starting from Haverah Park in the end of 70s.
The position and shape of the dip is robustly fixed by interaction with CMB and can be used for energy calibration of the detectors.
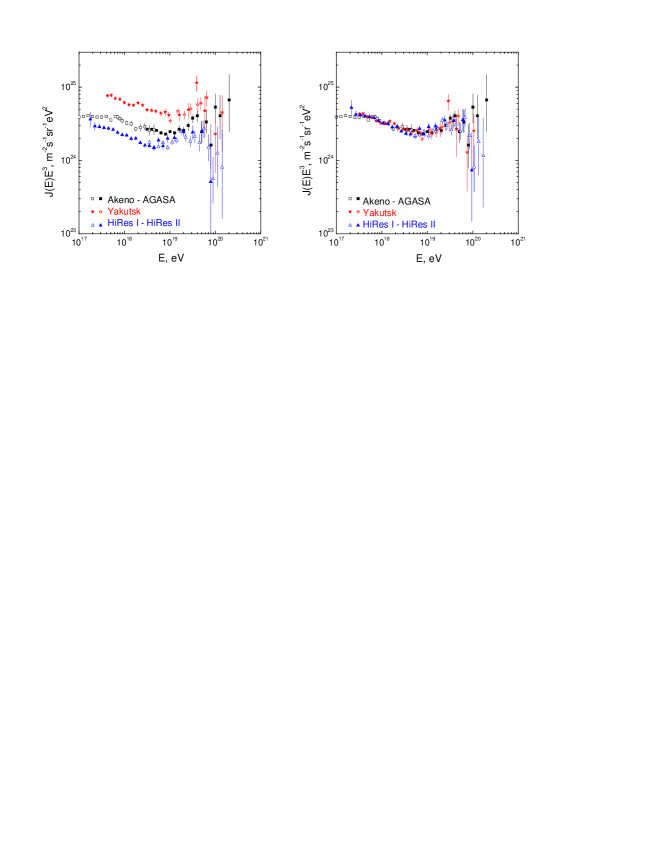
The systematic errors in energy measurements are high, from 15% in AGASA to 22% in Auger. To calibrate each detector we shift the energies by factor to reach minimum in comparison with theoretical dip. We obtain these factors as , and for AGASA, Yakutsk and HiRes detectors, respectively. Recently, AGASA collaboration has reduced their energies by 10% indeed, based on reconsideration of energy determination. After energy calibration the fluxes given by AGASA, HiRes and Yakutsk detectors agree with each other in most precise way (see Fig. 2). The Auger flux is noticeably below the flux shown in Fig. 2.
Concerning the calibration two remarks are in order.
i) After calibration the discrepancy between AGASA and HiRes data at the highest energies diminishes to the level of , but the AGASA excess over the theoretical flux with the GZK cutoff remains statistically significant. The better agreement between highest energy AGASA and HiRes data implies some trial theoretical spectrum between AGASA and HiRes data.
ii) One can see that calibration with help of the pair-production dip implies decreasing energies measured by on-ground methods ( and ) and increasing the energies measured by fluorescent method (). It might be considered as an indication to the difference in measuring energies by these two methods.
The predicted shape of the -production dip is quite robust [3, 9]: it is modified very weakly when the discreteness in the source distribution and their inhomogeneities are taken into account, and different regimes of propagation (from rectilinear to diffusive) are considered. The cosmological evolution of the sources, e.g. with parameters inspired by observations of active galactic nuclei, also results in the same shape of the dip. The pair-production dip is modified strongly when the fraction of nuclei heavier than protons is high at injection, which imposes some restrictions to the mechanisms of acceleration operating in UHECR sources [9]. The shape of acceleration spectrum needed for the -production dip agrees with standard ones for non-relativistic shock acceleration or for relativistic shock. The effective needed at ultra high energy is naturally explained by distribution of sources over maximum energy of acceleration or luminosity [3, 9, 11].
On the basis of the predicted dip and the calibrated data of AGASA, HiRes and Yakutsk detectors we can plot the spectrum and flux in the energy region eV as it is shown in Fig. 3. In the energy interval eV the theoretical uncertainties in the predicted spectrum are relatively small and are mainly given by uncertainties in distances between sources. These uncertainties dramatically increase at eV.
In Fig. 3 the spectra are shown for proton-dominated flux with distances between sources in the range Mpc. Therefore the beginning of the GZK cutoff in the energy range eV is predicted in the dip-based model with small uncertainties. At larger energies the spectrum of GZK feature is very model dependent: apart from distances between sources it depends on fluctuations in luminosities of the nearby sources, in distances between them, and by maximum acceleration energy (see [3] for calculations).
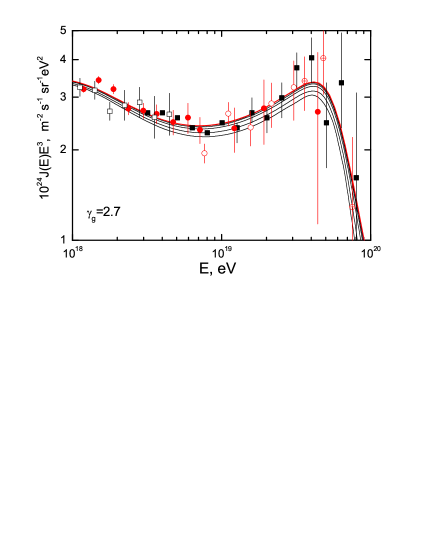
One can see from Figs. 1 and 3 that the beginning of the GZK cutoff in energy range eV is confirmed by all detectors, including AGASA.
Acknowledgments
We are grateful to R. Aloisio, P. Blasi and B. Hnatyk for joint works on this and related subjects. We thank Alan Watson for providing us with Auger energy spectrum as numerical files. Our work is supported in part by ASI through grant WP 1300 (theoretical study).
References
-
[1]
K. Greisen, Phys. Rev. Lett. 16, 748 (1966);
G. T. Zatsepin and V. A. Kuzmin, Pisma Zh. Experim. Theor. Phys. 4, 114 (1966). - [2] V. S. Berezinsky and S. I. Grigorieva, Astron. Astroph. 199, 1 (1988).
- [3] V. Berezinsky, A. Z. Gazizov and S. I. Grigorieva, Phys. Rev. D 74, 043005 (2006); [hep-ph/0204357].
- [4] V. Berezinsky, A. Z. Gazizov and S. I. Grigorieva, Phys. Lett. B 612, 147 (2005); [astro-ph/0502550].
-
[5]
A. M. Hillas, Nucl. Phys. Proc. Suppl. 136, 139
(2004); J. Phys. G 31, R95 (2005); astro-ph/0607109;
D. De Marco and T. Stanev, Phys. Rev. D 72, 081301 (2005);
D. Allard et al., Astron. Astrophys. 443, L29 (2005); astro-ph/0703633;
T. Wibig and A. W. Wolfendale, J. Phys. G 31, 255 (2005). - [6] C. T. Hill and D. N. Schramm, Phys. Rev. D 31, 564 (1985).
- [7] S. Yoshida and M. Teshima, Progr. Theor. Phys. 89, 833 (1993).
- [8] T. Stanev et al., Phys. Rev. D 62, 093005 (2000).
- [9] R. Aloisio, V. Berezinsky, P. Blasi, A. Gazizov, S. Grigorieva and B. Hnatyk, Astropart. Phys. 27, 76 (2007); [astro-ph/0608219].
-
[10]
R. U. Abbasi et al. [HiRes Collaboration], Phys. Rev. Lett. 92, 151101 (2004); astro-ph/0703099;
V. P. Egorova et al. [Yakutsk Collaboration], Nucl. Phys. B (Proc. Suppl.) 3, 136 (2004);
K. Shinozaki et al. [AGASA Collaboration], Nucl. Phys. B (Proc. Suppl.) 3, 151 (2006);
M. Honda et al. [Akeno Collaboration], Phys. Rev. D 70, 525 (1993);
D. J. Bird et al. [Fly’s Eye Collaboration], Ap. J. 424, 491 (1994);
M. Roth [Pierre Auger Collaboration], astro-ph/0706.2096. - [11] M. Kachelrieß and D. Semikoz, Phys. Lett. B 634, 143 (2006).