11email: vdkruit@astro.rug.nl
Truncations of stellar disks and warps of HI-layers in edge-on spiral galaxies
Abstract
Context. Edge-on spiral galaxies often have stellar disks with relatively sharp truncations and there is extensive observational material of warped HI-layers in the outer parts. Warps appear to start preferentially near the optical boundaries of the disks, but the possible relation between truncations and warps has not been studied in detail.
Aims. The aim is to make a comparative study of warps and truncations in edge-on galaxies. Samples with detailed surface photometry or HI-mapping have little overlap. The García-Ruiz et al. (2002) sample with extensive Westerbork HI-mapping is a candidate to be complemented with luminosity distributions from other sources.
Methods. The Sloan Digital Sky Survey (and in a few cases the STScI Digital Sky Survey) has been used to provide these data. The method to identify truncations in these digital datasets has been tested using the sample of edge-on galaxies of van der Kruit & Searle (1981a/b, 1982a/b).
Results. (i.) The majority (17 out of 23) of the galaxies show evidence for truncations, consistent with previous findings in other samples. (ii.) When an HI-warp is present it starts at 1.1 truncation radii (statistically allowing all possible geometries). (iii.) This supplements the rules for warps formulated by Briggs (1990), if the Holmberg radius is replaced for edge-on systems with the truncation radius. (iv.) The truncation radius and the onset of the warps coincide radially sometimes with features in the rotation curve and often with steep declines in the HI surface density. The latter is also true for less inclined systems. (v.) Inner disks are very flat and the onset of the warp just beyond the truncation radius is abrupt and discontinuous. (vi.) In an appendix the definition and derivation of the Holmberg radius is discussed. Contrary to what is often assumed in the literature Holmberg radii are not corrected for inclination.
Conclusions. These findings suggest that the inner flat disk and the outer warped disk are distinct components with quite different formation histories, probably involving quite different epochs. The inner disk forms initially (either in a monolithic process in a short period or hierarchically on a somewhat more protracted timescale) and the warped outer disk forms as a result of much later infall of gas with a higher angular momentum in a different orientation. The results are also consistent in this picture with an origin of the disk truncations that is related to the maximum specific angular momentum available during its formation.
Key Words.:
Galaxies: general - Galaxies: photometry - Galaxies: structure - Galaxies: formation1 Introduction
It has been known for a long time that the neutral hydrogen (HI) layer of our Galaxy is warped in the outer parts. It was discovered independently in early surveys of the Galactic HI in the north by Burke (1957) and in the south by Kerr and Hindman (Kerr, 1957). In external spiral galaxies the first indication came from the work of Rogstad et al. (1974), when they obtained aperture synthesis observations of the HI in M83. Both the distribution and the velocity field of the HI showed features that could be interpreted as a warping of the gaseous disk in circular motions in inclined rings. This later became known as the ‘tilted-ring’ description for ‘kinematic warps’ and many more galaxies have been shown to have such deviations using this method (e.g. Bosma, 1981). The case that this warping occurs in many spiral galaxies was strengthened by the early observations of edge-on systems. Sancisi (1976) was the first to perform such observations and showed that the HI in four out of five observed edge-ons (among which NGC 4565 and NGC 5907) displayed strong deviations from a single plane. Sancisi (1983) discussed these warps in somewhat more detail and in particular noted that in the radial direction the HI surface densities often display steep drop-offs followed by a “shoulder” or “tail” at larger radii.
The most extreme (‘prodigious’) warp in an edge-on system was observed by Bottema et al. (1987; see also Bottema 1995, 1996) in NGC 4013. Recently García-Ruiz et al. (2002; also see García-Ruiz, 2001) presented 21-cm observations of a sample of 26 edge-on galaxies in the northern hemisphere. This showed that HI-warps are ubiquitous; in fact state that “all galaxies that have an extended HI-disk with respect to the optical are warped”. Studies of possible warps in the stellar disks have also been made (for recent results see e.g. de Grijs, 1997, ch. 9 and Reshetnikov et al. 2002); although there is evidence for such warps in most edge-on galaxies the amplitude is very small compared to what is observed in the HI.
The origin of warps has been subject of extensive study and has been reviewed recently in for example García-Ruiz et al. (2002), Shen & Sellwood (2006) and Binney (2006). Although none of the models is completely satisfactory, most workers seem to agree that it must have something to do with a constant accretion of material with an angular momentum vector that has another orientation than the main disk. In models bij Jiang & Binney (1999) and Shen & Sellwood (2006) this results in an inclined outer torus in the dark halo that distorts the existing disk and causes it to become warped. The posssibility of a misalignment in the angular momenta and therefore the principal planes between the stellar disk and the dark halo (Debattista & Sellwood, 1999) has recently received some observational support from the observations of Battaglia et al. (2006) of NGC 5055. The HI data suggest that the inner flat disk and the outer warped part of the HI have different kinematical centers and systemic velocities, suggesting a dark halo with not only a different orientation, but also an offset with respect to the disk.
Another aspect of disks in galaxies is the fact that the stellar disks appear to have ‘truncations’. This was first noticed by van der Kruit (1979) in photographic surface photometry of NGC 4244, 4565 and 5907. Two of these have no bulges and ‘vertical’ profiles showed that stellar disks have roughly constant thickness with galactocentric radius. Van der Kruit and Searle (1981a,b, 1982a,b) extended this to a sample of 7 galaxies and performed a much more detailed analysis of the surface brightness distributions. It was found that these relatively sharp outer edges correspond to a rather sudden decrease in the radial e-folding of the surface brightness distributions, dropping to values below 1 kpc. The truncation radius usually occurs around 4 to 5 radial scalelengths .
This early surface photometry was obtained from photographic plates. The existence of the truncations –and the values for scale parameters (scalelength and scaleheight) of these stellar disks– and the associated truncation radii were confirmed to good or exellent precision using CCD photometry by Morrison et al. (1994) for NGC 5907, by Fry et al. (1999) for NGC 4244, by Morrison et al. (1997) and Xilouris et al. (1998) for NGC 891 and by Wu et al. (2002) for NGC 4565.
The existence of truncations has been subject of extensive study, both in edge-on galaxies (e.g. Kregel & van der Kruit, 2004) and in disks at various orientations (Pohlen & Trujillo, 2006; Trujillo & Pohlen, 2006; Florido et al., 2006)). In the edge-on galaxies the signature is quite clear; the radial light profile simply drops well below an extrapolation of the radial light profile of the inner parts. Kregel, van der Kruit & de Grijs (2002) conclude that in their sample of 34 southern edge-ons (defined by de Grijs, 1997) evidence for truncation is seen in at least 60%. In less inclined systems (e.g. Pohlen & Trujillo, 2006) also a frequency of around 60% has been found, which shows that independent of orientation the conclusion can be drawn that truncations are common among galaxies.
In the less inclined systems studies referred to above have found a diversity of behaviour, ranging from a rather sharp truncation through a continuation into the noise of the exponential profile to an actual flattening. In the edge-on systems the truncation is seen best as a lack of growing diameter with fainter light levels. In fact, that is how it was first noted in NGC 4565 (van der Kruit, 1979). Freeman (2006) has reviewed the subject recently and documents that although truncations as in NGC 4565 are common, some (not edge-on) galaxies without truncations do exist, e.g. NGC 300 (Bland-Hawthorn et al. 2005).
The origin of the truncations is still not clear. The early suggestion in van der Kruit & Searle (1981a) that it may be related to the disk formation model of Larson (1976) is probably no longer relevant, since that scenario of a very slowly growing disk does not agree with the fact that even in the outer parts the ages of the stellar disks appear several Gyrs at least (de Jong, 1996; Bell & de Jong, 2000). Although it was speculated in van der Kruit & Searle (1981a) that the truncations may correspond to points where the gas density drops below a value critical for star formation, Fall & Efstathiou (1980) suggested that it was the shear of differential rotation that inhibits star formation when it becomes large enough to overcome self-gravity in the gas. Van der Kruit & Searle (1982a) investigated that by estimating the numerical value of parameters in the Goldreich & Lynden-Bell (1965) criterion for gravitational stability in a rotating gaseous disk. This showed that the criterion systematically underpredicts the value of by 20% or so, but this does not prove that it is unrelated to this criterion. In fact Schaye (2004) has studied the possibility of a threshold in the gas density for star formation to occur as the cause of the truncations. The third possibility is that it results from a well-defined maximum in specific angular momentum in the protogalaxy (van der Kruit, 1987) if the collapse occurs with detailed conservation of specific angular momentum (Fall & Efstathiou, 1980).
Kregel & van der Kruit (2004) have discussed this issue in the light of the observations in the de Grijs sample. The ratio decreases towards larger scalelengths and there is a correlation of this ratio with face-on central surface brightness, larger ratio’s corresponding to brighter galaxies. This makes the disk surface brightness at the truncation radius rather constant. Studies of less inclined systems, as in Pohlen & Trujillo 2006), have come to the similar correlations, confirming that these conclusions are also independent of orientation. These obervations do most readily fit into the model of a star-formation threshold; for it to fit into the maximum specific angular momentum scenario some redistribution of angular momentum might be required. On the other hand, as I will document more fully in the discussion below, features in rotation curves of at least some edge-on galaxies indicate that the truncations correspond to sharp drops in the total matter density in the disks as well, which would favor the maximum specific angular momentum cause of the truncations.
The earliest observations of HI-warps suggested that these warps start at the edges of the optical disks. It certainly was very obvious in the warp for the edge-on galaxies NGC 5907 and NGC 4013. It was suggested by Bottema et al. (1987) that the coincidence of the onset of the warp in NGC 4013 with the truncation radius might be a factor in explaining the persistence of warps. Briggs (1990) used existing observations and tilted-ring models in moderately inclined galaxies to define a set of “rules of behavior for galactic warps”. One was that “warps change character at a transition radius near ”. The latter radius is the so-called Holmberg-radius listed for 300 bright galaxies in Holmberg (1958); it corresponds in a statistical sense to the isophote of 26.0 photovisual mag arcsec-2 or 26.5 photographic mag arcsec-2. In the appendix I make some observations concerning the use of the Holmberg radius and its relation to the truncation radius in edge-on systems.
A possible coincidence of the onset of the warp and the truncation radius of the stellar disk could be important for our understanding of the origin of warps. It would point to a picture in which the stellar disk formed in an initial stage (which could last several Gyr), resulting in a very flat disk with a truncation. Later on then more gas might fall in, which in general would not have the same orientation for its angular momentum. Although some of it may settle in the existing disk, much of it may have high angular momentum and settle at larger radii and in different planes. Support for this picture comes from investigations of features in rotations curves and in the HI surface densities at the radii of the truncations and the onset of the warp (van der Kruit, 2001). I will return to this below.
The coincidence of truncation and onset of a warp can be studied by considering a sample of edge-on galaxies for which both 21-cm line observations and optical surface photometry are available. Unfortunately the sample of de Grijs with surface photometry is in the south and the sample of García-Ruiz in the north. The sample of García-Ruiz is part of the WHISP111Westerbork observations of neutral Hydrogen in Irregular and SPiral galaxies, see www.astro.rug.nl/ whisp/. survey (Kamphuis, Sijbring & van Albada, 1996) for which surface photometry is part of the project. However, as explained by García-Ruiz (2002), “the quality of the optical images is not good enough to perform photometry on them, possiby due to tracking errors and large background gradients”. This material is not suitable for determinations of possible truncations. García-Ruiz (2002) and García-Ruiz et al. (2004) use the radius from the LEDA catalogue and find that warps usually start around the edge of the optical disk. In this paper I will make that more quantitative and look for evidence of truncations in this sample in data available in digital sky surveys.
2 Observing truncation with the use of digital sky surveys
The purpose of this section is to describe where surface photometry for the edge-on galaxies in the sample described could be obtained from existing datasets and how this material then can been used to evaluate possible evidence for truncations. The application of this method will be the subject of the next section.
| Cliplevel | ) | |||||
|---|---|---|---|---|---|---|
| NGC 4013 | NGC 4217 | NGC 4244 | NGC 4565 | NGC 5907 | Mean | |
| 245 | 1.03 | 1.03 | 0.98 | 0.99 | 1.02 | 1.01 0.02 |
| 240 | 0.99 | 1.01 | 0.97 | 0.99 | 1.00 | 0.99 0.01 |
| 235 | 0.97 | 1.00 | 0.95 | 0.99 | 0.99 | 0.98 0.02 |
| 230 | 0.95 | 0.98 | 0.92 | 0.98 | 0.99 | 0.96 0.03 |
| 225 | 0.94 | 0.96 | 0.91 | 0.98 | 0.98 | 0.95 0.03 |
| 220 | 0.93 | 0.95 | 0.90 | 0.98 | 0.98 | 0.95 0.03 |
| 215 | 0.93 | 0.94 | 0.89 | 0.96 | 0.97 | 0.94 0.03 |
| 210 | 0.89 | 0.89 | 0.77 | 0.95 | 0.96 | 0.89 0.08 |
| 205 | 0.87 | 0.85 | 0.74 | 0.94 | 0.95 | 0.87 0.08 |
| 200 | 0.83 | 0.83 | 0.69 | 0.92 | 0.91 | 0.84 0.09 |
The prime dataset is the Sloan Digital Sky Survey (SDSS). It covers a large fraction of the northern sky and has photometric calibrations accurate to a few tenths of a magnitude. The work decribed here was performed in May, 2006, using the Fourth Data Release (DR4). Images can be obtained at http://cas.sdss.org/dr4/en/tools/chart/chart.asp. This covered 6 of the 8 galaxies in the sample of van der Kruit & Searle and 20 of the 26 galaxies of the García-Ruiz et al. sample. DR5 (http://cas.sdss.org/dr5/en/tools/chart/chart.asp) has since then appeared, and respectively one and two more galaxies have become available in the samples from this new release. The ones that remain missing in the SDSS are NGC 891 in the van der Kruit & Searle sample and UGC 1281, UGC 2459, UGC 3137 and UGC 3909 in the García-Ruiz et al. sample.
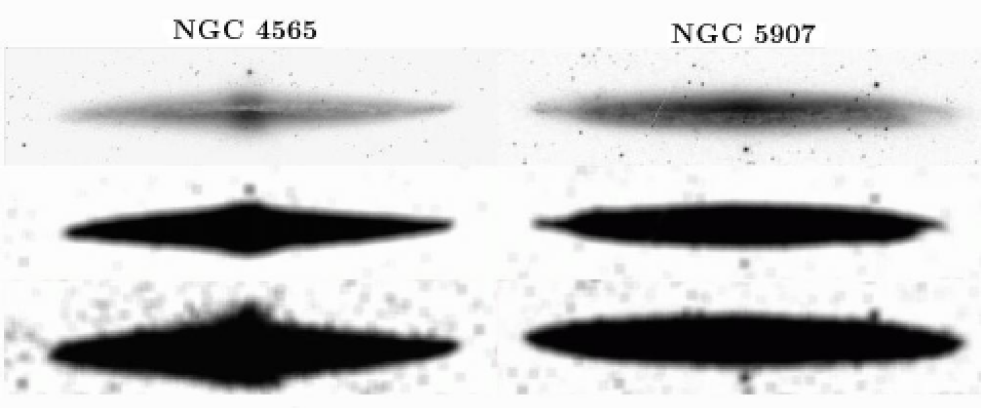
First we consider the van der Kruit & Searle sample in the SDSS. In Fig. 1 I show two of these galaxies to illustrate the way these data have been analysed. These are NGC 4565 (in which actually the evidence for truncations was first noticed) and NGC 5907. The first has a bulge, but the second is probably almost entirely disk. The images were obtained throught the “Finding Chart Tool”, usually downloading a 10242 image. This was treated with the ‘xv’ routine in a Unix/Linux environment. In the case of Fig. 1 the images were rotated so that the disks appear horizontal. The data format was then changed from 24-bit to 8-bit mode, converted to grey-scale and to inverse video. The upper panels show the images after this treatment. Next they were clipped at two different levels. A shallow clip was produced by setting all values in the image below 215 to ’white’ and the rest to ’black’. The deep clip was produced the same way but now with 245 as the dividing value. These images were then smoothed (’blurred’) with a mask of about 15 pixels. The results are in the lower two panels.
Fig. 1 clearly shows what the signature of a truncation in such images. The minor axes do grow significantly at faint levels, especially in the case of NGC 4565 due to the relatively prominent bulge. But in the direction of the major axes the increase in diameter is very small. It therefore appears that evidence for a truncation can be searched for by measuring the axis ratios in these images. All images from the SDSS have been treated in this manner. By measuring the minor axis diameters and comparing to the isophote maps in the original papers, I find that rather consistently (to an accuracy of about 0.3 magnitudes) the diameters measured correspond roughly to the isophotes at 26.5 and 27.5 mag arcsec-2 in the -Band of van der Kruit & Searle. This is very close to Johnson -Band.
| Galaxy | ||||||||
|---|---|---|---|---|---|---|---|---|
| () | () | () | ||||||
| SDSS | ||||||||
| NGC 4013 | 2.7 | 2.5 | 2.8 | 1.03 | 1.10 | 3.2 | 2.3 | 1.41 |
| NGC 4217 | 3.3 | 3.1 | 3.4 | 1.03 | 1.08 | 3.4 | 2.8 | 1.22 |
| NGC 4244 | 9.5 | 8.5 | 9.3 | 0.98 | 1.09 | 8.0 | 7.0 | 1.15 |
| NGC 4565 | 8.3 | 8.1 | 8.2 | 0.99 | 1.02 | 7.3 | 6.0 | 1.20 |
| NGC 5023 | 3.3 | 2.8 | 3.3 | 1.00 | 1.19 | 6.2 | 5.8 | 1.07 |
| NGC 5907 | 6.0 | 5.8 | 6.1 | 1.02 | 1.06 | 7.3 | 6.3 | 1.16 |
| NGC 7814 | 4.0 | 3.6 | 4.3 | 1.07 | 1.18 | 2.1 | 2.0 | 1.03 |
| DSS2 (red) | ||||||||
| NGC 891 | 7.5 | 7.0 | 7.4 | 0.99 | 1.07 | 5.8 | 3.4 | 1.49 |
| NGC 4013 | 2.7 | 2.5 | 2.7 | 1.00 | 1.10 | 3.5 | 2.9 | 1.23 |
| NGC 4217 | 3.3 | 3.2 | 3.3 | 1.00 | 1.04 | 3.4 | 3.0 | 1.15 |
| NGC 4244 | 9.5 | 8.4 | 8.7 | 0.92 | 1.03 | 7.3 | 6.8 | 1.06 |
| NGC 4565 | 8.3 | 8.0 | 8.2 | 0.99 | 1.04 | 7.1 | 5.9 | 1.21 |
| NGC 5023 | 3.3 | 2.5 | 3.2 | 0.97 | 1.30 | 5.9 | 6.3 | 0.95 |
| NGC 5907 | 6.0 | 5.7 | 6.1 | 1.02 | 1.07 | 8.1 | 7.4 | 1.10 |
| NGC 7814 | 4.0 | 2.7 | 3.8 | 0.95 | 1.44 | 2.4 | 2.3 | 1.05 |
Images were retrieved then from the SDSS of size 10242 such that the galaxy extended over half to three-fourth of the image. These were then treated as described above and subsequently printed on a uniform scale. The diameters along both the major and minor axes were measured from these prints. For all galaxies the actual minor axis was measured and no correction for the presence of a bulge was attempted. The effect of the bulges is being addressed below when the results are dicussed. Independent repeats showed that these measurements can easily be done with very good consistency. The scales of the prints were derived by measuring distances between stars that could be identified in the contour plots in the van der Kruit & Searle publications. I will now consider the choice of the two clip levels of 215 and 245.
In Table 1 I show the diameters (compared to twice the truncation radii) for 5 of the galaxies in the sample at various clip levels. The value 250 was too close to the sky level. One can see that the average values roughly show the same pattern to about the value of 215, but then at brighter leves (lower numerical values for the clip) the deviations between the galaxies used here suddenly increase. It seems then that the range 215–245 is a useful range for our purposes. It should also be noted that at the level around 250, which is very close to the sky level, one can judge how well the sky has been determined. This is especially important since for galaxies with large angular size the data are usually not taken on a single chip or during a single night. By looking at faint levels one can also judge the continuity of the isophotes in these clipped images. In none of the galaxies (nor for the ones in the sample described below) any evidence was found that this could be a problem, even though in a few cases the effects could be seen in the corners of the image. It can also be checked in principle by examining the two sides of some galaxies and actually measuring radii rather than diameters; this means that one has to adopt a position of the center, or at least a position consistent between the two clips. It was performed as a trial on NGC 4565 and NGC 5907, but no effect was found.
The results of the measurements are presented in the upper part of Table 1. is the truncation radius obtained by van der Kruit & Searle222For NGC 4013 the pixelsize quoted in van der Kruit & Searle (1982a) was incorrect by a factor 1.5, as discoverd by Bottema (1995). This correction has been applied.. Note that diameters were measured rather then radii, which were then divided by two in order to compare to .
Now I turn to Table 2. First look at the ratio of the major axis in the deep clip to truncation radii of van der Kruit & Searle: the mean ratio is 1.02 , showing that indeed the deep clip is a measure for . Next I turn tot the ratio of the dimensions as measured on the two clips. Except for two cases (NGC 5023 and NGC 7814) this is less than 1.10 and all these galaxies show clear evidence for a truncation in the detailed photometry of van der Kruit & Searle. NGC 5023 is a pure disk galaxy and has been shown to be a late-type dwarf system (see also Bottema et al., 1986). In the van der Kruit & Searle (1982a) sample the evidence for the truncation is the weakest of all; in Fig. 8 of that paper we see in the righthand panel that the averaged radial profile at the last measured point is only a few tenth of a magnitude below the extrapolated exponential disk. Although this galaxy still is believed to have a truncation, it may be no surprise that it is not readily seen with this method. The fact that we see little evidence for it here actually strengthens the case for the applicability of the approach. NGC 7814 is bulge dominated and no truncation in the surface brightness distribution exists, although there is some evidence that the faint disk displays one, which becomes visible after subtraction of the exyended spheroid in the surface brightness maps.
We can also look at the ratio of between the two clips (see Table 2). The value for the disks with a clear truncations is substantially different from 1.0. In cases of significant bulges (NGC 4013 and NGC 4217) it is larger than 1.2, for cases of pure disks (NGC 4244 and NGC 5907) it between 1.1 and 1.2. For NGC 5023 it is smaller than 1.1, because the truncation becomes noticable only at very fainter levels and in NGC 7814 because the light is dominated by the spheroid.
I will on the basis of this then require for evidence for a truncation that the ratio between the deep and shallow diameters is 1.10 or less. The ratio between the axis ratios is used as a further check and this ratio should in general exceed 1.10. The cases of NGC 5023 and NGC 7814 show that disks without evidence for truncation or bulge-dominated galaxies will have this latter ratio close to 1.0.
In order to try and do an analysis of the full sample I looked into the possibility of applying the same method to images from the STScI Digital Sky Survey, available at http://archive.stsci.edu/cgi-bin/dss_form. For these I used the “POSS2/UKSTU Red” images. Usually an area of 152 minutes of arc was retrieved at the standard pixel (about 1 arcsec). In these images the sky background does not always have the same pixel value. “Shallow” clips were produced with the value of the clip set such that the noise of the background was just visible and “deep” images when the galaxy was only just noticable against the backgound noise. Comparison with existing photometry showed that the levels were both of order one magnitude brighter than in the analysis on the SDSS images. An image of NGC 891 is now available.
The bottom part of Table 2 shows that again the evidence for the presence of a truncation is a small increase in the radius between the shallow and deep images, accompanied by a larger increase in the axis ratio. NGC 4244 does not provide evidence for the truncation, but from the actual diameters we see that the outer edge cannot be seen very well on the image. The conclusion is that these images can be used as well, but since they do not go to very faint levels truncations are less readily visible.
3 Application to the García-Ruiz et al. sample
| Galaxy | Type | trunc.? | Remarks | |||||||
|---|---|---|---|---|---|---|---|---|---|---|
| () | () | () | ||||||||
| UGC 1281 | Sc | * | 1.10 | 1.14 | yes | 2.1 | 3.4 | 1.5? | 0.7? | Warp very asymmetric |
| UGC 2459 | Scd | * | 1.07 | 1.17 | yes | 2.4 | 3.9 | 2.5 | 1.0 | Asymmetric, NE side only |
| UGC 3137 | Sbc | * | 1.06 | 1.34 | yes | 2.5 | 3.5 | 3.0 | 1.2 | Symmetric warp |
| UGC 3909 | SBc | * | 1.09 | 1.15 | yes | 1.2 | 2.3 | 1.1 | 0.9 | is 13 on E side, 08 on W side |
| UGC 4278 | SBc | 1.05 | 1.29 | yes | 2.6 | 3.1 | – | – | ||
| UGC 4806 | Sc | 1.07 | 1.12 | yes | 2.1 | 2.3 | ? | – | Warp not clearly defined; | |
| UGC 5452 | Sc | 1.09 | 1.18 | yes | 1.6 | 1.9 | 1.8 | 1.1 | Warp and HI beyond only on SW side | |
| UGC 5459 | SBc | 1.07 | 1.17 | yes | 2.7 | 3.6 | 2.5 | 0.9 | is 25 on NW side, 26 on SE side | |
| UGC 5986 | SBd | 1.13 | 1.22 | no | 2.4 | 5.3 | – | – | Optical/HI plume on NE side detached?, | |
| companion on SW side. for main body | ||||||||||
| UGC 6126 | SBcd | 1.05 | 1.22 | yes | 2.0 | 3.1 | 1.6 | 0.8 | Symmetric warp | |
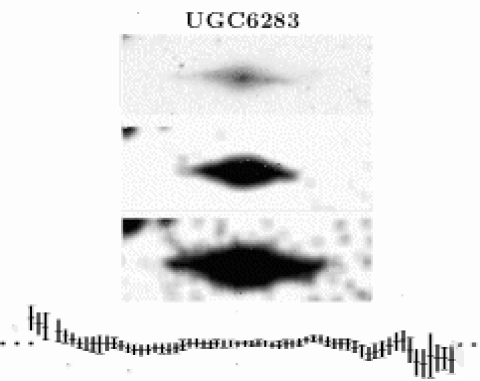
| UGC 6283 | Sab | 1.13 | 1.22 | no | 2.1 | 3.5 | 3.0 | – | Warp sets in beyond | |
| UGC 6964 | SBcd | 1.05 | 1.30 | yes | 2.2 | 2.8 | 1.7 | 0.8 | Symmetric warp | |
| UGC 7089 | Sc | 1.26 | 0.97 | no | 2.1 | 2.1 | – | – | No HI beyond | |
| UGC 7090 | SBc | 1.20 | 1.02 | no | 3.6 | 3.8 | 2.3 | – | Asymmetric, small warp on N side only | |
| UGC 7125 | SBd | W | 1.03 | 1.30 | yes | 2.5 | 5.8 | 2.3 | 0.9 | Optical and HI asymmetric, warp on W side |
| E | 1,40 | 0.92 | no | 2.0 | 3.5 | – | – | No warp on E side | ||
| UGC 7151 | SBc | 1.06 | 1.14 | yes | 3.4 | 3.3 | – | – | No HI beyond | |
| UGC 7321 | Sc | 1.07 | 1.39 | yes | 2.9 | 3.3 | 2.5 | 0.9 | Somewhat asymmetric | |
| UGC 7483 | SBc | 1.10 | 1.22 | yes | 2.1 | 2.5 | – | – | ||
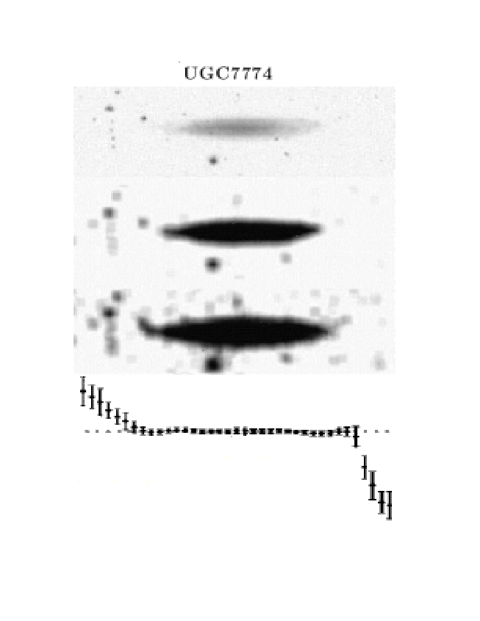
| UGC 7774 | Sc | 1.07 | 1.12 | yes | 1.8 | 2.7 | 2.0 | 1.1 | Rather symmetrical warp | |
| UGC 8246 | SBc | W | 1.07 | 1.27 | yes | 1.7 | 2.1 | 1.5 | 0.9 | Not precisely edge-on?; very asymmetric |
| E | 1.14 | 1.19 | no | 1.8 | 2.4 | – | – | No warp on E side | ||
| UGC 8286 | Sc | 1.09 | 1.17 | yes | 3.4 | 4.2 | 3.3 | 1.0 | Warp asymmetric, bends back on NE side | |
| UGC 8396 | SBc | 1.33 | 0.91 | no | 1.4 | 1.8 | 0.9 | – | Warp only on NW side | |
| UGC 8550 | SBc | 1.30 | 0.96 | no | 2.1 | 2.8 | – | – | No clear indication of a warp | |
| UGC 8709 | SBbc | SE | 1.09 | 1.00 | yes | 3.4 | 3.5 | – | – | Bright star on NW side; not entirely edge-on |
| No HI beyond | ||||||||||
| UGC 8711 | SBc | 1.08 | 1.19 | yes | 2.4 | 3.1 | 1.7 | 0.7 | Warp symmetric, but very sharp on SE side | |
| UGC 9242 | Sc | 1.22 | 1.05 | no | 3.0 | 3.1 | – | – | Superthin galaxy; no HI beyond |
Images of the galaxies in the García-Ruiz et al. sample were retrieved from the SDSS if available and for the remaining four (see above) from the DSS2. These images were treated exactly as described above. The results have been collected in Table 3. In this table I also note the diameter in HI (at 1 M⊙/pc2, ) as given by García-Ruiz et al. in their Table 4. Galaxies with an asterix in the third column are the ones for which the DSS2 had to be used.
First I note that there are two galaxies, UGC 7125 and UGC 8246, for which the two sides on the sky are entirely different both in the properties of the stellar disks and the HI-distributions. One possibility would be to treat each side as a separate galaxy disk, but I will take the point of view that these are disturbed systems that are not suitable for inclusion in a statistical discussion of general properties of “normal” systems. These two galaxies will not further be considered here. I will also not consider UGC 5986. The morphology of this system also shows evidence for disturbances; there is a companion very nearby on the sky on the SW side. On the NE side there is a plume that is continuous in velocity with the main body. It could be a companion or otherwise a disturbed outer region in the disk. In either case, it is not a normal system and I exclude it for the same reasons as the other two.
The column ‘trunc.?’ indicates whether or not there is evidence for a truncation according to the criteria adopted above. In that case I assume that the truncation radius is equal to . It is interesting to note that García-Ruiz et al. estimated the optical radius from their images by eye or took them from NED; for galaxies with a truncation their radius equals 1.01 0.12 times the truncation radius determined here. For three galaxies –UGC 1281, UGC 4806 and UGC 7774– the major axis ratio is less than 1.10, which points at a truncation, while the ratio of the apparent axis ratios is only slightly larger than 1.10. Although this is in agreement with my criteria, one might question how strong the evidence for a truncation really is for these systems. I note that in the van der Kruit & Searle sample NGC 5907 is also such a case (see Table 2) and I will treat these as having truncations on the basis of the fact that the major axis ratio between the two clips is less than 1.1. With these included we then find that the method applied here has provided evidence for truncations in 17 out of 23 galaxies. This is a significant fraction, similar to the conclusion reached in Kregel et al. (2002). The range in Hubble types for this sample is very small (by design it consists of late types due to the requirement to contain observable amounts of HI) and therefore a dependence of the occurence of truncation upon Hubble type is not possible; the only early type UGC 6283 shows no evidence for a truncation.
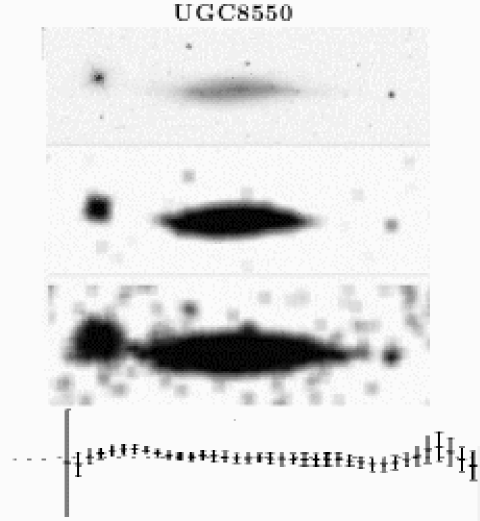
Table 3 shows that four systems (UGC 7089, UGC 7151, UGC 8709 and UGC 9242) have HI-distributions that do not extend significantly further than the optical image. Two of these (UGC 7089 and UGC 9242) show no evidence for a truncation. These four systems are not suitable to investigate relations between HI-warps and disk truncations. These four systems do not show clear evidence for HI-warps anyway.
There is one system (UGC 8550) that shows no evidence for a truncation nor for an HI-warp. The information on this system is illustrated in Fig. 2; the radial extent clearly keeps growing at fainter levels. The HI does extend well beyond the optical radius, but there is no convincing evidence for a warp.
Three galaxies have no truncation, but do possess warped HI-layers, namely UGC 6283, UGC 7090 and UGC 8396. The first has been illustrated in Fig. 3. The warp starts at about 3 arcmin from the center, while the optical disk can be traced to 2.1 arcmin. It is of course possible that this galaxy has a truncation at a fainter level more closely to where we see the onset of the HI-warp. In the other two cases the onset of the warp on the sky starts within the optical extent. The value for is 0.6 – 0.7 for both UGC 7090 and UGC 8396.
There are three galaxies (UGC 4278, UGC 4806 and UGC 7283) that show a truncation but have not unambiguous evidence for a warp even though the HI extends beyond the truncation radius.
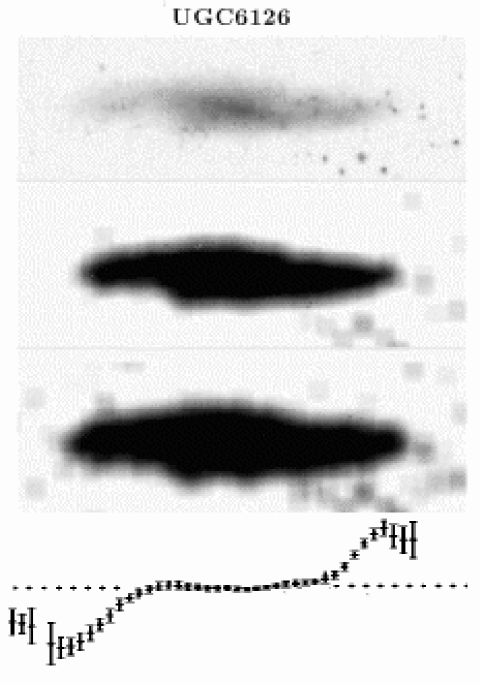
So, we are left with 12 galaxies with both a truncation and a warp. The distribution of the ratio of the truncation radius and that where on the sky the warps starts () is given in Table 4. These include all the “bona fide warped” galaxies of García-Ruiz et al. except UGC 7125, which I do not consider, and none of their “non-warped” galaxies. I illustrate two cases in Fig. 4 and Fig. 5. In UGC 7774 the warp starts just beyond the truncation radius and for UGC 6126 well within this radius.
The projection of a warp onto the plane of the sky is of course such that the apparent onset is less than in the plane of the galaxy, except when the direction of maximum warp is perpendicular to the line of sight. In this case the warp is most readily recognised. If we designate that configuration with an angle equal to 90∘, then other situations will occur in a fraction proportional to cos , if there is no effect of the orientation on the detectability of the warp. This is obviously not the case; when the line of sight coincides with the line of nodes, we expect to see a general thickening of the disk with faint outer parts in the vertical profiles of the HI-distribution, but not a deviation of the plane of symmetry. The three galaxies with truncations but no evidence for an HI-warp (UGC 4278, UGC 4806 and UGC 7283) could be examples where the angle between the line of nodes and the line of sight are relatively small. These are then probably small warps, possibly involving little HI333The HI extends only 10 to 20% beyond on the sky., as these warps would otherwise have been noticable in the channel maps. Add to this UGC 8550 with no warp or truncation. Also in two of the three galaxies with a warp but no truncation (UGC 7090 and UGC 8396) the onset of the warp is well within the optical extent and is less than 0.7 . So we have at least six galaxies where a warp is possible at a projected less than 0.6 .
I now assume that the ratio in the intrinsic geometry is constant between all galaxies and then calculate the resulting statistical distribution on the sky. In Table 5 the observed and expected distributions have been compared. The expected distributions are for three values of in the plane of the galaxy. The value in the last row shows the probability that the observed and expected numbers of galaxies have been drawn from the same distribution according to a Kolmogorov-Smirnov test. The conclusion is that the observations are in good agreement with the statement that if a galaxy has an HI-warps, it starts at a radius of 1.1 .
4 Relation with HI-distributions and rotation curves and comparison to other samples.
First I stress that disks within their optical radius are, except for the very minor warps in the stellar disks close to the edges, extremely flat. The deviations from a straight line in dustlanes in perfectly edge-on systems such as NGC 7814 or NGC 4013 are less than one percent. In HI studies of spiral galaxies that are very close to face-on (see van der Kruit & Shostak, 1982, 1984; Shostak & van der Kruit, 1984) the residual velocity field after the subtraction of a symmetric rotation field has a random pattern with an average amplitude of only a few km sec-1. This shows that systematic vertical motions of the HI are extremely small and indicates that HI-disks, and therefore the stellar disks in whose gravitational field the gas moves, must be extremely flat, within the boundaries of the stellar disks.
It can also be illustrated by examining the edge-on galaxies studied here. In the bottom panels of Fig. 2 to Fig. 5 I have restored the aspect ratio in order to show the deviations of the HI-layer with the same scale in the radial and the vertical directions. Within the optical extent the HI ridge-lines are very flat; I note that UGC 6126 may not be a good example, since it is not entirely edge-on and shows in the optical picture spiral structure. In particular UGC 7774 shows a very flat disk which suddenly starts to warp. This quite discontinuous and abrupt change from very flat to significantly and sometimes very strongly deviating from the inner plane is a feature that is often observed and we have seen here that this occurs close to the truncation radius of the stellar disk.
The abruptness of the onset of the warps and the close radial coincidence with the truncation radius of the stellar disk suggest that the HI in the disk and that in the warped outer part might have a distinct origin. In order to investigate this further I will look at possible features in the HI-distributions and the rotation curves at the positions where the warps start.
Of the eight prominent edge-on galaxies in the northern hemisphere van der Kruit & Searle sample, all have disk truncations, but not all have HI beyond that radius or pronounced warps. For this one needs samples that have both surface photometry and HI-data and that is available in the van der Kruit & Searle sample of edge-on galaxies. I will discuss them in turn.
NGC 891 was observed by Sancisi & Allen (1979), Rupen (1991 and Swaters et al. (1997). No clear evidence for a warp is seen, but on the SW side there is HI beyond the stellar disk and there appears a feature in both the HI-distribution and the rotation curve at about the position of the disk truncation (see Fig.s 18-20 in Rupen or Fig. 2 in Swaters et al.).
The HI-warp in NGC 4013 was discoverd by Bottema et al. (1987) and studied by Bottema (1995, 1996). It is a extensive and very symmetric warp, starting at about the truncation radius. The onset of the warp is accompanied by a sudden drop in the rotation curve and the deconvolved HI surface density shows a steep decrease to a much lower level there. NGC 4013 is a prime example to show a very flat inner disk that suddenly and abruptly starts to warp near the truncation radius.
HI observations of NGC 4217 have been reported in Verheijen (1997) and Verheijen & Sancisi (2001). The HI does not extend significantly beyond the truncation radius.
NGC 4244 is a late-type pure-disk galaxy. The HI observations of Olling (1996) show a slight warp in the outer parts, which sets in at about the edge of the stellar disk. At this position the rotation curve (Olling’s Fig. 7 or 9) shows the onset of a decline; the HI surface density shows a sharp decrease at this radius (Olling’s Fig 6, lower panel).
| UGC | |
|---|---|
| 1.2 | 3137 |
| 1.1 | 5452, 7774 |
| 1.0 | 2459, 8286 |
| 0.9 | 3909, 5459, 7321 |
| 0.8 | 6126, 6964, |
| 0.7 | 1281, 8711 |
NGC 4565 has both an HI-warp and a truncation in the stellar disk. On the sky the onset of the warp occurs close to the truncation in the stellar disk (e.g. Rupen, 1991). Fig. 27 in Rupen’s paper shows the “extreme velocities” channel maps and this demonstrates the point that the inner disk is very flat and that the warp sets in suddenly and abruptly. There is no detailed analysis of these data in terms of a rotation curve or a radial HI-distribution. Rupen’s plots (particularly his Fig. 16) show signs of drops in HI surface density and rotation velocity near the onset of the warp, but this needs detailed analysis (but see his Fig. 22 with the total HI. The stellar disk of NGC 4565 also has a moderate warp (van der Kruit & Searle, 1981a; see also Wu et al., 2002) in the same direction as in the HI.
NGC 5023 is a dwarf galaxy with the weakest evidence for a truncation in the stellar disk among these galaxies. The HI-observations of Bottema et al. (1986) show that the HI extends somewhat beyond the optical disk, but there is no warp and no clear features in the rotation curve or in the surface density distribution have been observed.
The classical example of an edge-on warp is in NGC 5907 (Sancisi, 1976). Casertano (1983) has shown that there is a drop in the rotation curve just at the truncation radius and he relates this to a sharp drop in density in the stellar disk. The radial distribution of the HI has been part of Casertano’s modelling; it appears from his figures to be dropping, but behaves relatively smoothly at the transition between the inner disk and the warp at about the truncation radius.
| Observed | ||||
|---|---|---|---|---|
| 1.2 | 1 | – | – | 3.3 |
| 1.1 | 2 | – | 3.5 | 2.5 |
| 1.0 | 2 | 3.6 | 2.6 | 1.7 |
| 0.9 | 3 | 2.7 | 1.8 | 1.4 |
| 0.8 | 2 | 1.9 | 1.5 | 1.3 |
| 0.7 | 2 | 1.6 | 1.4 | 1.2 |
| – | 6 | 8.1 | 7.2 | 6.6 |
| 0.706 | 0.963 | 0.538 |
The early-type galaxy NGC 7814 is very much spheroid-dominated. Yet, there is a straight dust-layer and a relatively faint HI-disk. Recent deep Westerbrok observations (Kamphuis et al., 2006) have shown evidence for extra-planar HI at faint levels. The geometry is still unclear.
From this inventory it appears that a warp in the HI generally starts rather abruptly at the edge of the disk and is often accompanied by a drop in the rotation curve and in the HI surface density distribution. The feature in the rotation curve would be related to the fact that the truncation radius corresponds not only to a rather sharp radial drop-off in the light but also in the radial total density distribution.
Next I look at those systems in the García-Ruiz et al. sample that have warps and appear in Table 4. García-Ruiz et al. find that the radial surface density profile of a warped galaxy has the typical form when normalised to a fiducial (tabulated in Table 2), which corresponds to a face-on surface density of 1.0 M⊙ pc-2 of HI. The surface density is roughly constant to slowly decreasing in the inner part, followed by a faster drop that sets in around a 0.5 , extending out at low levels to 1.5 to 2 times . They conclude then (see also their Fig. 9) that “it is in the second part of the profile (the steepest part, around the optical edge) where a warp develops in most of the galaxies”. Evidently it is a general feature that the HI surface density drops steeply at the radius of the onset of the warp. In Table 6 I look at possible features in the rotaton curve as judged from Fig. 7 in García-Ruiz et al. (2002). Sometimes the rotation curve has not been derived into the warp region or is significantly different on the two sides. In a number of cases the rotation curve peaks near and/or shows a definite decline just beyond that.
| UGC | ||
|---|---|---|
| 1.2 | 3137 | Sharp drop in rotation curve at |
| 1.1 | 5452 | No rotation curve given beyond |
| 1.1 | 7774 | Drop in rotation curve beyond |
| 1.0 | 2459 | No clear features near |
| 1.0 | 8286 | Drop in rotation curve beyond |
| 0.9 | 3909 | No feature in rotation curve near |
| 0.9 | 5459 | Asymmetric; no consistent behavior near |
| 0.9 | 7321 | Drop in rotation curve beyond |
| 0.8 | 6126 | Drop in rotation curve on one side beyond |
| 0.8 | 6964 | No obvious feature around |
| 0.7 | 1281 | Asymmetric; no consistent behavior near |
| 0.7 | 8711 | Rotation curve peaks near |
For face-on samples we cannot easily measure the truncation radius. However, following the rules of Briggs we may investigate the behaviour of the surface density of HI at the Holmberg radius. For definiteness (see also the Appendix) I take the face-on surface luminosity that corresponds to 26.5 B-mag arcsec-2 for a definition of a “Holmberg” radius. Again one needs galaxies that have both surface photometry and HI-data and a useful sample then is the Wevers et al. (1986) “Palomar-Westerbork Survey of Northern Hemisphere Galaxies”. For each galaxy in this survey there is a listing of the radial luminosity and HI surface density profiles corrected to face-on. In the B-band a surface luminosity of 1 L⊙ pc-2 corresponds to 27.05 B-mag arcsec-2, so with the conversion to the J-band of Wevers et al. for a mean (B-V) of 0.7 the “Holmberg” surface luminosity corresponds to 1.7 L⊙ pc-2. I will designate this radius as . For almost all systems in the sample correlates with the steepest part of the face-on HI surface density profile and therefore is entirely in agreement with the conclusion of García-Ruiz et al. There are three systems on which some more detailed mention should be made.
The first is NGC 628, which has a clear warp (Shostak & van der Kruit, 1984; Kamphuis & Briggs, 1992), the plane of the HI actually going through the plane of the sky. Photometry in Shostak & van der Kruit possibly has revealed a truncation in the stellar disk. Both occur at the same radius (see also discussion in van der Kruit, 2001) and it also corresponds to . The radial HI-profile drops steeply at the radius of the onset of the warp and then continues with a much slower decline. A similar picture emerges for NGC 3726, for which the velocity field shows very clear signs of a kinematical warp, that starts at about 3 arcmin radius; this is close to and again beyond the onset of the warp the HI surface density profile flattens. In NGC 5055 comes out as 8.1 arcmin (or 17 kpc on the distance scale of Battaglia et al., 2006). The radius where the tilted ring model of Battaglia et al. starts to show the onset of the warp is somewhat further in (more like 11 or 12 kpc). The luminosity profile of Wevers et al. shows a well-defined exponential disk out to 11 arcmin (23 kpc; the observed surface brightness is 27.5 J-mag arcsec-2 there), well into the HI-warp. The radial HI surface density profile flattens off and becomes almost flat just beyond .
After examining all galaxies in the Wevers et al. sample it appears to be the case that near there generally is a steep gradient in the HI surface density and that when there is a warp (judged from the velocity field) this usually develops in this area, where also the Holmberg radius would be located, in agreement with Brigg’s rule. It remains to be investigated to what extent the classical Holmberg radius or corresponds to a truncation radius as we see it in edge-on galaxies. Alternatively, one should investigate the relation between the truncation radii defined by Pohlen & Trojillo (2006), which occur at brighter levels of surface brightness than the Holmberg radius, on the one hand and kinematical evidence for warps in the gas on the other. Unfortunately, HI-observations are not available for most galaxies in the Pohlen & Trujillo sample or difficult to obtain because of their angular size.
5 Summary of warp properties and possible origins of warps and truncations
We then have the following general characteristics:
Whenever a galaxy has an extended HI-disk with respect to the
optical disk, it has an HI-warp (García-Ruiz et al.).
Many galaxies, but not all, have relatively sharp truncations,
which are most easily identified in edge-on systems (Kregel et al., 2002;
this paper). Evidence for truncations or breaks in the radial surface
brightness profiles has been found in less inclined systems (see Pohlen & Trujillo, 2006), but that requires much more carefull photometry then
the method employed here.
When an edge-on galaxy has an HI-warp the onset occurs
just beyond the truncation radius (this paper). In less inclined
galaxies the warp is seen at the boundaries of the observable optical
disk, which corresponds to the Holmberg radius (Briggs, 1990.).
In many cases the rotation curve shows a decline at about the
truncation radius (Casertano, 1983; Bottema, 1996; this paper), which
indicates that the truncation does not only occur in the light, but also
in the mass.
The onset of the warp is abrupt and discontinuous (see discussion
above) and coincides in the large majority of
cases with a steep slope in the radial HI surface density distribution
(García-Ruiz et al.; this paper) after which this distribution flattens
off considerably. In galaxies, where the HI does not extend beyond the
optical radius the decline is of course even steeper, but the point here is
that the character of the HI-layer changes substantially at the radius where
the warp starts (see also Briggs, 1990).
The inner disks are extremely flat in the dust and gas
distributions (see discussion above), while stellar disks show only very small
warps, if any (de Grijs, 1997). The onset of the warp is abrupt (this
paper) and beyond that the plane of the warp defines a “new
reference frame” (Briggs, 1990).
These characteristics seem to point to a picture in which the inner disk out to the boundaries of the stellar disk on the one hand and the outer warped HI-layers on the other are distict components. The “new reference frame” that Briggs (1990) quotes manifests itself in inclined galaxies as a change in the line-of-nodes inside and outside the transition radius where the warp starts. Briggs discusses this in the context of the model for bending modes in self-gravitating disks of Sparke & Casertano (1988). These authors do find that discrete bending modes are possible, starting at about the truncation radius. However, they also conclude that these are only discrete when the truncations in the stars and in the gas are very sharp, occurring in a fraction of a scalelength. This is much sharper than is observed. Models with oblate dark matter halos allow discrete modes independent of the details of the truncation itself. However, as pointed out by Briggs (1990), these models require that the disks inside and outside of the onset of the warp should have a common line-of-nodes, contrary to what is observed. On this basis Briggs concludes that the lack of a common line-of-nodes throughout the entire warped disk predicted by models that rely on normal bending modes to maintain warp coherence at all radii argues against such models.
Briggs (1990) already concluded that these are two different “regimes”, each having its own reference frame and states that the physical significance of this is not clear. I stress here the abruptness of the transition and the coincidence of the truncation radius with the sharp drop in HI surface density. This fits in a picture in which the two components are formed during separate epochs. The first, which may last for a number of Gyr, is the formation of the inner disk. It is not important for this discussion whether that is monolithic or proceeds in a hierarchical manner. Disk then have natural boundaries associated with the maximum specific angular momentum of the material from which it formed. Stellar disks then are well-bounded structures with little HI beyond their boundaries when this phase is completed. The orientation in space results from the integrated angular momentum that has been collected in it.
The second phase comes at a later stage, when material falls in in the form of gas with generally a different orientation of angular momentum. A major part will have higher specific angular momentum then that at the truncation of the disk and will settle at larger radii and in a different plane. The fundamental point is the dichotomy between the inner disk and the warped outer HI-layer. The outer reference frame of Briggs would then correspond to the orientation of the angular momentum of the material that settles in the warped outer disk.
In this picture the truncations in the stellar disks would result from the maximum specific angular momentum present in the disk after the first epoch of formation of the inner disk. This would mean also that the origin of these truncations is not related to a threshold for the occurence of star formation, since there would be little gas beyond the truncation to form stars. Galaxies that look like this still exist; in the García-Ruiz et al. sample there are four galaxies with little or no HI beyond the optical extent. E.g. UGC 7151 does show a truncation, but no gas beyond that radius. For such cases there is no need to invoke an inhibition of star formation since there is essentially no gas in the first place.
The observation that the central surface brightness appears to correlate with the ratio , indicates that the surface brightness at the radius where the truncation occurs is roughly constant between galaxies (Kregel & van der Kruit, 2004; Pohlen & Trujillo, 2006) and this in turn suggests that this is also the case for the mass surface densities. This fits in the picture of a threshold for star formation, which would imply that there is only a truncation in the light, but not in the mass. The most likely instability to produce this is gravitational instability as described by the Goldreich–Lynden-Bell (1965) criterion. As van der Kruit & Searle (1982a) already showed, this criterion appears to be a poor predictor of the truncation radius, although it may be adapted as by Schaye (2006) to better fit the data. More importantly, a number of detailed analyses (in particular in NGC 5907 and NGC 4013; see above) indicate that the rotation curves show the effects of a truncation in the mass, as would be expected in the model where the truncation results from a maximum in the specific angular momentum. The correlation of the ratio with the face-on surface brightness (righthand panel in Fig. 1 of Kregel & van der Kruit) then indicates that some redistribution of angular momentum is required in this picture.
In most cases the truncation radius seems to correspond to very steep slopes in the current gas surface density. The way this fits into the picture suggested here is the following. After formation of the inner disk, there was presumably little or no gas left beyond the truncation radius and the gas we observe today fell in later over a protracted period. Then there is no need to invoke a threshold for star formation as the origin of the truncations. At the end of the formation of the stellar disk there simply was no gas present at radii beyond the truncation.
The picture, where the truncation is explained as a result of a collapse of a protogalaxy with a well-defined maximum in the specific angular momentum distribution (van der Kruit, 1987), the protogalaxy is assumed to be a Mestel sphere (with uniform density and uniform rotation). In the case of detailed conservation of angular momentum during a collapse in the potential field of a dark halo that corresponds to a flat rotation curve, the resulting disk then becomes automatically exponential as observed while the truncation radius occurs around 4.5 scalelengths. Observations suggest that this ratio is more like 4.0 1.1 with a tendency to increase for smaller values of the scalelength (Fig. 1, left panel in Kregel & van der Kruit, 2004; see also references to earlier work therein), suggesting that the initial distribution is not precisely like a Mestel sphere and/or that there is no complete conservation of specific angular momentum.
The referee of this paper has asked me to consider alternatives to this picture of late accretion events for the gas in the warp. In particular in the hierarchical model, one would expect that many accretion events (of small galaxies and gas clouds) would occur and then it is not obviouw why the warped outer plane would represent a well-defined, single reference frame (one of Brigg’s rules of behaviour). So the alternative picture in which the gas was already present when the warp was formed as result of environmental effects, such as for example through tidal interactions (Reshetnikov $ Combes, 1998) or as a result of a galaxy disk moving through a low density intergalactic medium (e.g. López-Corredoira et. al, 2002) could offer explanations as well.
I think these explanantions do work as well. The important point remains that the very flat inner disk should not be affected by these processes and this can be accomplished if indeed these inner disks form relatively quickly in the evolution of the galaxy. They would have to be massive enough to evolve into a stable, very flat disk with a well-defined outer boundary that corresponds to the currently observable truncation radius. If then subsequently HI is accreted with higher angular momentum on a somewhat longer timescale that comes in with a range of orientations of angular momentum then the processes of tidal interaction or of moving through an intergalactic medium could be responsible for rearranging this into well-defined warps with a single reference frame. This is of course rather speculative, but the basis point remains that there are two distinct epochs, one in which the inner disks forms and a later one where the outer material is accreted and subsequently rearanged into the observed warps in the HI.
The referee also asked my to comment on why the warp starts at 1.1 and not some other value if material with various different angular momenta is accreted. On these I have to be even more speculative. If indeed the first phase gives rise to a very flat stellar disk, then this should be a fairly massive and rigid structure that conserves its flatness very well, except maybe very close to the edges, where the (minor compared to HI) stellar warps are found. One then has to assume that subsequently material is accreted with a range of angular momenta and that material that would have specific angular momenta corresponding to radii within the disk boundaries settle in it without much disturbing the flatness of the stellar disks. This is maybe not unlikely in view of the much larger amount of mass already collected in the inner disks during the earlier phase. Material with higher specific angular momenta settle at a range of radii, from just outside the disk to at much larger distances. Again we will have to assume that the inner disk is then sufficiently rigid so that it is not significantly disturbed when this outer material is rearranged into the regular warp with a well-defined “reference frame”. It is not unreasonable to assume that such a disk looses the capability to attract gas towards its plane –as it does when it is inside its outer edge– not much beyond its boundary at the truncation radius and a mean value of 1.1 does not seem surprising.
6 Conclusions
-
1.
The Sloan Digital Sky Survey (SDSS) can be used in a simple way to investigate the presence of truncations in the disk light distributions in a uniform and consistent manner.
-
2.
The edge-on galaxies in the sample of García-Ruiz et al. (2002) shows in the majority (17 out of 23) of cases evidence for truncations in their stellar disks.
-
3.
When an HI-warp is present it starts at about 1.1 (the truncation radius).
-
4.
There is a discontinuous and abrupt transition to the warped disk, occuring at the truncation of the stellar disk, where also the HI surface density drops steeply.
-
5.
These findings suggest that the inner flat disk and the outer warped disk are distinct components with a quite separate formation history, probably during quite different epochs.
-
6.
This picture is consistent with the view that truncations result from the maximum specific angular momentum in the material that formed the inner disk and there is no need to invoke a threshold to star formation to explain the occurence of truncations in edge-on galaxies.
Acknowledgements.
A significant fraction of this work was done during a short sabattical visit to the Space Telescope Science Institute in Baltimore. I thank the director, Matt Mountain, for financial support and Ron Allen for organizing this visit and stimulating discussions with him and his students and postdocs. The visit was also supported from the special grant that the Faculty of Mathematics and Natural Sciences of Groningen University puts at my disposal in connection with my Jacobus C. Kapteyn honorary professorship. The manuscript was revised during the stay as a visiting scientist at the Santiago offices of the European Southern Observatory; I am grateful to Catherine Cesarzky and Felix Mirabel for hospitality during this period.I thank Koen Kuijken and Renzo Sancisi for comments on drafts of this paper and for permission to use figures from the García-Ruiz et al. paper. I thank the referee for carefully reading the manuscript and making detailed comments and suggestions.
This research made use if the Sloan Digital Sky Survey. unding for the SDSS has been provided by the Alfred P. Sloan Foundation, the National Aeronautics and Space Administration, the National Science Foundation, the U.S. Department of Energy, the Japanese Monbukagakusho, and the Max Planck Society.
Use was also made of the Digitized Sky Surveys. The DSS were produced at the Space Telescope Science Institute under U.S. Government grant NAG W-2166. The images of these surveys are based on photographic data obtained using the Oschin Schmidt Telescope on Palomar Mountain¡ california and the UK Schmidt Telescope on Siding Spring Observatory, Australia.
References
- (1) Andredakis, Y.C. & van der Kruit, P.C., 1992, A&A 265, 396.
- (2) Arp, H.C., 1961, ApJ 133, 869.
- (3) Battaglia, G., Fraternali, F., Oosterloo, T. & Sancisi, R., 2006, A&A 447, 49.
- (4) Binney, J.J., 2006, Island Universes: Structure and Evolution of Disk Galaxies, ed. R.S. de Jong, Springer, Dordrecht, p. 67.
- (5) Binney, J.J. & Merrifield, M., 1998, Galactic Astronomy, Princeton Univ. Press, Princeton.
- (6) Bell, E.F. & de Jong, R.S., 2000, MNRAS 312, 497.
- (7) Bland-Hawthorn, J., Vlajić, M., Freeman, K.C. & Draine, B.T., 2005, ApJ 629, 239.
- (8) Bosma, A., 1981, AJ 86, 1825.
- (9) Bottema, R., 1995, A&A 295, 605.
- (10) Bottema, R., 1996, A&A 306, 345.
- (11) Bottema, R., Shostak, G.S. & van der Kruit, P.C., 1986, A&A 167, 34.
- (12) Bottema, R., Shostak, G.S. & van der Kruit, P.C., 1987, Nature 328, 401.
- (13) Briggs, F.H., 1990, ApJ 352, 15.
- (14) Burke, B.F., 1957, AJ 62, 90.
- (15) Casertano, S., 1983, MNRAS 203, 735.
- (16) Debattista, V.P. & Sellwood, J.A., 1999, ApJ 513, L107.
- (17) de Grijs, R., 1997, Ph.D. thesis, University of Groningen (http://dissertations.ub.rug.nl/faculties/science/1997/r.de.grijs/)
- (18) de Jong, R.S., 1996, A&A 313, 377.
- (19) de Vaucouleurs, G., de Vaucouleurs, A., Corwin, H.G., Buta, R.J., Paturel, G. & Fouqué, P., 1991, Third Referene Catalogue of Bright Galaxies, Springer, New York.
- (20) Fall, S.M. & Efstathiou, G., 1980, MNRAS 193, 189.
- (21) Florido, E., Battaner, E., Guijarro, A., Garzón, F. & Castillo-Morales, A., 2006, A&A 455, 475
- (22) Freeman, K.C., 1970, ApJ 160, 811.
- (23) Freeman, K.C., 2006, Island Universes: Structure and Evolution of Disk Galaxies, ed. R.S. de Jong, Springer, Dordrecht, p. 3.
- (24) Fry, A.M., Morrison, H.L., Harding, P. & Boroson, T.A., 1999, AJ 118, 1209.
- (25) García-Ruiz, I., 2001, Ph.D. thesis, University of Groningen (http://dissertations.ub.rug.nl/faculties/science/2001/i.garcia-ruiz/).
- (26) García-Ruiz, I., Sancisi, R. & Kuijken, K.H., 2002, A&A 394, 796.
- (27) Goldreich, P. & Lynden-Bell, D., 1965, MNRAS 130, 97.
- (28) Holmberg, E.B., 1937, Ann. Obs. Lund, No. 6.
- (29) Holmberg, E.B., 1946, Medd. Lunds Astr. Obs. II, No. 117.
- (30) Holmberg, E.B., 1950, Medd. Lunds Astr. Obs. II, No. 128.
- (31) Holmberg, E.B., 1958, Medd. Lunds Astr. Obs. II, No. 136.
- (32) Holmberg, E.B., 1975, In: “Galaxies and the Universe: Stars and Stellar Systems, Vol. IX”, ed. A.Sandage, M. Sandage & J. Kristian, Univ. of Chicago Press, p. 123.
- (33) Holwerda, B.W., 2005, Ph.D. thesis, University of Groningen (http://dissertations.ub.rug.nl/faculties/science/2005/b.w.holwerda/)
- (34) Holwerda, B.W., Gonzalez, R.A., Allen, R.J. & van der Kruit, P.C., 2005, AJ 129, 1396.
- (35) Kamphuis, J.J. & Briggs, F.H., 1996, A&A 253, 335.
- (36) Kamphuis, J.J., Sijbring, L.G. & van Albada, T.S., 1996, A&AS 116, 15-20.
- (37) Kamphuis, P., Peletier, R.F., van der Kruit, P.C., Oosterloo, T.A. & Sancisi, R., 2006, Island Universes: Structure and Evolution of Disk Galaxies, ed. R.S. de Jong, Springer, Dordrecht, p. 303.
- (38) Kerr, F.J., 1957, AJ 62, 93.
- (39) Kormendy, J. & Bahcall, J.N., 1973, AJ 78, 255.
- (40) Kregel, M. & van der Kruit, P.C., 2004, MNRAS 355, 143.
- (41) Kregel, M., van der Kruit, P.C. & de Grijs, R., 2002, MNRAS 334, 646.
- (42) Larson, R.B., 1976, MNRAS 176, 31.
- (43) López-Corredoira, M., Betancort-Rijo, J. & Beckman, J.E., 2002, A&A 386, 169
- (44) Morrison, H.L., Boroson, T.A. & Harding, P., 1994, AJ 108, 1191.
- (45) Morrison, H.L., Miller, E.D., Harding, P., Stinebring, D.R. & Boroson, T.A., 1997, AJ 113, 2061.
- (46) Olling, R.P., 1996, AJ 112, 457.
- (47) Pohlen, M. & Trujillo, I., 2006, A&A 454, 759.
- (48) Reshetnikov, V., Battaner, E., Combes, F. & Jiménez-Vicente, J., 2002, A&A 382, 513
- (49) Reshetnikov, V. & Combes, F., 1998 A&A 337, 9
- (50) Rogstad, D.H., Lockart, I.A. & Wright, M.C.H., 1974, ApJ 193, 309.
- (51) Rupen, M.P., 1991, AJ 102, 48.
- (52) Sancisi, R., 1976, A&A 74, 73.
- (53) Sancisi, R., 1983, IAU Symp. 100, Internal kinematics and dynamics of galaxies; Proceedings of the Symposium, ed. E. Atyhanasoulla, Dordrecht, Reidel, 1983, 55.
- (54) Schaye, J., 2004, ApJ 609, 667.
- (55) Shen, J. & Sellwood, J.A., 2006, MNRAS astro-ph/0604529.
- (56) Shostak, G.S. & van der Kruit, P.C., 1984, A&A 132, 20.
- (57) Sparke, L.S. & Casertano, S., 1988, MNRAS 234, 873.
- (58) Swaters, R.A., Sancisi, R. and van der Hulst, J.M., 1997, A&A 491, 140.
- (59) Trujillo, I. & Pohlen, M., 2006, Island Universes: Structure and Evolution of Disk Galaxies, ed. R.S. de Jong, Springer, Dordrecht, p. 235.
- (60) van der Kruit, P.C., 1979, A&AS 38, 15.
- (61) van der Kruit, P.C., 1987, A&A 173, 59.
- (62) van der Kruit, P.C., 2001, Galaxy Disks and Disk Galaxies, ed. J.G. Funes & E.M. Corsini, ASP Conf. Ser. 230, p.119.
- (63) van der Kruit, P.C. & Searle, L., 1981a, A&A 95, 105.
- (64) van der Kruit, P.C. & Searle, L., 1981b, A&A 95, 116.
- (65) van der Kruit, P.C. & Searle, L., 1982a, A&A 110, 61.
- (66) van der Kruit, P.C. & Searle, L., 1982b, A&A 110, 79.
- (67) van der Kruit, P.C. & Shostak, G.S., 1982, A&A 105, 359.
- (68) van der Kruit, P.C. & Shostak, G.S., 1984, A&A 134, 258.
- (69) Verheijen, M.A.W., 1997, Ph.D. thesis, University of Groningen (http://dissertations.ub.rug.nl/faculties/science/ 1997/m.a.w.verheijen/)
- (70) Verheijen, M.A.W. & Sancisi, R., 2001, A&A 370, 765.
- (71) Wevers, B.M.H.R., van der Kruit, P.C. & Allen, R.J., 1986, A&AS 66, 505.
- (72) Wu, H., Burstein, D., Deng, Z. et al. (another 29 authors), 2002, AJ 123, 1364.
- (73) Xilouris, E.M., Alton, P.B., Davies, J.I., Kylafis, N.D., Papamastorakis, J. & Trewhella, M., 1998, A&A 331, 894.
Appendix A The Holmberg radius and Holmberg’s observations of edge-on galaxies
The Holmberg radius (and for that matter ; the radius at 25 B-mag arcsec-2 in the RC3: de Vaucouleurs et al., 1991) refers to levels of surface brightness that are not corrected for the geometrical effects of the inclined orientation of the disk. In principle this correction should be performed in comparative studies such as that of Briggs (1990) and, although not entirely straightforward when no detailed surface photometry is available, can be done reasonably reliably in a statistical sense. The geometrical correction is not small and the effect of applying it is not negligible. For example, for a face-on disk with a central surface brightness of 21.65 B-mag arcsec-2 (Freeman, 1970) is at 3.09 ( is the exponential scalelength) and at 4.47. If the galaxy is inclined by 45∘ the observed central surface brightness has brightened to 21.27 B-mag arcsec-2 and we find then at 3.43 and at 4.81 along the major axis. These are differences of the order of 10% and a substantial fraction of Briggs’ galaxies are more inclined then 45∘. I describe and discuss here the definition of the Holmberg radius and how Holmberg derived them.
It appears that there is much ignorance and confusion
about the origin of the concept of the Holmberg radius and how it
was originally defined. For example,
the first four items that I found after doing a search for “Holmberg Radius”
in Google gave the following links and descriptions:
www.daviddarling.info/encyclopedia/H/Holmberg_radius.html:
“A criterion, developed by Erik Holmberg in 1958, to estimate the size of
a galaxy without regard to its orientation in space. It is the radius at
which the surface brightness is 26.5 magnitudes per square arcsecond in blue
light.”
scienceworld.wolfram.com/astronomy/HolmbergRadius.html:
“The radius of the isophote of an elliptical galaxy corresponding to a
surface brightness of 26.5 blue magnitudes per square arcsecond.”
www.site.uottawa.ca:4321/astronomy/index.html#Holmberg-
radius:
“The radius of an external galaxy at which the surface brightness is
26.5 mag arcsec-2. This criterion was developed by Holmberg in 1958
to estimate the actual dimensions of the major and minor axes of a galaxy
without regard to its orientation in space.”
de.wikipedia.org/wiki/Holmberg-Radius:
“Der Holmberg-Radius ist eine Methode zur Abschätzung des Radius einer
elliptischen Galaxie. Er wurde nach dem schwedischen Astronom Erik Bertil
Holmberg benannt.
Der Holmberg-Radius ist definiert als die Länge der großen Halbachse
der Galaxie bis zu der Isophoten (…), die einen
Bereich der Oberflächenhelligkeit von = 26.5 mag/arcsec2
umschließt. Gemessen wird dabei im sogenannten B-Band (…).
Der Holmberg-Radius gibt also den
Bereich einer Galaxie an, aus dem der größte Teil des Lichtes kommt
(26,5 Magnituden entsprechen dabei etwa 1 bis 2 Prozent der Helligkeit des
Nachthimmels).”444The Holmberg radius is a method to estimate the
radius of an elliptical galaxy. It was named after the Swedish astronomer
Erik Bertil Holmberg. The Holmberg radius is defined as the length of half
the major axis out to the isophote (…) that encloses
a surface brightness of = 26.5 mag/arcsec2.
This is measured
in the so-called B-Band (…). The Holmberg radius therefore
shows the extent of a galaxy from which the majority of the light
originates (26.5 magnitudes corresponds to about 1 to 2 percent of the
brightness of the night sky).
There was no such entry in the English version of Wikipedia.
So, what is the definition of the Holmberg radius? The original reference is the study Holmberg published in 1958 entitled “A Photographic Photometry of Extragalactic Nebulae; I. A Study of Integrated Magnitudes and Colors of 300 Galaxies” (Holmberg, 1958), in which he reported on a heroic undertaking of microphotometer tracings of photographic plates (both in the photographic band with 103a-O emulsion and in the photovisual band with 103a-D or 103a-C emulsion behind a Schott 11 filter), mostly taken at Mount Wilson between 1947 and 1955. The 1205 individual magnitude measures were performed by scanning plates that on one half were exposed in focus to the galaxy and the other half out of focus to a set of standard stars in the North Polar Sequence or in Selected Area 57. The scans of the galaxies were performed along the major and minor axes. This method goes back to much earlier work by Holmberg (1937, 1946, 1950).
Holmberg defines his diameters as the positions where the relative photographic density (that of galaxy + sky compared to sky alone) is 0.5%. This, he notes, is “close to the practical measuring limit”, and “corresponds, on an average, to surface magnitudes of 265 (photogr. reg.), and 260 (photov. reg.)” (Holmberg, 1958, p. 12). So, a Holmberg radius is not defined at a specific surface brightness in a certain photometric band and corrected for orientation, but rather corresponds in a statistical sense among Holmberg’s sample to certain approximate observed surface brightnesses in the photographic and photovisual bands. Subsequent to Holmberg’s study, Holmberg radii have been quoted as related to be the isophote at 26.5 magnitudes per square arcsec in the Johnson -band, which is close to the photographic (pg) band555The transformation can be written as (see Kormendy & Bahcall, 1973, based on Arp, 1961).. New and independent measurements of radii of galaxies appeared in the literature much later, since it took many years after Holmberg’s pioneering study before surface photometry to the required level became available.
The notion that the Holmberg radius defines the dimension of a galaxy “without regard to its orientation in space” is incorrect, while it also is not true that it applies to elliptical galaxies. So, why did Holmberg choose not to correct his diameters for the geometrical effects of the orientation? Holmberg (1958) discusses the effect of inclination on his diameters on page 44: “ However, the observed surface magnitude of a spiral system depends on the inclination, and there thus is a possibility that the diameter of a nebula having an edgewise orientation is measured too large as compared to the diameter of a nebula oriented in the celestial plane. According to the writer’s opinion the systematic effect is probably small. Firstly, the difference in surface magnitude between nebulae of incl. 0∘ and 90∘ is of a moderate size on account of the internal absorption, and, secondly, the surface magnitude gradients are in the outmost parts of spiral nebulae rather steep.” In Holmberg’s chapter in Stars and Stellar Systems IX (Holmberg, 1975; but written before 1966) he estimates that “the change in measured major diameter would be about 7 percent, if the surface brightness is assumed to increase by a factor of 2”.
Holmberg asserted (largely on the basis of his statistical study of the apparent surface brightness as a function of axis ratio on the sky) that the effects of dust absorption would to a large extent compensate for the geometrical effects such that no correction was required. There is now considerable evidence that in galaxy disks the opacity in the outer parts, where the diameters are defined, is probably small (Holwerda et al., 2005; see also Holwerda, 2005 and Andredakis & van der Kruit, 1992) and the geometrical correction in the measurement of disk radii is probably justified. It is of interest to do the comparison for the Wevers et al. (1986) sample, where we can derive the radius at 26.5 J-mag arcsec-2 (which is very close to the B-band) and the radius at 1.7 L⊙,J pc-2 face-on surface luminosity and for most of which there are original diameters derived by Holmberg (1958) . The ratio to the is 0.98 0.12, which shows the remarkable accuracy of Holmberg’s photometry, especially considering the observational difficulties that he faced and the –compared to current standards– primitive techniques and equipment he had at his disposal. Comparison with reveals of course the inclination distribution of the sample; in this case the ratio to is 1.22 0.16. So there is statistically a substantial uncertainty depending on whether or not application of the full geometric correction is justified or not.
The RC3 (de Vaucouleurs et al.,1991) lists as the corrected (for extinction and inclination) diameter out to the isophote of 25 B/mag arcsec-2. This is derived from the uncorrected diameter to that isophote . Here there also is confusion. E.g. Binney and Merrifield (1998, p.61) describe with reference to the RC3 as “the diameter that one estimates the isophote would have if the galaxy were seen face on and unobscured by dust”. That is not in the RC3, which uses for the corrected diameter. Confusing the issue this way is bad practice.
It is of interest to see what Holmberg quotes for the edge-on galaxies in his sample. When the apparent sharp edges of galaxies such as NGC 4565 were first noted (van der Kruit, 1979), I felt it was so obvious that edge-on disks as this galaxy do not grow in the radial direction with deeper exposures that it would have been found before. Holmberg’s (1958) study was an obvious candidate. It has six edge-on systems in its sample, of which 4 overlap with that studied by van der Kruit & Searle (1981a,b, 1982a,b), namely NGC 891, 4244, 4565 and 5907. I analyzed the additonal two (NGC 4631 and 5746) using the SDSS in the same manner as described in this paper. In NGC 4631 there was clear evidence for a truncation, but NGC 5746 shows no obvious indication of such a feature. The measurements are shown in Table 7.
| Galaxy | ratio | ratio | ||||
|---|---|---|---|---|---|---|
| NGC 891 | 7.0 | 7.5 | 1.07 | 0.25 | 0.29 | 1.16 |
| NGC 4244 | 8.8 | 9.0 | 1.13 | 0.16 | 0.14 | 0.88 |
| NGC 4565 | 8.3 | 10.0 | 1.20 | 0.18 | 0.17 | 0.94 |
| NGC 4631 | 8.5 | 9.5 | 1.12 | 0.23 | 0.25 | 1.09 |
| NGC 5746 | 4.6 | 4.5 | 0.98 | 0.27 | 0.23 | 0.85 |
| NGC 5907 | 5.8 | 7.8 | 1.34 | 0.13 | 0.16 | 1.23 |
For NGC 5746 the listed is the faintest contour that could be measured and which is indicated as in this paper. Remarkably, it is the only case where the value listed by Holmberg is very close to the one derived fron the SDSS data. For the remaining galaxies the Holmberg radii are larger than the truncation radii. The average ratio is 1.17 0.10. In particular for NGC 4565 the radius that Holmberg finds is well beyond the radius where light can be traced even on the deepest images available nowadays. Holmberg certainly did not see the effect of a sharp decrease in surface brightness associated with the truncations. However, his axis ratios are very comparable to the ones derived here; the average ratio is . This implies that Holmberg overestimated the extents of the minor axes also.