Abstract
Context. IGR J184830311 is a poorly known transient hard X-ray source discovered by INTEGRAL during observations of the Galactic Center region performed between 23–28 April 2003.
Aims. To detect new outbursts from IGR J184830311 using INTEGRAL and archival Swift XRT observations and finally to characterize the nature of this source using the optical/nearinfrared (NIR) information available through catalogue searches.
Methods. We performed an analysis of light curves and spectra of INTEGRAL and archival Swift XRT data as well as of optical/NIR catalogues.
Results. We report on 5 newly discovered outbursts from IGR J184830311 detected by INTEGRAL. For two of them it was possible to constrain a duration of the order of a few days. The strongest outburst reached a peak flux of 120 mCrab (20–100 keV); its broad band JEM–X/ISGRI spectrum (3–50 keV) is best fitted by an absorbed cutoff power law with =1.40.3, cutoff energy of 22 keV and NH=91022 cm-2. Timing analysis of INTEGRAL data allowed us to identify periodicities of 18.52 days and 21.0526 seconds which are likely the orbital period of the system and the spin period of the X-ray pulsar respectively. Swift XRT observations of IGR J184830311 provided a very accurate source position which strongly indicates a highly reddened star in the USNO–B1.0 and 2MASS catalogues as its possible optical/NIR counterpart.
Conclusions. The X-ray spectral shape, the periods of 18.52 days and 21.0526 seconds, the high intrinsic absorption, the location in the direction of the Scutum spiral arm and the highly reddened optical object as possible counterpart, all favour the hypothesis that IGR J184830311 is a HMXB with a neutron star as compact companion. The system is most likely a Be X-ray binary, but a Supergiant Fast X-ray Transient nature can not be entirely excluded.
Key Words.:
1 Introduction
Since its launch in 2002, the INTEGRAL satellite has discovered more than one hundred new hard X-ray sources, mainly located toward the inner regions of the Galaxy which continue to be extensively monitored. Many of them are characterized by absorbed hard spectra, with little or no detectable emission in the soft X-rays since they are heavily absorbed by the interposing material. This, together with their often transient nature, explains why they have not been detected by any previous X-ray mission. As discussed by Dean et al. (2006), most of the newly discovered INTEGRAL sources should be high mass X-ray binaries (HMXBs), although Masetti et al. (2006a) found that several of them are actually Active Galactic Nuclei. This picture has been supported by various identifications with transient Be HMXBs or bright persistent highly absorbed supergiant HMXBs (SGXBs), either based on their secure identification at optical/infrared wavebands or on their X-ray characteristics and discovery of periodic pulsations (Walter et al. 2006). As well as the highly absorbed persistent SGXBs, INTEGRAL is also finding new members of a newly discovered class of SGXBs which escaped detection by previous X-ray missions mainly because of their fast X-ray transient behaviour. They have been labeled as Supergiant Fast X-ray Transients SFXTs (Negueruela et al. 2005, Sguera et al. 2005, Sguera et al. 2006).
| No. | Date | energy band | peak flux | peak luminosity | duration | No. ScWs | Exp. time |
|---|---|---|---|---|---|---|---|
| (keV) | (mCrab) | (erg s-1) | (days) | (ks) | |||
| 1 | 19 April 2006 | 20–100 | 120 | 7.81036 | 1.8 | 73 | 146.1 |
| 2 | 5 September 2004 | 20–60 | 95 | 4.351036 | 0.46 | 21 | 35.16 |
| 3 | 26 April 2004 | 20–60 | 80 | 3 | 54 | 188.66 | |
| 4 | 18 March 2004 | 20–40 | 135 | 0.33 | 16 | 28.29 | |
| 5 | 11 May 2003 | 20–60 | 75 | 3.21036 | 1.3 | 50 | 104.05 |
= lower limit on the duration.
= assuming a distance of 5.7 kpc (see Section 5).
The transient X-ray source IGR J184830311 was discovered with the IBIS instrument (Ubertini et al. 2003) on board the INTEGRAL satellite
during observations of the Galactic Center field performed between 23–28 April 2003 (Chernyakova et al. 2003).
The average X-ray flux was 10 mCrab and 5 mCrab in the energy bands 15–40 keV and 40–100 keV respectively.
A possible X-ray outburst was observed on 26 April, when the X-ray flux increased up to 40 mCrab (15–40 keV).
Subsequently its discovery, Molkov et al (2003a) reported another detection of the source by INTEGRAL on 5 April 2003.
IGR J184830311 has also been detected by INTEGRAL at an average flux of 4.30.2 mCrab (18–60 keV)
during a survey of the Sagittarius arm tangent region in the spring 2003 (Molkov et al. 2003b).
Stephen et al. (2006) reported the association between IGR J184830311 and the ROSAT HRI source 1RXH J184817.3-031017.
Two optical USNO–B1.0 objects were found within the ROSAT positional uncertainty (Monet et al. 2003), one of which is also a
near–infrared (NIR) 2MASS source (Skrutskie et al. 2006).
In this paper, we report in section 3.1 on IBIS detections of 5 newly discovered outbursts from IGR J184830311,
not reported in the literature so far. Moreover, through timing analysis of the INTEGRAL light curves, we identify two
periodicities which we interpret as being most likely attributable to the orbital period of the system (section 3.2)
and the spin period of an X-ray pulsar (section 3.3).
We report in section 4 on two archival Swift XRT observations of IGR J184830311 which provide a very accurate source position.
This allows us to pinpoint a highly reddened USNO-B1.0 star as the likely counterpart of the source, and its
optical/NIR properties are discussed in section 5.
2 INTEGRAL data analysis
IGR J184830311 was observed by JEMX (Lund et al. 2003) and by IBIS/ISGRI (Lebrun et al. 2003). The reduction and analysis of the data have been performed using the INTEGRAL Offline Scientific Analysis (OSA) v.5.1. INTEGRAL observations are typically divided into short pointings (Science Windows, ScWs) of 2000 seconds duration.
We performed an analysis at the ScW level of the deconvolved ISGRI shadowgrams searching for outburst activity from IGR J184830311. Our ScW data set consists of all Core Program observations (the Galactic Plane Survey and the Galactic Centre Deep Exposure) from revolution 45 (end of February 2003) to 430 (end of April 2006) as well as all public data released up to revolution 260. The search provided 5 newly discovered outbursts from IGR J184830311. Due to possible cross-talk between objects in the same field of view (FOV), we have also investigated the variability pattern of all other bright sources in the FOV, in addition to that of the source of interest. They have shown a different time variability enabling us to conclude that the light curves obtained for the source of interest are reliable. Images from the X-ray monitor JEMX were created for all newly discovered outbursts reported in this paper. Only in one case (outburst No.1 in table 1) was the source inside the JEMX FOV so that it was possible to extract a spectrum and a X-ray light curve.
3 INTEGRAL results
3.1 IBIS detections of 5 newly discovered outbursts from IGR J184830311
Table 1 lists the 5 newly discovered outbursts from IGR J184830311 detected by IBIS and discussed in the present paper. It provides the date and energy range of the detection, the flux and luminosity at the peak, the duration of the outburst activity, the number of ScWs during which the source is detected and the net exposure time.
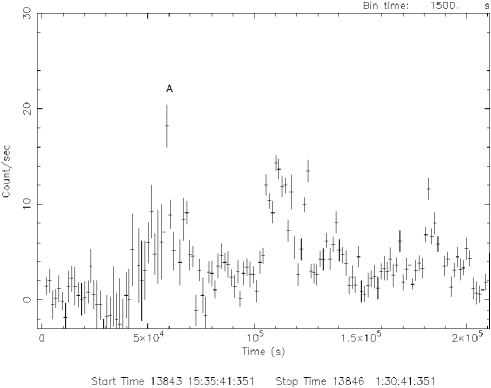
Fig. 1 shows the 20–100 keV ISGRI light curve of outburst No. 1. At the beginning there is no significant detection since the count rate is consistent with zero count/sec, then suddenly on 19 April 2006 04:50 UTC the source turned on. Initially, the outburst activity was characterized by a prominent flare (labeled as A in Fig. 1) which reached a peak flux of 120 mCrab or 2.0410-9 erg cm-2 s-1 (20–100 keV) in a few hours and then dropped with the same timescale. This first flare was followed by several others, then the source turned off. The duration of the total outburst activity was 1.8 days.
We combined all the ScWs during outburst No. 1 into a single mosaic significance map. IGR J184830311 was detected at 50 (20–100 keV), and its coordinates (J2000) are RA=18h 48m 15.07s, Dec=-03∘ 10 17, with an error radius of 1.4.
The combined JEMX/ISGRI spectrum (3–50 keV) from the whole duration of the outburst No.1 is best fitted by an absorbed cutoff power law (=1.19, 140 d.o.f.) with =1.40.3, NH=91022 cm-2 and cutoff energy equal to 22 keV. The absorption exceeds the galactic one along the line of sight (1.61022 cm-2), suggesting that most of the low energy absorption is intrinsic to the source. Fig. 2 displays the absorbed cutoff power law unfolded spectrum, while Fig. 3 shows the contour plot for the photon index and the cutoff energy. To account for a cross-calibration mismatch between the two instruments we have introduced a constant in the fit, which when left free to vary provides a value of 1.30.15. It is worth pointing out that a similarly good fit (=1.2, 141 d.o.f.) is also provided by an absorbed bremsstrahlung model with kT=21.5 keV and NH=7.51022 cm-2. The latter is compatible, within the uncertainties, with the value obtained from the absorbed cutoff power law spectral model.


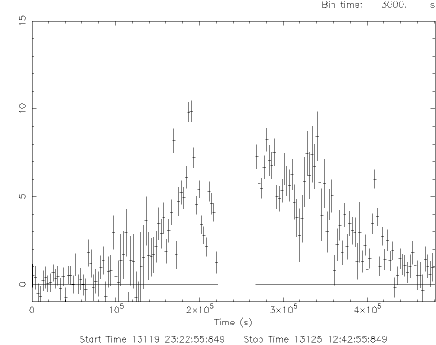
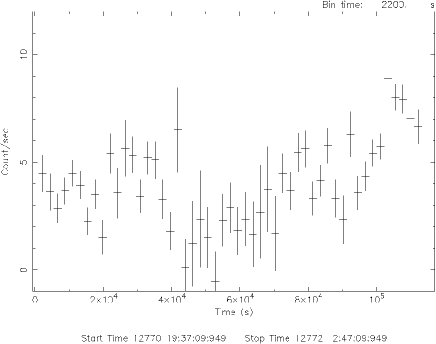
Fig. 4 shows the 20–60 keV ISGRI light curve of outburst No.2 that started on 5 September 2004 at 04:50 UTC and ended on the same day at 16:00 UTC. It is truncated at the beginning and at the end because the source was outside the IBIS FOV, so that it is not possible to constrain a total duration for the outburst activity. The source was in the IBIS FOV for 11 hours and its light curve is characterized by several fast flares (on timescales of few tens of minutes) reaching a maximum peak flux (20–60 keV) of 95 mCrab or 1.110-9 erg cm-2 s-1. The 20–60 keV spectrum extracted during the whole outburst is well fitted by thermal models such as black body (=0.97, 14 d.o.f., kT=6.5 keV) or bremsstrahlung (=0.61, 14 d.o.f., kT=20.6 keV). A good fit is also provided by a simple power law with =2.9 (=0.74, 14 d.o.f.). Fig. 5 shows the unfolded 20–60 keV bremsstrahlung spectrum.
Fig. 6 displays the 20–60 keV light curve of outburst No.3 in Table 1. The gap of 13 hours is due to the visibility constraint between one INTEGRAL revolution and the next. In spite of that, the flaring activity of the source is very evident. Initially the flux is consistent with zero, then suddenly the source turned on at 20:00 UTC on 26 April 2004 and reached a maximum peak flux of 80 mCrab (20–60 keV); the duration of the total outburst activity was 3 days. A spectrum extracted during the whole outburst (20–60 keV) is equally well fitted by a black body (=0.95, 14 d.o.f., kT=7.2 keV) or bremsstrahlung (=0.95, 14 d.o.f., kT=25.2 keV). A simple power law provides a bad fit (=2.05, 14 d.o.f). Fig. 7 shows the unfolded bremsstrahlung spectrum.
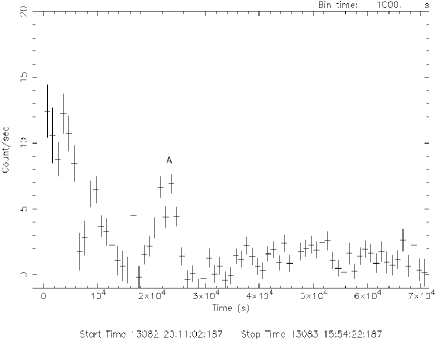
The ISGRI light curve (20–40 keV) of outburst No. 4 is shown in Fig. 8. The observations starts on 18 March 2004 at 20:00 UTC. The beginning was not observed because the source was outside the IBIS FOV. Nevertheless, the decay of the flare is clear, in fact the 20–40 keV flux dropped from 135 mCrab ( 1.0210-9 erg cm-2 s-1) to just a few mCrab in 4 hours. This strongly suggests that the source was active before entering the IBIS FOV. Another flare is present in the light curve (labeled as A): it reached a peak flux of 80 mCrab (20–40 keV) in 1 hour and then dropped to an almost null flux with the same timescale. The remaining part of the light curve shows no flaring activity from the source. The 20–60 keV spectrum extracted during its whole outburst cannot be fitted by a simple power law (=1.59, 14 d.o.f). Reasonable fits were obtained by thermal models such as black body (=0.85, 14 d.o.f., kT=7.8 keV) or bremsstrahlung (=1.26, 14 d.o.f., kT=32.5 keV). Fig. 9 shows the unfolded bremsstrahlung spectrum.


| Model | parameter | outburst No.1 | outburst No.2 | outburst No.3 | outburst No.4 | outburst No.5 |
| (3–50 keV) | (20–60 keV) | (20–60 keV) | (20–60 keV) | (20–60 keV) | ||
| wa+cutoffpl | NH(1022 cm-2) | 9 | ||||
| 1.40.3 | ||||||
| Ec | 22 | |||||
| (d.o.f.) | 1.19 (140) | |||||
| wa+bremss | NH(1022 cm-2) | 7.5 | ||||
| kT | 21.5 | |||||
| (d.o.f.) | 1.2 (141) | |||||
| bremss | kT | 26 | 20.6 | 25.2 | 32.5 | 22 |
| (d.o.f.) | 1.49 (142) | 0.61 (14) | 0.95 (14) | 1.26 (14) | 1.1 (14) | |
| bb | kT | 6.5 | 7.2 | 7.8 | ||
| (d.o.f.) | 4.86 (142) | 0.97 (14) | 0.95 (14) | 0.85 (14) | 3.23 (14) | |
| po | 2.9 | 2.9 | ||||
| (d.o.f.) | 2.65 (142) | 0.74 (14) | 2.05 (14) | 1.59 (14) | 0.85 (14) |
Finally, Fig. 10 shows the 20–60 keV ISGRI light curve of outburst No.5 in Table 1. It started on 11 May 2003 at 19:30 UTC and it ended on 13 May 2003 at 02:30 UTC. It is truncated at the beginning and at the end because the source was outside the IBIS FOV, so it is not possible to constrain a total duration of the outburst. The peak flux was 75 mCrab (20–60 keV). The 20–60 keV spectrum of the whole outburst is best fitted by a bremsstrahlung model (=1.1, 14 d.o.f) with kT=22 keV, whereas a black body is a very bad description to the data (=3.2, 14 d.o.f). A reasonable fit is also provided by a simple power law (=0.85, 14 d.o.f) with = 2.9. Fig. 11 shows the unfolded 20–60 keV bremsstrahlung spectrum.
Table 2 is a summary of the spectral analysis of each newly discovered outburst. Outburst No.1 is the only one for which a broad band spectrum (3–50 keV) is available. The cutoff power law model constrains very well its spectral properties both at soft and hard X-rays, with best fit parameters =1.40.3, Ec=22 keV and NH=91022 cm-2. Moreover, it can be noted that a bremsstrahlung model provided a good description of all 5 outbursts with a similar temperature kT in the range 20–32 keV. A black body gave good fits for the outbursts No. 2, 3 and 4 with a similar temperature kT in the range 6.5–7.5 keV, but is unacceptable in the case of the outbursts No. 1 and 5. Finally, a simple power law described well the spectra of outburst No. 2 and 5 providing the same value of the photon index (2.9) Whereas, outbursts No. 3 and 4 could not be described by a simple power law.
3.2 Recurrence timescale
We investigated the long term light curve of IGR J184830311 searching for any evidence of periodicity which would indicate the recurrence timescale of its transient activity. The flux of IGR J184830311 was extracted from each ISGRI pointing where the source was within 12∘ of the centre of the field of view, producing a long term light curve of the source on the ScW timescale. A 12∘ limit was applied because the off-axis response of ISGRI is not well modelled at large off-axis angles and consequently in combination with the telescope dithering (or the movement of the source within the FOV) introduces a systematic error in the measurement of source fluxes generating problems in the detection of periodic signals (Hill, 2006). The 20–40 keV light curve was then searched for periodicities using the Lomb-Scargle periodogram method by means of the fast implementation of Press & Rybicki (1989) and Scargle (1982). The resulting power spectrum is shown in Fig. 12; the peak power of 165.7 corresponds to a frequency of 0.0540 days-1. This frequency equates to a period of 18.52 days with a theoretical Lomb-Scargle error of 0.01 days. The error on the angular frequency is given by Horne & Baliunas (1986).
| (1) |
where N2 is the variance of the noise, N is the number of data points, T is the total length of the data set and A is the amplitude of the signal given by:
| (2) |
| Outburst No. | Expected start time (MJD) | INTEGRAL coverage (MJD) | Comments |
|---|---|---|---|
| 1 | 52714.48 | 52714.99– 52715.63 | Low level of outburst activity (maximum peak flux 20 mCrab) |
| 2 | 52733 | 52734.92– 52735.61 | Outburst reported by Molkov et al. 2003a (peak flux 40 mCrab) |
| 3 | 52751.52 | 52753.04– 52757.50 | Outburst when the source was discovered (Chernyakova et al. 2003) |
| 4 | 52770.04 | 52770.80– 52772.08 | Outburst discussed in this paper (No.5 in table 1) |
| 21 | 53084.88 | 53082.85– 53083.62 | Outburst discussed in this paper (No.4 in table 1) |
| 23 | 53121.92 | 53121.7 | Outburst discussed in this paper (No.3 in table 1) |
| 30 | 53251.56 | 53253.20–53253.60 | Outburst discussed in this paper (No.2 in table 1) |
| 62 | 53844.2 | Outburst discussed in this paper (No.1 in table 1) |
= start time of the outburst
where z0 is the Lomb-Scargle power and s2 is the variance of the light curve. The period estimate was confirmed with a Monte-Carlo simulation. Each flux measurement was adjusted using Gaussian statistics within its individual error estimate to generate a simulated light curve of the source. The corresponding periodogram was produced and any detected periodicity recorded. We simulated 200,000 light curves in this fashion and found that 99.5% identified a periodicity centred at 18.52 days. The phase-folded 20–40 keV lightcurve of IGR J184830311 is shown in Fig. 13. A clear flare-like profile is apparent, with the source being predominantly undetected and then briefly flaring to a detectable level. The average duration of an outburst can be seen to be of the order of 3 days (FWHM). This is consisted with the measured durations for outburst No. 1 and 3 in Table 1.


3.2.1 Looking for missed outbursts
The detected periodicity of 18.52 days indicates the recurrence timescale of outbursts from IGR J184830311, so that we could search for additional weaker outbursts in the INTEGRAL observations. Between the first and last observation analysed in this paper (52704 – 53846 MJD) 62 outbursts may have occurred. Using the measured start time (MJD53844.2) of outburst No. 1 in Table 1 and the periodicity of 18.52 days, the full long term light curve of IGR J184830311 was examined around the predicted outburst start times. To this aim, no off–axis angle limit was applied during the extraction of full long term ISGRI light curve. The results of this examination are shown in Table 3. Of the 62 potential outbursts, only 8 were well covered by INTEGRAL observations. For the outburst numbers not listed there was no significant coverage of the source by INTEGRAL around those times. These 8 outbursts include the 5 reported brightest ones in Table 1 and discussed in this paper, 2 outbursts with a low level of activity and the outburst when the source was discovered by Chernyakova et al. (2003). It should be noted that all but one of the outbursts listed in Table 2 occured when expected as based upon the 18.52 days periodicity. The only exception (No. 21 in Table 2 or No.4 in Table 1) occured at least 2 days earlier than expected. This may in part be explained by the difficulty in identifying a period when each outburst has a unique shape, moreover only 2 out of 5 outbursts detected by IBIS have been seen for their entire duration. Consequently the statistical error assigned to the 18.52 days period is likely to be underestimate. However, it might also indicate that the outbursting behaviour of the source is only semi-regular, implying that there may be something which modulates the outburst time scale beyond the mechanism that produces the periodicity. This behaviour could be similar to that observed in Be X-ray transients in which the outbursts are associated with both the orbital period of the system and with the size of the disk around the Be star.
3.3 Searching for a pulse period


Fine timing resolution ISGRI light curves (20–40 keV) were constructed for the duration of the two brightest outbursts (No. 1 and No. 4) in Table 1, using the ii–light tool in OSA5.1. A search for pulsations was performed using the Lomb-Scargle periodogram method with no positive results.
However, IGR J184830311 was also inside the JEM-X FOV during part of the outburst No.1 in Table 1. Consequently, we produced a light curve in the 4–20 keV band using the standard OSA5.1 tools. This light curve was also searched for periodicities using the Lomb-Scargle method; the resulting power spectrum is shown in Figure 15. The peak power of 130.8 corresponds to a frequency of 0.04750 Hz. The error on this measurement is calculated using equations 1 & 2. The corresponding period is 21.0526 0.0005 seconds; the 1st, 2nd and 3rd harmonics of this period are also evident in the power spectrum.
Folding the JEM-X light curve on the 21.0526 seconds yields the pulse-period phase-folded light curve shown in Figure 15. We attribute this periodicity to the spin period of an X-ray pulsar located within the system. There are no significantly detected features in the profile. The pulse fraction, , where and are the maximum and minimum count rates respectively, is (6510) %.
4 Swift observations and results
| Obs date | closest expected outburst | average absorbed flux | average luminosity | ||
|---|---|---|---|---|---|
| (MJD) | (MJD) | (erg cm-2 s-1) | (erg s-1) | (cm-2) | |
| 53782 | 53788.64 | 4.310-12 (1–7 keV) | 1.671034 | 1.70.7 | 6.31022 |
| 53799 | 53807.16 | 2.210-11 (1–7 keV) | 8.551034 | 1.30.25 | 4.80.91022 |
= assuming a distance of 5.7 kpc (see Section 5)
In this section we report on X-ray observations acquired with the XRT (X-ray Telescope) on board the Swift satellite (Gehrels et al. 2004). A search of the XRT data archive revealed that Swift carried out 2 observations of IGR J184830311, on 16 February 2006 and 5 March 2006. The XRT collected data for a total exposure time of 8 ks and 5.6 ks, respectively. Unfortunately in both observations the source was outside the IBIS FOV. XRT data reduction was performed using XRTDAS v. 2.4 standard data pipeline package (xrtpipeline v. 0.10.3), in order to produce screened event files. All data are extracted only in the Photon Counting (PC) mode, adopting the standard grade filtering (0–12 for PC) according to the XRT nomenclature. Events for spectral analysis were extracted within a circular region of radius 20′′, which encloses about 90% of the PSF at 1.5 keV (Moretti et al. 2004), centered on the source position. The background was extracted from various source-free regions close to the X-ray source of interest using both circular/annular regions with different radii, in order to ensure an evenly sampled background.
First of all, the Swift XRT analysis of IGR J184830311 provided a very accurate position (RA=18h 48m 17.17s, Dec=-03∘ 10 15.54, J2000) with the error radius being equal to 3.3. This refined source position was obtained using the method reported in Moretti et al. (2006), which allows positional errors accurate to 3.
For the observation of 16 February 2006 (OBS1), it was possible to extract a meaningful spectrum only in the energy range 1–7 keV. Above 7 keV and below 1 keV the statistics were not good enough to perform a spectral analysis. The spectrum from 1–7 keV is best fitted by an absorbed power law (=1.38, 38 d.o.f) with =1.70.7 and NH=6.31022 cm-2. Thermal models such as black body or bremsstrahlung provide very bad fits with a greater than 2. The spectrum (1–10 keV) extracted during the observation of 5 March 2006 (OBS2) is best fitted by an absorbed power law (=1.009, 67 d.o.f) with =1.30.25 and NH=4.80.91022 cm-2. Thermal models such as black body or bremsstrahlung are again a bad description of the data. Table 4 provides a list of the characteristics of the two Swift XRT observations of IGR J184830311. In order to check for variability in the spectral index between the two Swift observations, both absorbed power law spectra have been fitted fixing the NH to the average value found from the previous spectral analysis (NH=5.551022 cm-2). By doing so, no variability has been found since the photon index assumed an identical value of 1.50.25 (OBS1) and 1.50.13 (OBS2), respectively.
Taking into account the Swift XRT spectra of IGR J184830311, we extrapolated its flux in the ROSAT energy range 0.1–2 keV. A count rate of 0.00046 count/sec was obtained, which is 30 times smaller than that of the ROSAT HRI source (0.0139 count/sec) associated with IGR J184830311 according to Stephen et al. (2006). This, together with the huge absorption of IGR J184830311 as measured with INTEGRAL and Swift XRT, casts some doubt on a possible association between the ROSAT HRI source and IGR J184830311.
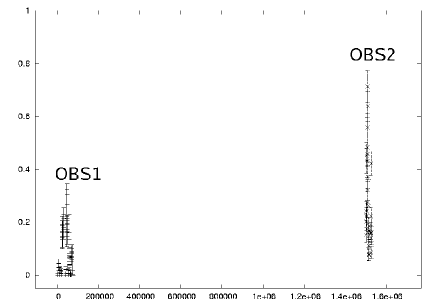
Fig. 16 shows the 0.2–10 keV light curve of the two Swift XRT observations, OBS1 and OBS2 (bin time 200 seconds). The time axis is in seconds, counted from the beginning of OBS1, and the flux axis is in count/sec. We can note a variability since the source during OBS2 is slightly brighter than OBS1. In fact, the average absorbed fluxes during OBS2 and OBS1 are 2.210-11 (1–7 keV) and 4.310-12 (1–7 keV), respectively. It seems that in both periods the source was not in outburst but in a low state. Fine time resolution light curves of both Swift XRT observations were searched for pulsations using the Lomb-Scargle method but no positive results were obtained; it is likely the statistics were not good enough because of the small exposure time of the observations and the low state of the source.
It is worth pointing out that the two Swift observations occured several days before the closest expected outburst of IGR J184830311, based upon the 18.52 days periodicity (see Table 4). Assuming that the Swift source is associated with IGR J184830311, the Swift XRT detections probably represent its quiescence emission.
However, we cannot entirely exclude that the Swift source is not associated with IGR J184830311 because of the lack of a simultaneous Swift–INTEGRAL detection during an outburst.
5 An highly redenned star as optical counterpart of IGR J184830311
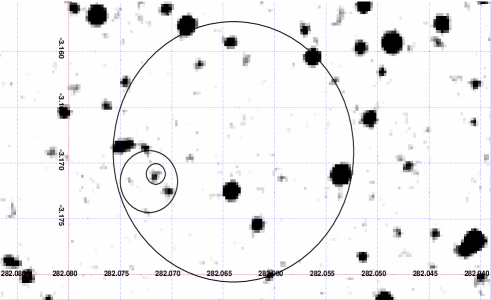
As we can note in Fig. 17, the Swift XRT very accurate position of IGR J184830311 (3.3 error radius) allows us to identify an optical USNO–B1.0 source as the likely optical counterpart. The position of this star (RA=18h 48m 17.2s, Dec=-03∘ 10 16.5, (J2000)) is 1.06 from the Swift XRT location of IGR J184830311. The optical and NIR magnitudes extracted from the USNO-B1.0 and 2MASS catalogues, respectively, are = 19.26, = 15.32, = 10.74, = 9.29 and = 8.46. This indicates an extremely reddened object, and the optical/NIR color indices of this source strongly resemble those of a heavily absorbed early-type star, similar to the case of 2RXP J130159.6635806 = IGR J130206359 (Chernyakova et al. 2005), identified as a HMXB by Masetti et al. (2006). Indeed, assuming the Milky Way extinction law (Cardelli et al. 1989), we find that the optical/NIR color indices are consistent with those of a late O / early B-type star (Wegner 1994) suffering from a reddening of 13 mag. This, using the formula of Predehl & Schmitt (1995), implies a column density of NH 2.31022 cm-2, which is lower than that inferred with the Swift and INTEGRAL spectral analysis results. This may indicate that part of the absorption detected in X–rays is local to the accreting object. Admittedly, if one considers the color index alone, one gets a higher -band optical extinction ( 16 mag). However, it should be noted that, for faint (18) magnitudes, the photometry of USNO catalogues can have uncertainties as high as 1 mag or more (e.g. Masetti et al. 2003). Thus, we consider the estimate obtained using the magnitudes as a more correct one. Assuming then 13 mag along the IGR J184830311 line of sight and a B0 spectral type for the companion star in this system, we can infer its distance, depending on the luminosity class (main sequence, giant or supergiant) of the star. We find that, for these three cases, a distance of 2.1, 3.5 and 5.7 kpc, respectively, is found. The first (main sequence) case would place the system in the Sagittarius arm of the Galaxy (e.g. Leitch & Vasisht 1998): this distance is however too close to justify the inferred optical absorption.
We consider it more likely that the secondary star is an early giant or supergiant: in this case the source would lie either in the near or in the far side of the Scutum-Crux arm, respectively. However, only optical/NIR spectroscopy of this object can help us to shed more light on its nature.
6 Discussions and Conclusions
We report on 5 newly discovered outbursts from IGR J184830311 detected by IBIS. In each case the outburst activity lasts no longer that a few days and it is characterized by several fast flares with timescales of a few hours. The broad band (3–50 keV) JEMX/ISGRI spectrum of outburst No.1 is best fitted by an absorbed cutoff power law with =1.40.3, Ec=22 keV and NH=91022 cm-2. The latter exceeds the galactic absorption along the line of sight (1.61022 cm-2) suggesting that most of the low energy absorption is intrinsic to the source.
Timing analysis performed on the long term ISGRI light curve allows us to identify a periodicity of 18.52 0.01 days which is most likely a measurement of the orbital period of the system. Analysis of the 4–20 keV JEM-X light curve of the brightest complete outburst (No.1 in Table 1) identifies a periodicity of 21.0526 0.0005 seconds which could be due to to the spin period of an X-ray pulsar.
From Swift XRT data analysis, we obtain a very accurate source position which finally allows us to pinpoint a single optical object as the probable counterpart of IGR J184830311. Its optical/NIR magnitudes indicate it as an extremely reddened object. In particular the optical/NIR color indices strongly resemble those of a heavily absorbed early-type star.
The X-ray spectral shape, the periodicities of 18.52 days and 21.0526 seconds, the high intrinsic absorption, the location in the direction of the Scutum spiral arm and the highly reddened optical object as possible counterpart, support the hypothesis that IGR J184830311 is a HMXB with a neutron star as compact companion. Assuming the 18.52 days periodicity as the system orbital period and the 21.0526 seconds periodicity as the neutron star spin period, then the source lies in the Be HMXB transients region of the Corbet diagram (Corbet 1986). Moreover, the characteristics of the outbursts and their regular recurrence at 18.52 days strongly support a Be/X-ray transient HMXB nature. However, we can not entirely exclude the source to be a supergiant fast X-ray transient because of the timing and spectral X-ray properties resembling those of already known SFXTs (Sguera et al. 2005, Sguera et al. 2006, Sguera et al. 2007). The typical duration of the outburst activity of IGR J184830311 is a few days, somewhat longer than typical outbursts from SFXTs which are usually shorter than a day, typically a few hours (Sguera et al. 2005, Sguera et al. 2006). However, outbursts from SFXTs lasting a few days have been already reported (Sidoli et al. 2006). It is worth bearing in mind that SFXTs are characterized by typical luminosity ratios LMax / LMin 104. Assuming that the Swift XRT detection is associated with IGR J184830311 and it represents its quiescence emission, then its luminosity ratio is LMax / LMin 103, an order of magnitude smaller than that typical of SFXTs.
Spectroscopy of the optical/NIR counterpart of IGR J184830311 is thus essential to fully characterize this hard X-ray emitting object.
Acknowledgements.
We thank the anonymous referee for very useful comments which helped us to improve the paper. This research has been supported by University of Southampton School of Physics and Astronomy. The italian co-authors acknowledge support via contract ASI/INAF I/023/05References
- (1) Bird, A. J., Barlow, E. J., Bassani, L., et al., 2006, ApJ, 636, 765
- (2) Cardelli, J.A., Clayton, G.C., & Mathis. J.S. 1989, ApJ, 345, 245
- (3) Chernyakova, M, Lutovinov, A., Capitanio, F., 2003, ATEL 157
- (4) Chernyakova, M., Lutovinov, A., Rodríguez, J. & Revnivtsev, M. 2005, MNRAS, 364, 455
- (5) Corbet R. H. D., 1986, MNRAS, 220, 1047
- (6) Dean, A. J., Bazzano, A., Hill, A. B., et al. 2005, A&A, 443, 485
- (7) Gehrels N., Chincarini G., Giommi P., et al. 2004, ApJ, 611, 1005
- Hill et al. (2005) Hill, A. B., Walter, R., Knigge, C., 2005, A&A, 439, 255
- Hill (2006) Hill, A. B. 2006, Ph.D. Thesis, School of Physics and Astronomy, University of Southampton, UK
- Horne & Baliunas (1986) Horne, J. H., & Baliunas, S. L., 1986, ApJ, 302, 757
- (11) Lebrun, F., Leray, J. P., Lavocat, P., et al. 2003, A&A, 411, 141L
- (12) Leitch, E.M., & Vasisht, G. 1998, New Astron., 3, 51
- (13) Lund, N., Butz-Jorgentsen, C., Westergaard, N.J., et al. 2003, A&A, 411, L231
- (14) Masetti, N., Palazzi, E., Pian, E. et al. 2003, A&A, 404, 465
- (15) Masetti, N., Morelli, L., Palazzi, E., et al. 2006a, A&A, 459, 21
- (16) Masetti, N., Pretorius, M.L., Palazzi, E., et al. 2006b, A&A,449, 1139
- (17) Molkov, S., Lutovinov, A., Grebenev, S., 2003a, A&A, 411, L357
- (18) Molkov, S., Cherepashchuk, A. M., Lutovinov, A., et al., 2003b, astro-ph 0402416
- (19) Monet, D.G., Levine, S.E., Canzian, B., et al. 2003, AJ, 125, 984
- (20) Moretti A., Campana S., Tagliaferri G., et al. 2004,SPIE, 5165, 232
- (21) Moretti, A., Perri, M., Capalbi, M., et al. 2006, A&A, 448, L9
- (22) Negueruela, I., Smith, D. M., Reig, P., et al. 2005, ESA SP-604, 165
- (23) Predehl, P., & Schmitt, J.H.M.M. 1995, A&A, 293, 889
- Press & Rybicki (1989) Press, W. H. & Rybicki, G. B., 1989, ApJ, 338, 277P
- Scargle (1982) Scargle, J. D., 1982, ApJ, 263, 835
- (26) Sguera, V., Bird, A. J., Dean, A. J., et al. 2007, A&A, 462, 695
- (27) Sguera, V., Bazzano, A., Bird, A.J., et al., 2006, ApJ, 646, 452
- (28) Sguera, V., Barlow, E. J., Bird, A. J., et al., 2005, A&A, 444, 221
- (29) Sidoli, L., Paizis, A., Mereghetti, S., 2006, A&A, 450L, 9
- (30) Skrutskie, M. F., Cutri, R. M., Stiening, R., et al. 2006, AJ, 131, 1163
- (31) Stephen, J. B., Bassani, L., Malizia, A., et al. 2006, A&A, 445, 869
- (32) Ubertini P., Lebrun, F., Di Cocco, G., et al. 2003, A&A, 411, L131
- (33) Walter, R., Zurita Heras, J., Bassani, L., et al. 2006, A&A, 453, 133
- (34) Wegner, W. 1994, MNRAS, 270, 229