Constraints on spinning dust towards Galactic targets with the VSA: a tentative detection of excess microwave emission towards 3C396
Abstract
We present results from observations made at 33 GHz with the Very Small Array (VSA) telescope towards potential candidates in the Galactic plane for spinning dust emission. In the cases of the diffuse Hii regions LPH96 and NRAO591 we find no evidence for anomalous emission and, in combination with Effelsberg data at 1.4 and 2.7 GHz, confirm that their spectra are consistent with optically thin free–free emission. In the case of the infra-red bright SNR 3C396 we find emission inconsistent with a purely non-thermal spectrum and discuss the possibility of this excess arising from either a spinning dust component or a shallow spectrum PWN, although we conclude that the second case is unlikely given the strong constraints available from lower frequency radio images.
keywords:
radiation mechanisms: general—radio continuum: ISM—dust, extinction—ISM: individual: 3C3961 Introduction
A localized excess of emission in the microwave region was first detected in the /DMR data and was initially attributed to free–free emission (Kogut et al. 1996a, 1996b). Since then this anomalous emission has been detected by a number of authors (de Oliveira-Costa et al. 2002, 2004; Banday et al. 2003; Finkbeiner et al. 2004; Watson et al. 2005; Fernández-Cerezo et al. 2006), and has been nicknamed ‘ ’. Although initially ascribed to thermal bremsstrahlung in view of its strong correlation with thermal dust, low H surface brightness measurements (Leitch et al. 1997) implied gas temperatures in excess of K, which were rejected on energetic grounds by Draine & Lazarian (1998a). Its physical mechanism has yet to be constrained; the most popular interpretation is that of rapidly rotating dust grains, or (Draine & Lazarian 1998a, 1998b). Other mechanisms which have been proposed include magnetic dust emission (Draine & Lazarian 1999), flat spectrum synchrotron (Bennett et al. 2003b), and bremsstrahlung from very hot electrons (Leitch et al. 1997). Spinning dust causes an excess of emission in the 10 – 50 GHz region of the spectrum, where the combination of synchrotron, bremsstrahlung and thermal dust emission is a minimum, and is problematic especially for CMB experiments which utilise this region to minimise foreground contamination and avoid atmospheric emission. Consequently the presence of a poorly constrained foreground such as this anomalous dust emission is a potentially serious problem for CMB observers and needs to be better understood in order to be correctly removed. This has led to several directed observations (Finkbeiner et al. 2004; Watson et al. 2005; Casassus et al. 2004, 2006; Dickinson et al. 2006) being made towards targets suggested by the theoretical predictions of Draine & Lazarian (1998b; hereinafter DL98b). Whilst these have been mainly directed at Hii regions and dark clouds, DL98b also suggest that it may be possible to detect GHz emission from spinning dust in photodissociation regions. Here we present observations at 33 GHz towards two Hii regions and one supernova remnant (SNR) for which infrared observations imply the presence of significant photodissociation regions (PDRs).
2 The Telescope
The VSA is a 14 element interferometer sited at the Teide Observatory, in Tenerife, at an altitude of 2400 m. The VSA operates in a single 1.5 GHz wide channel at a central frequency of 33 GHz (Scott et al. 2003). The 14 antennas use HEMT amplifiers with typical system temperature 35 K. In its new super-extended configuration the VSA uses mirrors of diameter 65 cm. The horn-reflector antennas are mounted on a tilt table hinged east–west and each antenna individually tracks the observed field by rotating its horn axis perpendicularly to the table hinge, wavefront coherence being maintained with an electronic path compensator system (Watson et al. 2003).
The individual tracking of the VSA antennas allows for the filtering of contaminating signals. These may be celestial sources, such as the Sun and Moon, or ground-spill and other environment based spurious signals. The VSA also uses a ground-shield to minimise ground-spill. The consequences of this design are two-fold. First, the VSA is able to observe continuously and can filter out emission from the Sun and Moon when they are as close as . Second, the VSA is unaffected by ground-spill contamination for fields within 35∘ of the zenith and so is able to make direct images of the sky, rather than employing the lead–trail approach of many other interferometers operating in the microwave band.
3 Observations
Observations were carried out as single pointings with a primary beam of 72 arcmin FWHM. The data were calibrated using Tau A and Cas A in accordance with VSA reduction procedures. This calibration, along with appropriate flagging and filtering of the data, was performed using the special purpose package reduce developed specifically for reduction of VSA observations. Details of the VSA reduction and calibration procedure can be found in Dickinson et al (2004) and references therein.
Many surveys at lower frequency do not have similar resolution to the super-extended VSA, making comparison difficult. Instead we extrapolate from the Effelsberg 100 m telescope at 2.7 GHz (Frst et al. 1990). These data111The Effelsberg survey data were downloaded from the MPIfR sampler survey website: http//www.mpifr-bonn.mpg.de/survey.html are single dish maps with a circular beam of 4.3 arcmin FWHM.
For a robust comparison the 2.7 GHz Effelsberg maps were multiplied by the primary beam of the VSA and visibility sampling was performed in the –plane with a correction for the Effelsberg beam.
4 LPH96
The Hii region LPH96 (RA = 06h 36m 40s, = +10∘ 46 28, J2000) has been observed with the Green Bank 43m telescope between 5 and 10 GHz (Finkbeiner et al., 2002) and was shown to have a rising spectrum consistent with that expected from spinning dust. However, a pointed observation made with the CBI telescope (Dickinson et al., 2006) at 31 GHz shows emission consistent with an approximately flat spectrum source with only little possibility of spinning dust.
At 33 GHz the peak flux density of LPH96 is 1.1000.030 Jy beam-1. The synthesized beam of the VSA towards LPH96 is 9.16.3 arcmin2 and the source is slightly resolved with structure extending towards the north and southwest. The 2.7 GHz data after sampling gives a peak flux density of 1.4360.010 Jy beam-1. Comparing this with the VSA flux density we find a spectral index = 0.1060.026, where the errors are calculated from the thermal noise outside the beam on the 2.7 and 33 GHz maps. The spectral index, , is here defined so that flux density scales as . This calculation fails to take into account systematic errors; taking errors of 5 percent on the flux density scales at each frequency gives = 0.1060.065.
The VSA measurement shows no indication of the excess emission which would be expected at 33 GHz from the warm neutral medium (WNM) spinning dust model of DL98b consistent with the Green Bank data. The result is more consistent with that found by the CBI telescope (Dickinson et al. 2006) who found emission at 31 GHz consistent only with . Dickinson et al. also note that the Galactic plane survey of Langston et al. (2000) failed to detect LPH96 at 14.35 GHz with a detection limit of 2.5 Jy.
5 3C396
The supernova remnant (SNR) 3C396 (G39.20.3), is a shell-like remnant at radio frequencies, with a mean angular diameter of (Patnaik et al. 1990). Its spectral behaviour has been extensively studied in the radio, most notably by Patnaik, and has a non-thermal radio spectrum with between MHz and GHz. Below 30 MHz catalogued flux densities for 3C396 are contaminated by the near by steep-spectrum pulsar, PSR 19000.5 (Manchester & Taylor 1981). A pulsar wind nebula near the centre of this SNR has been detected in X-rays (see Olbert et al. 2003), but the remnant has not been detected optically. Only a lower limit of 7.7 kpc for its distance is available from its Hi absorption observation (Caswell et al. 1975). Patnaik et al. conclude that the neighbouring Hii region NRAO 591 is likely to be at a distance of kpc.
5.1 VSA observation of 3C396
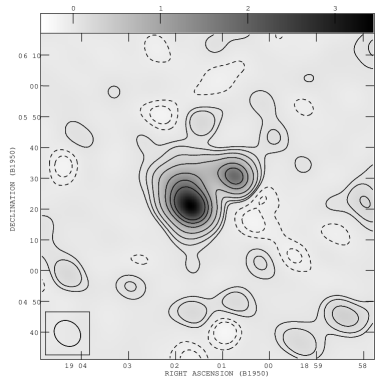
3C396 was observed in August 2006 in a short observation of 1.8 hours. Mapping and clean-based deconvolution were performed using the AIPS package. The observation was not limited by thermal noise but rather by the dynamic range of the telescope and has rms noise of 34.0 mJy. The VSA map is shown in Fig. 1; it shows both 3C396 and also the Hii region NRAO 591 to the north–west of the remnant. The VSA beam towards 3C396 is arcmin2. Interesting features include a protrusion to the north and a faint detection of the “blow-out” tail to the north–east, both of which are also present at longer radio wavelengths.
Fits were obtained using the AIPS task JMFIT by drawing a bounding box around both sources and fitting for two Gaussians and a base level. The peak flux density for 3C396 was found to be 3.210.29 Jy beam-1 and the integrated flux density 6.640.33 Jy at 33 GHz, with the peak at 19h01m43 +05∘22′22 (B1950). For the secondary source NRAO 591 we find a peak flux density of 1.710.09 Jy beam-1 and an integrated flux density of 2.400.12 Jy centered at 19h00m47 +05∘31′06 (B1950). The errors here include contributions from the rms noise on the observation, the statistical error from the Gaussian fits, and a conservative 5% error from the flux calibration which dominates the overall value. A complete discussion of the VSA flux calibration may be found in Dickinson et al. (2004).
5.2 The integrated spectrum of 3C396
Again we use observations from the Effelsberg 100 m telescope to examine the emission at lower radio frequencies. Using Effelsberg data at 1.4 (Reich et al. 1997) and 2.7 GHz we convolve the data at 2.7 GHz to match the 1.4 GHz resolution of 9.4 arcmin and find flux densities of 14.9 1.3 Jy and 11.4 1.3 Jy at 1.4 and 2.7 GHz, respectively. These values agree with those of Reich et al. (1990) and give a spectral index of = 0.46, which is consistent with the mean of 0.45 found for shell-type SNRs (Green, 2004; 2006). After sampling the Effelsberg observation at 2.7 GHz to match the uv–coverage of the super-extended VSA towards 3C396 we find a flux density of 10.900.51 Jy. Our best fit index implies a flux density of 3.4 Jy at 33 GHz extrapolated from the Effelsberg data.
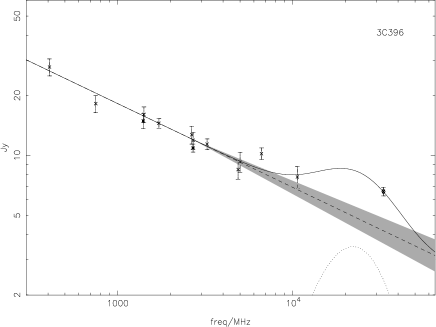
We investigate the spectrum of 3C396 using our own flux density and other published values; all errors are quoted to 1 . Taken at face value the VSA observation of 3C396 would imply an index = 0.200.02, broadly consistent with a region of thermal emission. Alternatively, if we assume the index of 0.46 determined from the Effelsberg data, then the VSA flux density would imply an excess of emission seen at microwave frequencies towards this source. A large number of observations between 400 MHz and 5 GHz exist and to confirm this spectral index we compile a spectrum using flux densities taken from Patnaik et al. (1990) who made corrections to the original measurements to bring them onto the flux density scale of Baars et al. (1977). The integrated spectrum of 3C396 is shown in Fig. 2. Data from Patnaik et al. is shown as crosses, the data from Effelsberg as filled squares and the VSA data as an unfilled diamond. Performing a weighted least squares fit to the Patnaik and Effelsberg data we find an index of . The VSA measurement at 33 GHz is inconsistent with this spectrum, shown in Fig. 2 as a solid line. Including the VSA data at 33 GHz we find a spectral index of , shown as a dashed line. However, values for the two fitted spectra show that the spectral index of 0.42 (, 31 d.o.f., P(1.07) = 0.366) is a better fit to the data. Indeed a spectral index of 0.32 (, 32 d.o.f., P(1.95) = 0.001) would be unusually flat for a supernova remnant with less than 7 % of shell like or possible shell like supernova remnants having a spectral index of less than or equal to 0.32 (Green 2006). However, we hesitate to over-interpret this statistic since the catalogued spectral indices are by no means uniform in quality.

Since previous observations (Finkbeiner et al. 2004) have suggested the presence of spinning dust in Hii regions we have also compiled a spectrum for NRAO 591. We use flux densities compiled by Patnaik et al. (1990) which are plotted in Fig. 3 and find a spectrum compatible with that of optically-thin free–free emission.

5.3 Discussion and Conclusions
For the source 3C396 we constrain the possible excess emission relative to the non-thermal contribution at 33 GHz by subtracting a non-thermal model extrapolated from lower frequency. For the flux densities between 400 MHz and 10 GHz, shown in Fig. 2, a best fit spectral index of was found. This index implies a flux density of 0.11 Jy at 33 GHz, where the error is statistical only. This leaves 0.35 Jy that may be due to an anomalous component. If we include a 5 percent error on the flux calibration these errors are increased to 0.24 and 0.41 Jy, respectively. The excess accounts for 37% of the total 33 GHz flux density.
Radio recombination line observations (Anantharamaiah, 1985) put an upper limit on the emission measure of 3C396 of 280 cm-6 pc and fits an electron temperature of 5000 K for the gas. This implies an upper limit on the free–free emission from the SNR of 0.061 Jy beam-1 at 33 GHz. The beam sizes used for this measurement are poorly matched to that of the VSA and may cause the values to be over-estimated. Taking this into account it can be seen that the free–free contribution is small compared to the non-thermal and can only account for 2% of the excess emission. In addition, models including both free–free and non-thermal contributions provide poor fits to the Patnaik et al. data.
The possibility of the VSA seeing a secondary radio source in projection towards 3C396 is small. Radio sources with flux densities mJy are seen with a frequency of 0.2/deg2. The possibility of a rising spectrum source at 5 GHz reduces this number by a factor of 10 (Waldram et al., 2003; Cleary et al., 2005).
Olbert et al. (2003) report the presence of a small pulsar wind nebula (PWN) within the 3C396 SNR , although the authors note the lack of any corresponding radio feature in high resolution 20 cm VLA images of the remnant (Dyer & Reynolds 1999). For this PWN (or plerion-like component), to account for the excess flux density seen at 33 GHz it would be very obvious at 1.4 GHz, where it would have to contribute approximately 1/6 of the total flux density, assuming a flat spectral index – Olbert et al. however suggest that its contribution is 1/25 of the total radio flux density at 1.4 GHz.
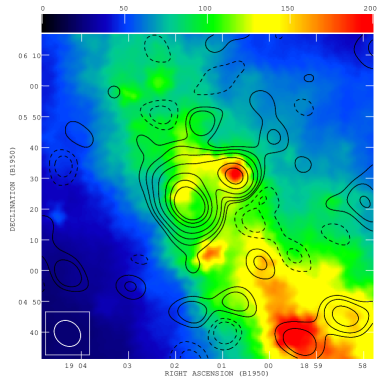
The infra-red emission at 100 m towards 3C396 is shown in Fig. 4. In this region of the Galactic plane it is not certain whether the emission is associated with the SNR remnant, or is merely a projection. Reach et al. (2006) suggest that higher resolution Spitzer data shows emission at 3.6 to 8 m which may be associated with the SNR. They find IRAC colours for these regions consistent with both PDRs and Hii regions.
If the excess emission seen at 33 GHz from 3C396 is associated with these regions then it is possible it may arise from the dipole emission of Draine & Lazarian (1998a;1998b). However, the discrepancy in resolution between the Spitzer and VSA telescopes precludes a more detailed spatial analysis. This possibility is illustrated in Figure 5 where the data is shown with the WNM spinning dust model of DL98b. For clarity we have binned the data of Patnaik et al. at similar frequencies, and have excluded one point at 10.7 GHz. In addition, we note that the WNM model of DL98b, where the column density towards 3C396 is determined from the full-sky magnitude map of Schlegel, Finkbeiner & Davis (1998), predicts a peak flux density at 33 GHz of 3.5 Jy beam-1 at the resolution of the VSA due to spinning dust. This gives an integrated flux density of approximately 7 Jy, using the ratio of peak to integrated flux found with the VSA. However, it is likely that this method overestimates the integrated flux density since the morphology of the thermal dust emission appears more compact than the emission seen with the VSA. It is however within a factor of 3 of the excess emission we see at 33 GHz.
In conclusion, we have assessed the possibility of spinning dust emission at 33 GHz towards the SNR 3C396. Apart from Cas A and Tau A, few SNR have been studied in the microwave region. Consequently, in order to confirm this possibility further measurements are required in the range 10–20 GHz.
ACKNOWLEDGEMENTS
We thank the staff of the Mullard Radio Astronomy Observatory, the Teide Observatory and the Jodrell Bank Observatory for their invaluable assistance in the commissioning and operation of the VSA. The VSA is supported by PPARC and the IAC. AS acknowledges the support of a PPARC studentship.
Part of the research described in this paper was carried out at the Jet Propulsion Laboratory, California Institute of Technology, under a contract with the National Aeronautics and Space Administration.
We would also like to thank the anonymous referee for his careful reading of this paper.
References
- Anantharamaiah (1985) Anantharamaiah K. R., 1985, JApA, 6, 177
- Arendt (1989) Arendt, 1989, ApJS, 70, 181
- Banday et al. (2003) Banday A. J., Dickinson C., Davies R. D., Davis R. J., Górski k. M., 2003, MNRAS, 345, 897
- Baars et al. (1977) Baars J. W. M., Genzel R., Pauliny-Toth I. I. K., Witzel A., 1977, A&A, 61, 99
- Bennett et al (2003a) Bennett C. L., 2003a, ApJS, 148, 1
- Bennett et al (2003b) Bennett C. L., 2003b, ApJS, 148, 97
- Binette et al (1981) Binette L., Carignan C., Bolton J, G., Wright A. E., 1981, Aust.J.Phys., 34, 407
- Casassus, Readhead, Pearson, Nyman, Shepherd Bronfman (2004) Casassus S., Readhead A. C. S., Pearson T. J., Nyman L. -L., Shepherd M. C., Bronfman L., 2004, ApJ, 603, 599
- Casassus et al. (2006) Casassus S., Cabrera G. F., Förster F., Pearson T. J., Readhead A. C. S., Dickinson C., 2006, ApJ, 639, 951
- Caswell et al. (1975) Caswell J. L., Murray J. D., Roger R. S., Cole D. J., Cooke D. J., 1975, A&A, 45, 239
- Cleary et al. (2005) Cleary K. A., et al., 2005, MNRAS, 360, 340
- Davies et al. (2006) Davies R. D., Dickinson C., Banday A. J., Jaffe T. R., Górski K. M., Davis R. J., 2006, MNRAS, 370, 1125
- de Oliviera-Costa et al. (2004) de Oliviera-Costa A., Tegmark M., Davies R. D., Gutiérrez C. M., Lasenby A. N., Rebolo R., Watson R. A., 2004, ApJ, 606, L89
- de Oliviera-Costa et al. (2002) de Oliviera-Costa A., et al., 2002, ApJ, 567, 363
- Dickinson et al. (2004) Dickinson C., et al., 2004, MNRAS, 353, 732
- Dickinson et al. (2006) Dickinson C., Casassus S., Pineda J. L., Pearson T. J., Readhead A. C. S., Davies R. D., 2006, ApJ, 643, L111
- Draine & Lazarian (1998a) Draine B. T., Lazarian A., 1998a, ApJ, 494, L19
- Draine & Lazarian (1998a) Draine B. T., Lazarian A., 1998b, ApJ, 508, 157
- Draine & Lazarian (1999) Draine B. T., Lazarian A., 1999, ApJ, 512, 740
- Dyer & Reynolds (1999) Dyer K. K., Reynolds S. P., 1999, AAS, 31, 973
- Fernández-Cerezo et al. (2006) Fernández-Cerezo S., et al., 2006, MNRAS, 370, 15
- Finkbeiner et al. (2002) Finkbeiner D. P., Schlegel D. J., Frank C., Heiles C., 2002, ApJ, 566, 898
- Finkbeiner (2004) Finkbeiner D. P., 2004, ApJ, 614, 186
- Finkbeiner et al. (2004) Finkbeiner D. P., Langston G. I., Minter A. H., 2004, ApJ, 617, 350
- Frst et al. (1990) Frst E., Reich W., Reich P., Reif K., 1990, A&AS, 85, 691
- Frst et al. (1990) Frst E., Reich W., Reich P., Reif K., 1990, A&AS, 85, 805
- Green (2004) Green D. A., 2004, BASI, 32, 335
- Green (2006) Green D. A., 2006, ‘A Catalogue of Galactic Supernova Remnants (2006 April version)’, Astrophysics Group, Cavendish Laboratory, Cambridge, United Kingdom (available at http://www.mrao.cam.ac.uk/surveys/snrs/).
- Jones et al. (1996) Jones A. P., Tielens A. G. G. M., Hollenbach D. J., 1996, ApJ, 469, 740
- Kogut et al. (1996a) Kogut A., Banday A. J., Bennett C. L., Górski K. M., Hinshaw G., Reach W. T., 1996, ApJ, 460, 1
- Kogut et al. (1996b) Kogut A., Banday A. J., Bennett C. L., Górski K. M., Hinshaw G., Smoot G. F., Wright E. L., 1996, ApJ, 464, L5
- Lagache (2003) Lagache G., 2003, A&A, 405, 813
- Langston et al. (2000) Langston G., Minter A., D’Addario L., Eberhardt K., Koski K., Zuber J., 2000, AJ, 119, 2801
- Leitch et al (1997) Leitch E. M., Readhead A. C. S., Pearson T. J., Myers S. T., 1997, ApJ, 486, L23
- Manchester & Taylor (1981) Manchester R. N., Taylor J. H., 1981, AJ, 86, 1953
- Patnaik et al. (1990) Patnaik A. R., Hunt G. C., Salter C. J., Shaver P. A., Velusamy T., 1990, A&A, 232, 467
- Reach et al (2006) Reach W. T., et al, 2006, AJ, 131, 1479
- Reich et al. (1984) Reich W., Frst E., Haslam C. G. T., Steffen P., Reif K., 1984, A&AS, 58, 197
- Reich et al. (1990) Reich W., Frst E., Reich P., Reif K., 1990, A&AS, 85, 633
- Reich, Reich, & Fuerst (1990) Reich W., Reich P., Frst E., 1990, A&AS, 83, 539
- Reich, Reich, & Furst (1997) Reich P., Reich W., Frst E., 1997, A&AS, 126, 413
- Saken, Fesen, & Shull (1992) Saken J. M., Fesen R. A., Shull J. M., 1992, ApJS, 81, 715
- Schlegel, Finkbeiner, & Davis (1998) Schlegel D. J., Finkbeiner D. P., Davis M., 1998, ApJ, 500, 525
- Scott et al. (2003) Scott P. F., et al., 2003, MNRAS, 341, 1076
- Waldram et al. (2003) Waldram E. M., Pooley G. G., Grainge K. J. B., Jones M. E., Saunders R. D. E., Scott P. F., Taylor A. C., 2003, MNRAS, 342, 915
- Watson et al. (2003) Watson R. A., et al., 2003, MNRAS, 341, 1057
- Watson et al. (2005) Watson R. A., et al., 2005, ApJ, 624, L89