Polarimetry of Compact Symmetric Objects
Abstract
We present multi-frequency VLBA observations of two polarized Compact Symmetric Objects (CSOs), J00004054 and J18261831, and a polarized CSO candidate, J19156548. Using the wavelength-squared dependence of Faraday rotation, we obtained rotation measures (RMs) of 18010 rad m-2 and 15407 rad m-2 for the latter two sources. These are lower than what is expected of CSOs (several 1000 rad m-2) and, depending on the path length of the Faraday screens, require magnetic fields from 0.03 to 6 G. These CSOs may be more heavily affected by Doppler boosting than their unpolarized counterparts, suggesting that a jet-axis orientation more inclined towards the line of sight is necessary to detect any polarization. This allows for low RMs if the polarized components are oriented away from the depolarizing circumnuclear torus. These observations also add a fourth epoch to the proper motion studies of J00004054 and J18261831, constraining their kinematic age estimates to 610 yrs and 2600490 yrs, respectively. The morphology, spectrum, and component motions of J19156548 are discussed in light of its new classification as a CSO candidate, and its angle to the line of sight (50∘) is determined from relativistic beaming arguments.
1 Introduction
Compact symmetric objects (CSOs) are a class of active galactic nuclei (AGN) that have significant visible jet or hotspot activity on either side of the central engine (Conway et al., 1994; Wilkinson et al., 1994). These are typically 1 kpc in size because they are young objects (3000 yr; Polatidis & Conway, 2003; Gugliucci et al., 2005). In terms of the unified scheme of AGN (Antonucci, 1993), there is little Doppler boosting of the jets and hotspots due to the orientation of the source with respect to the line of sight. This orientation also allows for studies of the hypothesized dust and gas torus that surrounds the central engine and lies perpendicular to the jet axis. The actual angle that the line of sight makes with the torus determines what features can be seen. Evidence for this torus comes from detections of broad HI absorption lines (Taylor et al., 1999; Peck et al., 2000; Pihlström, Conway, & Vermeulen, 2003; Gupta et al., 2006) and free-free absorption (Peck, Taylor, & Conway, 1999) towards CSOs. H2O megamasers also provide clues to circumnuclear tori in nearby AGN (Lo, 2005, and references therein).
This torus, and magnetic fields in the shocked, photoionized ISM around the lobes, may also give rise to the large Faraday screens that depolarize emission from most CSOs (Bicknell, Dopita, & O’Dea, 1997). The first detection of significant polarization in two CSOs in the COINS sample (CSOs Observed In the Northern Sky; Peck & Taylor, 2000), J00004054 (2.1%) and J18261831 (8.8%), occured on the side with the more prominent jet or hotspot (Gugliucci et al., 2005, hereafter GTPG). The opposite hotspot showed no polarization down to a 0.3 mJy limit. Any polarization that is detected should have high rotation measures (several 1000s rad m-2; Bicknell, Dopita, & O’Dea, 1997, and references therein). In this paper, we attempt to calculate the Faraday rotation measures in these polarized components.
Kinematic ages can be obtained by measuring the separation speed between hotspots over time, or the proper motion of a hotspot or jet component with respect to the core (e.g. Polatidis & Conway, 2003; Nagai et al., 2006). In GTPG, we confirmed ages for three CSOs between 13047 and 30001490 yr, with another source appearing to have an age of 204 yr. The overall CSO age distribution seems to be disproportionately stacked towards the younger ages. Possible explanations are: there is a selection effect against older CSOs, the jet activity tends to die off after a certain period of time, or CSOs have periods of deactivation and reactivation (Tingay, Edwards, & Tzioumis, 2003). Those that survive may evolve into Fanaroff-Riley II galaxies such as Cygnus A (Fanaroff & Riley, 1974; Readhead et al., 1996b; Polatidis & Conway, 2003). In this paper, we refine the kinematic age estimates of J00004054 and J18261831 that were first calculated in GTPG. Also included are observations of a new CSO candidate from the Second Caltech-Jodrell Bank Survey, J19156548, which also shows hotspot separation over three epochs and polarization in its more prominent hotspot.
Throughout this discussion, we assume H0=71 km s-1 Mpc-1, = 0.27, and = 0.73. Linear sizes and velocities for sources with known redshifts have been calculated using E.L. Wright’s cosmology calculator 111http://www.astro.ucla.edu/wright/CosmoCalc.html.
2 Observations and Analysis
Observations were centered on 4.8 GHz and 8.4 GHz on 12 February 2005 for J00004054 and on 18 February 2005 for J18261831 using the VLBA222The National Radio Astronomy Observatory is operated by Associated Universities, Inc., under cooperative agreement with the National Science Foundation.. Observations of J19156548 were centered on 4.8 GHz, 8.4 GHz, 15.1 GHz, and 22.2 GHz with the VLBA on 11 November 2004. Each frequency was separated into four IFs, and these IFs were paired such that the higher two frequencies were averaged during imaging as were the lower two frequencies, except at 22.2 GHz where all four IFs were averaged. Therefore, the frequencies used for the RMs in these observations were 4.6 GHz, 5.0 GHz, 8.2 GHz, 8.5 GHz, 14.9 GHz, 15.3 GHz, and 22.2 GHz. Observational parameters are presented in Table 1.
Amplitude calibration of the data was derived from system temperatures and antenna gains. Fringe-fitting was performed with the AIPS task FRING on the calibrators OQ 208 and 3C 84. D-term solutions were determined with the AIPS task LPCAL and the same calibrators OQ 208 and 3C 84. Absolute electric vector position angle (EVPA) calibration was determined for J00004054 using the EVPAs of J1310322 and for J18261831 and J19156548 using the EVPAs of BL Lac listed in the VLA Monitoring Program333http://www.vla.nrao.edu/astro/calib/polar/ (Taylor & Myers, 2000). Note that the EVPAs were corrected for each of the four IFs separately.
3 Results
Faraday rotation was first noted by Michael Faraday when he passed polarized light through a refractive medium in the presence of a magnetic field (Faraday, 1933). The intrinsic polarization angle, , is observed as such that
| (1) |
where is the observed wavelength. The rotation measure, RM, is related to the electron density, , the net line of sight magnetic field in the environment, , and the path length, , through the plasma, by the equation
| (2) |
where units are in cm-3, mG, and parsecs. A reasonable for radio galaxies is 103 cm-3 as estimated by Zavala & Taylor (2003). Our lower limit for the path length is 0.3 pc, the approximate size of clumps within the Faraday screen in M87 (Zavala & Taylor, 2002). Since the Faraday screen for an AGN is now considered to come from interactions of the jet with ambient material (Zavala & Taylor, 2004), a good upper limit for the path length is the jet radius, or 10 pc. Field strengths calculated with these parameters can be compared to the strength of a magnetic field in pressure balance with a thermal gas of the same and a temperature of 104 K using
| (3) |
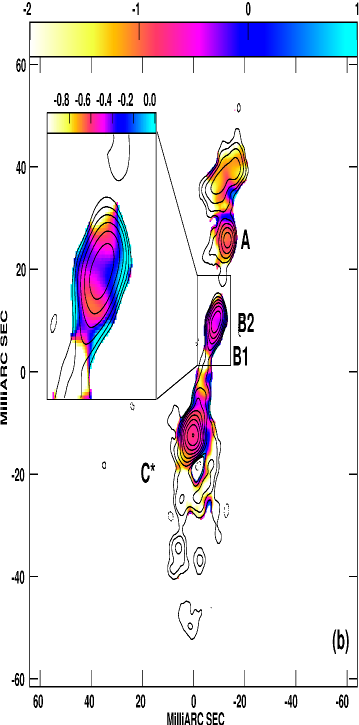
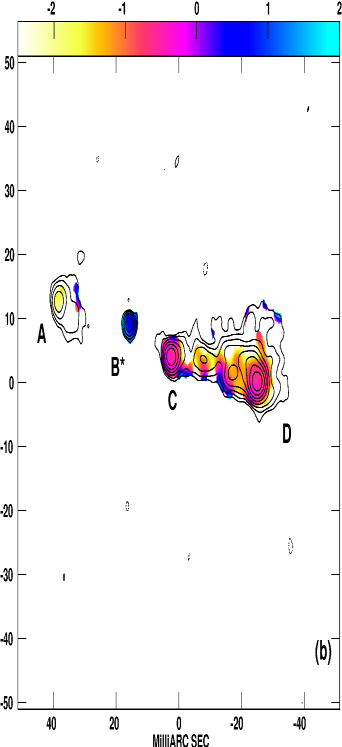
The 8.4 GHz images of J00004054 and J18261831 at full resolution are shown in Figures 1 and 2 with sticks representing polarization vectors. The 8.4 GHz images were then tapered to match the resolution of the 4.8 GHz images. The same circular beam was then applied to both images and spectral index maps were created. These are overlayed with the 4.8 GHz images in Figures 1 and 2. A plot for the rotation measure of the polarized component of J18261831 is shown in Figure 3. Source parameters for these CSOs and J19156548 are in Table 1.
In GTPG, we attempted to obtain relative proper motions for CSOs in the COINS sample in order to calculate a kinematic age for each source. This assumes that the separation speed of the hotspots is uniform. This method is independent of the angle that the source makes with respect to the line of sight and of the distance to the source. This method also produces results if the hotspot or outer jet component can be seen moving away from the core. Using 8.4 GHz data from three epochs spread across a five year period, we calculated the kinematic ages of three CSOs with reasonable certainty, while the rest provided lower limits. These new observations provided us with a fourth epoch for J00004054 and J18261831 at 8.4 GHz, extending the time baseline to seven years. This provides better estimates and limits of the ages of these two CSOs.
Models for J00004054 and J18261831 were fit to the visibility data for the March 2000 epoch, since this was close to the middle of the time baseline and had a high dynamic range. These models were comprised of elliptical Gaussians. Visibility data from each epoch were fit to a model with the same size and shape ellipses so that only the positions and fluxes of these were allowed to vary with time. Uncertainties in position for each component were calculated from the signal-to-noise ratios and the synthesized beam. The positions of these components with respect to a reference component were fit with a weighted least squares line where the slope of the line provides the relative speed. Motions are considered significant if they are at least 3 above the errors and if the reduced chi-squared is nearly 1. Errors are dependent on the image noise and the individual flux of each component. If large errors are present, then the motions are considered upper limits, so that they give rise to ages that are lower limits. Table 3 includes the modelfit parameters, and Figure 4 gives plots of the proper motion of two components in J18261831.
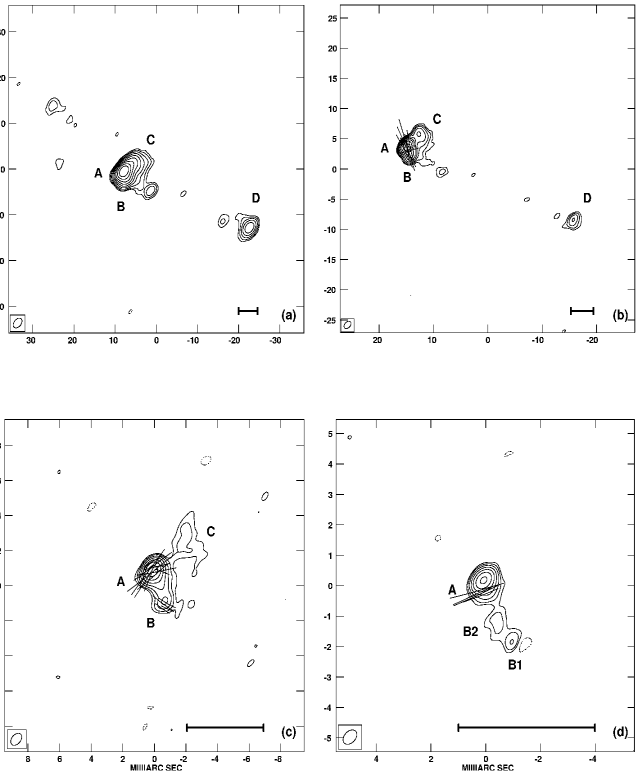
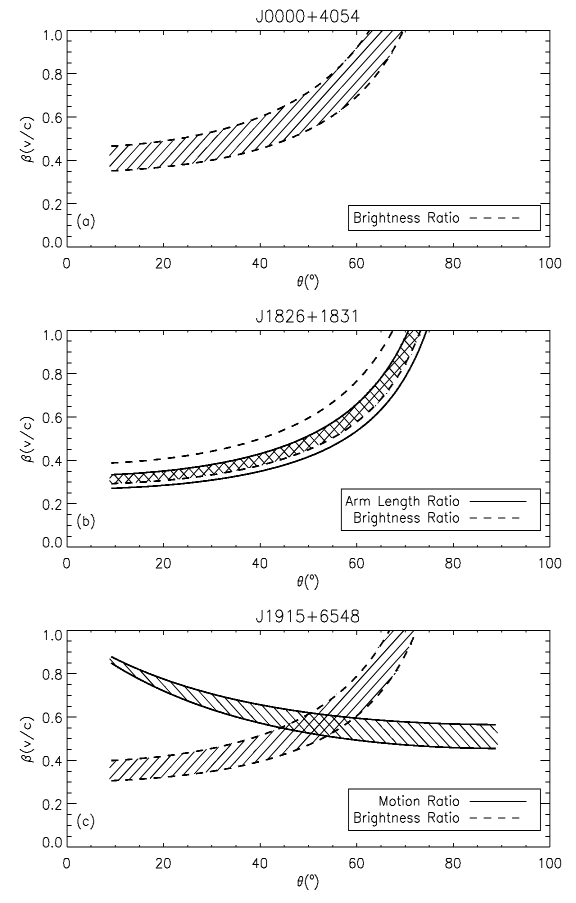
Total intensity images of J19156548, the new CSO candidate, are presented in Figure 5 with sticks representing polarization vectors overlayed. The integrated total power spectrum, as well as that of component A alone, is shown in Figure 6. Since the brightest hotspot was polarized at 8.4 GHz, 15.1 GHz, and 22.2 GHz, a rotation measure plot is given in Figure 7. Figure 8 presents the proper motions of hotspot separation in this source at 4.8 GHz over an 11 year timespan. Table 4 gives hotspot brightnesses for the polarized sources and the unpolarized sources of the COINS sample for comparison in 4. Plots of vs. for the separation speeds and orientations of J18261831 and J19156548 are presented in Figure 9.
3.1 J00004054
This CSO was identified as such in Dallacasa et al. (2002) and GTPG, and polarization was detected at 8.4 GHz. It is associated with a galaxy of magnitude 21.4 (Stickel & Kuehr, 1996). The core has still not been positively identified from the spectral index map (see Fig. 1). From their compact morphologies, either B1 or B2 could be the core, but their spectral indices are rather steep (0.6; ). However, there appears to be a flattening (0.4) between components B1 and B2, so the core may be located there (see inset Fig. 1.b). In Dallacasa et al. (2002), the combined flux of B1 and B2 (component Ce in that paper) is 71 mJy at 1.6 GHz. When compared with the fluxes of B1 and B2 here at 8.4 GHz, this yields a spectral index for that region of 0.25. High dynamic range imaging at 15 GHz should provide a positive identification.
Polarization was detected in the southern hotspot at 8.4 GHz with an intensity of 2.1 mJy (see Fig. 1). This is 1.2% of the intensity of the hotspot. There is no detectable polarization at 4.8 GHz down to the 3 level ( 0.2 mJy, or 0.06%). The 4.8 GHz image also shows a strange morphology in the southern lobe. There appears to be a hole, or depression, in the emission below the bright hotspot. If this is not an artifact in the data, it resembles the region in the eastern lobe of 4C 31.04 by Giroletti et al. (2003), where it is speculated that such a hole could be created by a dense molecular gas that is impenetrable to radio emission or to the plasma itself. However, the morphology may also be the effect of edge-brightening at component C if the plasma is running into denser material. This material may also be deflecting the jet to the east, as seen in the 8.4 GHz image. Polarization was only detected at 8.4 GHz, so the RM could not be determined and the true orientation of the magnetic field is not known. If the RM was known to be as low as in J1826+1831 (180 rad m-2, see 3.2), for example, then there would be little rotation from the original polarization angle to 8.4 GHz, so the magnetic field would lie roughly perpendicular to the electric vectors in Figure 1a. Then, the detectable polarization in this region would be due to a compression of the ambient magnetic field at a shock front where the jet is colliding with the denser gas. Future observations at 15 GHz should allow us to determine the rotation measure for this region.
The fourth epoch of 8.4 GHz data in the proper motion study of this object did not provide a good fit for the separation speed of the hotspots. However, there is an upper limit of 0.066 mas yr-1 of component A away from component C. This speed limit and a hotspot distance of 40.33 mas provides a lower limit for the kinematic age of 610 yrs. This is higher than was previously estimated (280 yrs in GTPG). Although the redshift is not known, a reasonable estimate of 0.5 can be made for the typical redshift of a CSO host (Augusto et al., 2006). If this is the case, the projected distance between components A and C is 242 pc and A is moving with speed 2.0.
3.2 J18261831
This is the most significantly polarized of these three objects. Component C, most likely a jet component, has a polarized intensity of 2.3 mJy at 8.4 GHz, or 8.5% of its flux (see Fig. 2). This component has a polarized intensity of 1.4 mJy at 4.8 GHz, making it 3.7% polarized. A least-squares fit for the rotation measure of 18010 rad m-2 at the peak of component C is presented in Figure 3. This is not an uncommon rotation measure for a typical quasar jet (Zavala & Taylor, 2004). The pair of angles at 8.2 and 8.5 GHz suggest a higher rotation measure, but this requires for a number of 180 degree turns to be put in between 4.6 and 5.0 GHz and between 5.0 GHz and 8.2 GHz. These turns can be introduced because the polarization vectors give an orientation, but not a direction, of the electric field such that and 180 are indistinguishable. Depending on the number of turns used in this data, rotation measures as high as 6000 rad m-2 are plausible. One must take caution with this, however, since any number of turns can be introduced to provide a false good fit. Therefore, 18010 rad m-2 is a conservative estimate. Measurement of polarization at another frequency may help in determining the correct rotation measure. It may also be true, however, that we only see polarized emission from this component because it is free of the high rotation measures that may be present closer to the core.
If a path length of 0.3 pc is assumed with n 103 cm-3, the magnetic field strength is 0.7 G, using Eqn. 2. With the upper limit of the path length, 10 pc, the field strength is only 0.03 G. Both of these are much smaller than the strength of a magnetic field that is in pressure balance with a 104 K gas of the same electron density, 200 G, using Eqn. 3.
A spectral index map was made between 4.8 and 8.4 GHz which is presented in Figure 2. This shows the core, B, to be a flat spectrum component ( 0.6), while the rest of the jet and counterjet are steep spectrum ( 0.6 to 1.7).
The proper motions of components C and D with respect to B were measured using the four epochs of 8.4 GHz data available to us. D was found to be moving at 0.0150.003 mas yr-1. With a projected separation between B and D of 41.87 mas, this corresponds to a kinematic age for the CSO of 2600490 yr. This refines our earlier estimate of 30001490 yr. The jet component C is moving along at a faster rate of 0.0320.003 mas yr-1 (see Fig. 4). The modelfitting of components works best for bright, compact components, of which component A is neither, so no proper motions can be fit. If we assume again that 0.5, D is moving away from B at 0.45 and is 255 pc away. C is moving away from B at 0.95. However, this source has no detected optical counterpart, so its redshift could be much higher.
3.3 J19156548
This new CSO candidate was first listed in a survey with the 300-ft Green Bank Telescope at 4.8 GHz by Becker, White, & Edwards (1991) It was observed in the Second Caltech-Jodrell Bank Survey (CJ2) which presented a spectrum of total intensity in Henstock et al. (1995). Its host is a Seyfert 1 galaxy with a magnitude of 18.2 and redshift of 0.486 (Henstock et al., 1997). New observations were taken with the VLBA to investigate the non-linear morphology in the CJ2 image.
We identify Component A as a steep spectrum hotspot (0.9; See Fig. 6) that dominates the flux of this object at all four frequencies. Components B and C are steep spectrum ( 1.2 and 0.9, respectively), and we propose that they are also part of the eastern lobe. Component D is very steep spectrum ( 1.6), and, based on morphology, we propose it to be the counter-hotspot to A. There is no evidence of a compact, flat or inverted spectrum core, but there are a growing number of CSOs that have two steep spectrum hotspots but no visible core (e.g. J0620+2102, J1111+1955; GTPG). There is also a trail of extended emission between A and D at 4.8 and 8.4 GHz that hints at a jet-like structure, as well as emission further east of A in the 4.8 GHz image which we interpret as a sign of earlier activity (see Fig. 5). Although the morphology is similar to that of a CSO, the hotspot intensity ratio at 4.8 GHz is 12:1 and is 26:1 at 8.4 GHz. These fall short of the 10:1 criteria set for CSOs in the COINS sample (Peck & Taylor, 2000).
To determine the synchrotron age of the source, we present the total intensity spectrum of J19156548 in Figure 6 using total intensities from this paper and data points from the NASA/IPAC Extragalactic Database (NED)444NED is operated by the Jet Propulsion Laboratory, Caltech, under contract with NASA.. Using the break frequency, 17 GHz, the minimum energy magnetic field of the plasma can be calculated as in Miley (1980) using
| (4) |
where B is in gauss, is in GHz, F0 is in Jy, and are the dimensions of an elliptical component in arcseconds, and is the path length in kpc. With this, the synchrotron age of the source can be calculated as in Murgia et al. (1999) with
| (5) |
with B in G, in GHz, and 3.25(1)2. At 4.8 GHz, the eastern hotspot is 0.291 Jy and can be approximated by an ellipse 0.01 mas by 0.006 mas. We assume the path length to be equivalent to 0.01 mas, or 0.07 kpc at a redshift of 0.486. This yields a magnetic field of 7 mG and a synchrotron age of 540 yrs.
Component A is polarized at 8.4 GHz (3.0 mJy or 1.6%), 15.1 GHz (2.3 mJy or 2.8%), and 22.2 GHz (1.8 mJy or 4.0%). The polarized flux is too low to be reliable at 4.8 GHz (1.3 mJy or 0.5%). A plot of the rotation measure is given in Figure 7. The rotation measure of 15407 rad m-2 comes from a direct measurement of the EVPAs at the center of the polarized component without any introduced 180 degree wraps. This is more consistent with the high RMs expected from a CSO. With a path length of 0.3 pc and the same electron density as above, this corresponds to a magnetic field strength of 6 G. At the upper limit for path length of 10 pc, the magnetic field strength is 0.2 G. These are still much lower than what is expected in the central regions of a radio galaxy (200 G, see 3.2).
The visibility data at 4.8 GHz was modelfit at this epoch and at two other epochs, 1993.444 and 1995.691, the first of which was presented in Henstock et al. (1995). Proper motions were fit with a least squares line with a slope of 0.0350.004 mas yr-1. With a redshift of 0.486, this apparent speed corresponds to 1.020.11 . Although this is higher than typical hotspot separation speeds (GTPG), it yields a good fit (see Fig. 8) and a kinematic age of 940110 yr.
4 Discussion
4.1 CSO Orientations
Depolarization in CSOs is consistent with the Bicknell, Dopita, & O’Dea (1997) model. Variations in rotation measure across the lobe can cause this depolarization, and this may be due to magnetic field reversals in the post-shock ISM. The obscuring torus may also play a role in depolarization, and this would be dependent on torus scale height, opening angle, and orientation. We rule out depolarization by a thin disk of material, with a scale height much less than the radio source size, since we frequently see that both sides are depolarized, whereas a thin disk would only cover one side. If a Faraday screen is to produce the observed polarization asymmetry in these sources, then it requires a scale height of about half the total source size. More detections of polarization in CSOs are needed to constrain its geometry.
The existence of polarized emission in these three sources sets them apart from the rest of the COINS sample. However, this is not the only difference. In GTPG, we noted that J00004054 and J18261831 appeared to have greater hotspot intensity ratios than their unpolarized counterparts. Since the polarization is detected on the side of the more prominent hotspot, this can be attributed to a shorter path length through the circumnuclear torus and, consequently, a lower Faraday depth. Table 4 lists the brightnesses of each hotspot and the ratio of the dimmer one to the brighter one for unpolarized and polarized CSOs. There is a bimodal distribution in that the polarized sources presented in this paper have ratios 0.1 and the unpolarized COINS have ratios 0.3. Although the sample size for polarized CSOs is small, this is consistent with the observed polarization being due to an orientation effect. As the angle between the jet axis and line of sight decreases, the forward hotspot may be more Doppler boosted and the receding hotspot Doppler dimmed, assuming mildly relativistic bulk motions. So, the leading hotspots in the three polarized sources are oriented such that they are relatively free from Faraday depolarization by the torus that surrounds the central region. However, to explain the depolarization over many viewing angles in the other CSOs, a large torus is needed to extend over hundreds of parsecs of jets and lobe. HI absorption has been seen at this distance from the central engine (e.g. 1946+708 Peck, Taylor, & Conway, 1999).
In order to quantify depolarization in CSOs, we look at Faraday beam depolarization. We can calculate the necessary rotation measure gradient across the synthesized beam in order to get a rotation of one radian. For the unpolarized CSOs in the COINS sample, with an average beamwidth of 1.5 mas at 8.4 GHz, the RM gradient need only be 500 rad m-2 mas-1. So, the RM of J19156548 may be reasonable for a CSO, whereas the low rotation measure of J18261831 is still puzzling. An RM of 500 rad m-2 corresponds to a magnetic field strength of 2 G with a path length of 0.3 pc and 0.06 G with 10 pc. These are still much lower than the strength of a magnetic field in pressure balance with a 104 K gas.
We use the assumption that relativistic beaming is in effect to quantify the orientations of these sources. We can match up what appear to be jet components from the approaching and receding sides of the core and compare their fluxes ( and ) as
| (6) |
where is the space velocity, is the angle to the line of sight, is the spectral index, and is either 2 or 3. Models for continuous jets are best fit by 2 and jets of discrete components by 3. One can use
| (7) |
where is the apparent motion and is the distance from the core. However, this requires a well known position for the center of activity. One can also use the hotspot separation, , such that
| (8) |
where is the angular size distance to the source, is the redshift, and is the angular separation speed in units of (Taylor & Vermeulen, 1997). These can provide constraints on and .
We know neither the core location nor the redshift for J00004054. So, only Eqn. 6 can be applied, using the fluxes of the hotspots as determined by the model in Table 3. A locus of and is plotted in Figure 9a. Note that a lower limit is plotted when 2 and an upper limit when 3. The errors in the measured fluxes are negligible compared to this spread. This shows that, approximately, 0.3 for all values of .
For J18261831, we used the brightnesses of each hotspot, components A and D, with Eqn. 6 as well as their distances from the core with Eqn. 7 to calculate loci of and (Figure 9b). Note that these two equations have a similar functional form, so no tight constraints can be determined. This gives an upper limit for the angle to the line of sight of 75∘. The true space velocity will be 0.3 for any angle. This is higher than typical values found for other CSOs (0.1 Owsianik & Conway, 1998) and other radio galaxies (0.1 Scheuer, 1995). If the value for of component D (0.015 mas yr-1)is used in Eqn. 8 with a typical CSO redshift ( 0.5), the projected separation velocity is 0.4. This is consistent with our results. J18261831 cannot be very close (for example, 0.01), for then the separation velocity would be unusually low and inconsistent with Figure 9b.
We used the apparent hotspot separation speed of 1.020.11 for J19156548, 0.486, and Eqn. 8 to plot the locus for and in Figure 9c along with the loci for the two brightness models with Eqn. 6. These two sets of curves intersect when 0.55 and 50∘. Such a high space velocity is uncharacteristic of lobes. However, it is possible that the hotspot being measured is a transient feature, and therefore moving more quickly, whereas the lobe as a whole is moving at a much slower speed. This can occur if the jet that is feeding the hotspot has changed its orientation slightly and is drilling out a new part of the lobe (Scheuer, 1995). Alternatively, we may be measuring the separation of jet components rather than hotspots as there may be no visible hotspots. This example shows how the orientation angle of a CSO can be measured if mild relativistic beaming is a factor.
4.2 CSO Environments
An alternate theory for the small sizes of CSOs is that they are old sources frustrated by a dense medium (Carvalho, 1994). This dense medium may in fact be asymmetric, possibly as a result of a galaxy merger or interaction (Carvalho, 1998). In an extreme case, the ages of these sources would be comparable to the ages of larger, classic radio doubles. Readhead et al. (1996a) pointed out that if this were the case, CSOs would have more spherical morphologies. Also, hotspot separation speeds in Polatidis & Conway (2003) and GTPG show that the hotspots are still moving too quickly to be confined by a dense medium and be older than a few thousand years. However, this does not rule out high densities or asymmetries in the medium around CSOs as evidence by Orienti, Dallacasa, & Stanghellini (2006). Bicknell, Dopita, & O’Dea (1997) propose that CSOs are frustrated but not confined by the interstellar medium (ISM). Their model assumes a dentist-drill explanation for jet-lobe interactions and predicts low polarization. This is because the ionized gas surrounding the lobes in this model produces large variations in Faraday rotation measures across the source, thus depolarizing the emission. Interstellar magnetic fields can play an integral role if there are a large number of magnetic field reversals across the source which would produce a varied RM structure in our maps. Since the polarization is spatially isolated in these CSOs, no such maps can be made.
Asymmetries in the CSO environment may cause one hotspot to be considerably more polarized in these few sources by interactions with a dense ISM. If the EVPAs for J1915+6548 are extrapolated back to zero wavelength, the observed angle of the electric field is 88∘. So, the orientation of the magnetic field in the image would be nearly north-south, which is approximately perpendicular to the source orientation. This may be an indication of a collision between the bright hotspot and a dense medium that orders the magnetic field along the axis of compression. This is also observed in J18261831 where the EVPA at zero wavelength is 75∘, so the magnetic field is oriented at 25∘. This is also nearly perpendicular to the source orientation, but this effect is for the bright jet component, not the hotspot. Components may also be brighter (by Doppler boosting) if they are moving more quickly through a less dense ISM. However, the indistinguishable motions of the polarized component in J00004054 seems to refute that.
This asymmetry in environments does not, however, explain the bimodal distribution in Table 4, that is, the fact that the ratios of the dimmer hotspots to the brighter hotspots of each source are much lower for polarized CSOs than for unpolarized CSOs. This is more naturally explained by Doppler boosting. Also, the relativistic hotspot speeds of J1915+6548 (see Fig. 9) could not exist in a dense environment. Finally, we do not see rotation measures in the several thousands as predicted by the Bicknell, Dopita, & O’Dea (1997) model.
5 Conclusions
In this study we have investigated the polarization properties of two CSOs, J00004054 and J18261831, and a CSO candidate J19156548. The Faraday rotation measures that were observed for J18261831 and J19156548 are lower than what was previously expected for CSOs, 18010 rad m-2 and 15407 rad m-2, compared to predicted values of several thousand rad m-2. These imply low external magnetic field strengths, 0.03 to 6 G, depending on what estimates for electron density and path length are used. However, only about 500 rad m-2 mas-1 is needed for beam depolarization to be a major factor for most unpolarized CSOs.
Since these polarized sources have significantly more asymmetric hotspot brightnesses than their unpolarized counterparts, with ratios of 0.1 as opposed to 0.3, it is plausible that Doppler boosting is in effect for the brighter hotspots. Then, their jet axis orientations are closer to the line of sight than for other CSOs such that the polarized hotspot is free of obscuration from the circumnuclear torus. We put contraints on and for all three sources (Figure 9) such that for J00004054 and J18261831, 0.3. More information, specifically the redshift, must be known in order to make tighter constraints. For J19156548, 0.5 and 50∘.
We extended the time baseline for proper motions of the two objects from the COINS sample from five to seven years. This provided a better age estimate for J18261831 of 2600490 yrs and a better lower limit for the age of J00004054 at 610 yrs. Extending the time baseline for the proper motions of a larger sample of CSOs will reduce some of the uncertainties and lower limits of their ages so that the distribution of ages in the sample can be better determined.
J19156548 was determined to be a CSO candidate because of the presence of symmetric, steep spectrum hotspots and the lack of a compact, flat or inverted spectrum core. If confirmed, this will be the third CSO with significant polarization. Although spectral age arguments and proper motions from an eleven year time baseline suggest an age between approximately 600 and 1000 yrs, the hotspot separation speed is most certainly relativistic and Doppler boosting is occuring in the brighter hotspot. Our age estimates may be underestimating the true source age if the brightest hotspot is undergoing renewed activity from a slowly moving jet or if it is encountering a particularly dense medium, reaccelerating the electrons and giving a lower synchrotron age. If it were the case that the hotspots are transient features and therefore appear younger and faster moving than the radio lobe, then the kinematic ages of many CSOs would be underestimated. However, with such small sources, it is possible that a true classical radio lobe has not yet been created and the hotspots are the only indicator of the current phase of activity in CSOs.
References
- Antonucci (1993) Antonucci, R. 1993, ARA&A, 31, 473
- Augusto et al. (2006) Augusto, Pedro, Gonzalez-Serrano, J. Ignacio, Perez-Fournon, Ismael, Wilkinson, Peter N. 2006, MNRAS, 368, 1411
- Beasley et al. (2002) Beasley, A. J., Gordon, D., Peck, A. B., Petrov, L., MacMillan, D. S., Fomalont, E. B., & Ma, C. 2002, ApJS, 141, 13
- Becker, White, & Edwards (1991) Becker, R. H., White, R. L., & Edwards, A. L. 1991, ApJS, 75, 1
- Bicknell, Dopita, & O’Dea (1997) Bicknell, G. V., Dopita, M. A., & O’Dea, C. P. O. 1997, ApJ, 485, 112
- Carvalho (1994) Carvalho, J. C. 1994, A&A, 292, 392
- Carvalho (1998) Carvalho, J. C. 1998, A&A, 329, 845
- Conway et al. (1994) Conway, J. E., Myers, S. T., Pearson, T. J., Readhead, A. C. S., Unwin, S. C., & Xu, W. 1994, ApJ, 425, 568
- Dallacasa et al. (2002) Dallacasa, D., Tinti, S., Fanti, C., Fanti, R., Gregorini, L., Stanghellini, C., & Vigotti, M. 2002, A&A, 389, 115
- Fanaroff & Riley (1974) Fanaroff, B. L. & Riley, J. M. 1974, MNRAS, 167, 31P
- Faraday (1933) Faraday, M. 1933 in Faraday’s Diary, ed. T. Martin (London: G. Bell & Sons), 264
- Giroletti et al. (2003) Giroletti, M., Giovannini, G., Taylor, G. B., Conway, J. E., Lara, L., & Venturi, T. 2003, A&A, 399, 889
- Gugliucci et al. (2005) Gugliucci, N. E., Taylor, G. B., Peck A. B., & Giroletti M. 2005, ApJ, 622, 136
- Gupta et al. (2006) Gupta, Neeraj, Salter, C. J., Saikia, D. J., Ghosh, T., & Jeyakumar, S. 2006, MNRAS, 373, 972
- Henstock et al. (1995) Henstock, D. R., Browne, I. W. A., Wilkinson, P. N., Taylor, G. B., Vermeulen, R. C., Pearson, T. J., & Readhead, A. C. S. 1995, ApJS, 100, 1
- Henstock et al. (1997) Henstock, D. R., Browne, I. W. A., Wilkinson, P. N., McMahon, R. G. 1997, MNRAS, 290, 380
- Lo (2005) Lo, K.Y. 2005, ARA&A, 43, 625
- Miley (1980) Miley, G. 1980, ARA&A, 18, 165
- Murgia et al. (1999) Murgia, M., Fanti, C., Fanti, R., Gregorini, L., Klein, U., Mack, K.-H., & Vigotti, M. 1999, A&A, 345, 769
- Nagai et al. (2006) Nagai, Hiroshi, Inoue, Makoto, Asada, Keiichi, Kameno, Seiji, & Doi, Akihiro 2006, ApJ, 648, 148
- Orienti, Dallacasa, & Stanghellini (2006) Orienti, M., Dallacasa, D., & Stanghellini, C. 2006, A&A, in press
- Owsianik & Conway (1998) Owsianik, I. & Conway, J. E. 1998, A&A, 337, 690
- Peck, Taylor, & Conway (1999) Peck, A. B., Taylor, G. B., & Conway, J. E. 1999, ApJ, 521, 103
- Peck & Taylor (2000) Peck, A. B. & Taylor, G. B. 2000, ApJ, 534, 90
- Peck et al. (2000) Peck, A. B., Taylor, G. B., Fassnacht, C. D., Readhead, A. C. S., Vermeulen, R. C . 2000, ApJ, 534, 104
- Pihlström, Conway, & Vermeulen (2003) Pihlström, Y. M., Conway, J. E., & Vermeulen, R. C. 2003, A&A, 404, 871
- Polatidis & Conway (2003) Polatidis, A. G. & Conway, J. E. 2003, Publications of the Astronomical Society of Australia, 20, 69
- Readhead et al. (1996a) Readhead, A. C. S., Taylor, G. B., Xu, W., Pearson, T. J., Wilkinson, P. N., & Polatidis, A. G. 1996a, ApJ, 460, 612
- Readhead et al. (1996b) Readhead, A. C. S., Taylor, G. B., Pearson, T. J., & Wilkinson, P. N. 1996b, ApJ, 460, 634
- Scheuer (1995) Scheuer, P. A. G. 1995, MNRAS, 277, 331
- Stickel & Kuehr (1996) Stickel, M. & Kuehr, H. 1996, A&AS, 115, 11S
- Taylor et al. (1999) Taylor, G. B., O’Dea, C. P., Peck, A. B. & Koekemoer, A. M. 1999, ApJ, 512, L27
- Taylor & Myers (2000) Taylor, G. B. & Myers, S. T. 2000 VLBA Scientific Memo 26, National Radio Astronomy Observatory
- Taylor & Vermeulen (1997) Taylor, G. B. & Vermeulen, R. C. 1997, ApJ, 485, 9
- Tingay, Edwards, & Tzioumis (2003) Tingay, S. J., Edwards, P. G., & Tzioumis, A. K. 2003, MNRAS, 346, 327
- Wilkinson et al. (1994) Wilkinson, P. N., Polatidis, A. G., Readhead, A. C. S., Xu, W., & Pearson, T. J. 1994, ApJ, 432, L87
- Zavala & Taylor (2002) Zavala, R. T. & Taylor, G. B. 2002, ApJL, 566, 9
- Zavala & Taylor (2003) Zavala, R. T. & Taylor, G. B. 2003, ApJ, 589, 126
- Zavala & Taylor (2004) Zavala, R. T. & Taylor, G. B. 2004, ApJ, 612, 749


| Source | Date | Freq. | Time | Bandwidth | rms |
|---|---|---|---|---|---|
| (GHz) | (min) | (MHz) | (mJy) | ||
| (1) | (2) | (3) | (4) | (5) | (6) |
| J00004054 | 20050212 | 4.6 | 200 | 16 | 0.18 |
| 20050212 | 5.0 | 200 | 16 | 0.12 | |
| 20050212 | 8.2 | 200 | 16 | 0.12 | |
| 20050212 | 8.5 | 200 | 16 | 0.09 | |
| J18261831 | 20050218 | 4.6 | 212 | 16 | 0.17 |
| 20050218 | 5.0 | 212 | 16 | 0.18 | |
| 20050218 | 8.2 | 212 | 16 | 0.20 | |
| 20050218 | 8.5 | 212 | 16 | 0.19 | |
| J19156548 | 20041111 | 4.6 | 58 | 16 | 0.23 |
| 20041111 | 5.0 | 58 | 16 | 0.18 | |
| 20041111 | 8.2 | 39 | 16 | 0.17 | |
| 20041111 | 8.5 | 39 | 16 | 0.15 | |
| 20041111 | 14.9 | 97 | 16 | 0.26 | |
| 20041111 | 15.3 | 97 | 16 | 0.21 | |
| 20041111 | 22.2 | 135 | 32 | 0.18 |
| Name | RA | Dec | ID | ||||||
|---|---|---|---|---|---|---|---|---|---|
| (1) | (2) | (3) | (4) | (5) | (6) | (7) | (8) | (9) | (10) |
| J00004054 | 00 00 53.081551 | 40 54 01.79335 | G | 21.4 | … | 521 | 322 | … | … |
| J18261831 | 18 26 17.710882 | 18 31 52.88973 | … | … | … | 427 | 279 | … | … |
| J19156548 | 19 15 23.819114 | 65 48 46.38505 | G | 18.2 | 0.486 | 331 | 202 | 104 | 54 |
| Kinetic Age | |||||||||
|---|---|---|---|---|---|---|---|---|---|
| Source | Component | (mas) | (mas) | (deg.) | (mJy) | (mJy) | (mas yr-1) | () | (yr) |
| (1) | (2) | (3) | (4) | (5) | (6) | (7) | (8) | (9) | (10) |
| J00004054 | A | 2.28 | 1.71 | 3.4 | 14 | 0.2 | 0.066 | … | 610 |
| B1 | 0.91 | 0.42 | 83.6 | 19 | 0.2 | … | … | … | |
| B2 | 0.63 | 0.63 | … | 28 | 0.2 | … | … | … | |
| C | 3.01 | 2.41 | 65.4 | 205 | 2.1 | Reference | … | … | |
| J18261831 | A | 8.05 | 4.51 | 24.6 | 12 | 0.5 | … | … | … |
| B | 0.45 | 0.45 | … | 11a | 0.5 | Reference | … | … | |
| C | 0.96 | 0.77 | 43.3 | 32 | 2.3 | 0.0320.003 | … | 45043b | |
| D | 1.74 | 1.11 | 71.3 | 115 | 0.5 | 0.0150.003 | … | 2600490 | |
| J19156548 | A | 0.46 | 0.32 | 25.2 | 183 | 0.3 | Reference | … | … |
| B | 1.88 | 0.86 | 29.8 | 72 | 0.3 | … | … | … | |
| C | 1.65 | 1.37 | 24.9 | 36 | 0.3 | … | … | … | |
| D | 1.30 | 0.88 | 17.6 | 15 | 0.3 | 0.0350.004 | 1.020.11 | 940110 |
| Ratio | Core | ||||
|---|---|---|---|---|---|
| Source | (mJy) | (mJy) | () | Fraction | |
| (1) | (2) | (3) | (4) | (5) | (6) |
| Polarized Sources | J00004054 | 205 | 14 | 0.07 | 0.0006 |
| J18261831 | 115 | 12 | 0.10 | 0.04 | |
| J19156548 | 153 | 6 | 0.04 | 0.001 | |
| Unpolarized Sources | J00034807 | 38 | 13 | 0.34 | 0.04 |
| J02040903 | 120 | 68 | 0.57 | 0.20 | |
| J04274133 | 65 | 28 | 0.43 | 0.86 | |
| J06202102 | 156 | 88 | 0.56 | 0.001 | |
| J07545324 | 39 | 36 | 0.92 | 0.003 | |
| J11111955 | 98 | 76 | 0.78 | 0.002 | |
| J11431834 | 130 | 99 | 0.76 | 0.001 | |
| J14144554 | 64 | 51 | 0.80 | 0.003 | |
| J15460026 | 213 | 110 | 0.52 | 0.40 | |
| J17340926 | 183 | 119 | 0.65 | 0.0006 | |
| J18163457 | 135 | 59 | 0.44 | 0.001 | |
| J22031007 | 145 | 53 | 0.37 | 0.001 |