Stellar Populations in Field Early–Type Galaxies
Abstract
We have acquired intermediate resolution spectra in the 3700-7000 Åwavelength range for a sample of 65 early-type galaxies predominantly located in low density environments, a large fraction of which show emission lines. The spectral coverage and the high quality of the spectra allowed us to derive Lick line-strength indices and to study their behavior at different galacto-centric distances. Ages, metallicities and element abundance ratios have been derived for the galaxy sample by comparison of the line-strength index data set with our new developed Simple Stellar Population (SSP) models. We have analyzed the behavior of the derived stellar population parameters with the central galaxy velocity dispersion and the local galaxy density in order to understand the role played by mass and environment on the evolution of early-type galaxies. We find that the chemical path is mainly driven by the halo mass, more massive galaxies exhibiting the more efficient chemical enrichment and shorter star formation timescales. Galaxies in denser environments are on average older than galaxies in less dense environments. The last ones show a large age spread which is likely to be due to rejuvenation episodes.
STSCI, 3700 San Martin Drive, Baltimore, MD 21218, USA
INAF - Osservatorio Astronomico di Padova, Vicolo dell’Osservatorio 5, 35122 Padova, Italy
Institut für Astronomie der Universität Wien, Türkenschanzstrae 17, A-1180 Wien, Austria
SISSA, Via Beirut 4, 34014 Trieste, Italy
1. Introduction
More than half of all stars in the Local Universe are found in massive spheroidal components (e.g. Fukugita et al. (1998)). To understand the history of assembling of the bulk of stellar mass in the Universe is thus fundamental to derive how and when the present day massive early–type galaxies built up. However, the formation and evolution of early–type galaxies is still a matter of debate. According to the standard Cold Dark Matter scenario ( CDM) for structure formation, galaxies built up their present day mass through a continuous assembly driven by the hierarchical merging of dark matter halos (e.g.White & Rees (1978)). In this scenario, massive early-type galaxies appear rather late in the history of the Universe as the culmination of a hierarchical merging process. On the other hand, in the traditional monolithic collapse scenario (e.g. Eggen, Lynden-Bell & Sandage (1962); Tinsley (1972)) the spheroidal component forms by the gravitational collapse of a gas cloud at relatively high redshifts. As a result of the rapidity of this collapse, the bulk of stars in ellipticals should be relatively old. The study of absorption line indices in local early–type galaxies has proven to be one of the most powerful diagnostics to constrain star formation history and to trace star evolution over time. Besides ”direct” age estimates, indirect evidences of the duration of the star formation process can be analyzed through the study of the chemical enrichment pattern, and more specifically of the /Fe enhancement.
Here we present a study of the stellar populations in a sample 65 nearby early-type galaxies, predominantly located in low density environments. We look in particular for correlations of the stellar population parameters with galaxy mass and environment, in order to understand the role played by them on the evolution of massive early-type systems. This work has been presented in three separate papers (Rampazzo et al. (2005), Paper I; Annibali et al. (2006a, b), Papers II and III) to which we refer for details.
2. The Sample
The total sample of 65 galaxies includes both gas and dust–free galaxies taken from the samples of González (1993) and Trager et al. (1998), and objects taken from a compilation of galaxies showing ISM traces in at least one of the following bands: IRAS 100 m, X-ray, radio, HI and CO (Roberts et al. (1991)). All galaxies belong to the Revised Shapley Ames Catalog of Bright Galaxies (RSA) (Sandage & Tammann (1987)), and have a redshift of less than 5500 km s-1. The sample should then be biased towards objects that are expected to have ongoing and recent star formation, at least in small amounts, because of the presence of emission lines. On the other hand, studies of randomly selected samples of early-type galaxies suggest that the incidence of ionized-gas emission in early-type galaxies is quite high ( 75%, Sarzi et al. (2006)). Thus, our sample should not be too dissimilar from randomly selected samples of early-type galaxies. Figure 1 summarizes the basic characteristics of the sample. The right panel provides evidence that a large fraction of galaxies is in low density environments. Galaxies were observed during three separate runs (March 1998, September 1998 and May 1999) at the 1.5m ESO telescope (La Silla). Our long–slit spectra cover the 3700 - 7250 Å wavelength range with a spectral resolution of 7.6 Å at 5550 Å. For each galaxy we have extracted 7 luminosity weighted apertures (with radii: 1.5′′, 2.5′′, 10′′, re/10, re/8, re/4 and re/2) and 4 gradients (0 r re/16, re/16 r re/8, re/8 r re/4 and re/4 r re/2).
3. Lick Indices
For each aperture and gradient we measured 25 line–strength indices: 21 belonging to the original set defined by the Lick-IDS “standard” system (Trager et al. (1998)) and 4 subsequently introduced by Worthey & Ottaviani (1997) to include the higher-order Balmer lines. Line–strength indices have been corrected for several effects (contamination by possible emission, velocity dispersion) and conformed to the Lick IDS system. Figure 2 shows selected Lick indices measured in the central aperture () for our sample as a function of central velocity dispersion. It is clear that metallic indices show a well–established positive trend with (with a significantly shallower variation for the Fe indices). On the contrary, Balmer indices decrease with velocity dispersion. The observed behavior suggests that metallicities or ages increase with galaxy mass, but for the quantitative results we refer to the comparison with SSP models performed in Section 5.
4. Simple stellar population models
To derive ages and chemical compositions from observed narrow band indices of galaxies, appropriate models are needed. Thus we have derived new Simple Stellar Population (SSP) models for a wide range of ages ( Gyr), metallicitites (Z) and [/Fe] ratios (0–0.8). The SSPs are based on the Padova stellar evolution tracks and isochrones (see Bressan et al. (1994)). The standard–composition narrow–band indices are computed on the basis of the fitting functions of Worthey et al. (1994) and Worthey & Ottaviani (1997) . The new –enhanced SSPs have been computed starting from the standard SSPs, and accounting for the effect of element abundance variations on the stellar atmospheres. In particular, the index correction due to non–solar abundance partitions has been derived following the main guidelines provided by previous works in literature (Thomas, Maraston & Bender (2003), Tantalo & Chiosi (2004)), although we have revised the index dependence on element abundance. We refer to Paper III for details. The models are available to the public at http://www.inaoep.mx/abressan or www.stsci.edu/annibali/.
5. Ages, metallicities and [/Fe] ratios
To derive stellar population parameters from the observed line–strength indices of our sample, we have implemented the new -enhanced SSPs within an algorithm based on the probability density function. The derived average ages for the whole sample, E and S0 are 8, 8.7, and 6.3 Gyr, respectively. The average metallicities ([Z/H]) for the whole sample, E and S0, are 0.21, 0.22, and 0.19, respectively. The average [/Fe] ratios for the whole sample, E and S0, are 0.21, 0.23, and 0.17, respectively.

5.1. Scaling Relations
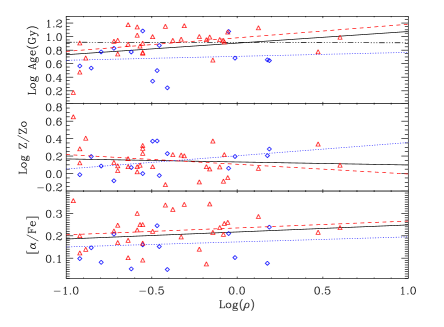
We looked for possible correlation of the stellar population parameters with both central velocity dispersion and local galaxy density. In the left panel of Figure 3 we plot ages, metallicities, and [/Fe] ratios, derived within a aperture, as function of . We do not find the clear signature of a global trend of age with velocity dispersion; on the other hand, significant positive trends are derived for metallicity and /Fe enhancement. In the right panel of Fig. 3, we plot the same stellar population parameters as a function of the richness parameter , measured as galaxies Mpc-3. It is interesting to note that the fit suggests a positive trend of age with local galaxy density. In particular, in spite of containing more than 40% of the sample with determined , the region above log() -0.4 does not contain galaxies younger than 4 Gyr. If we consider only galaxies with ages older than 4 Gyr, the resulting fit is flat, indicating that the age–environment relation is actually due to the presence of very young objects in the poorer environments. This suggests that the relations with velocity dispersion may be ”disturbed” by the presence of such objects populating very low density environments. If we exclude the galaxies in very low density environments, we find that the relations with velocity dispersion have a smaller scatter.
5.2. Gradients
The good quality of our data allowed us also to analyze the stellar population gradients within the single galaxies. The distributions of age, metallicity, and -enhancement gradients are showed in Fig. 4 . While there is not clear presence of age and [/Fe] gradients, we definitely derive negative metallicity gradients (metallicity decreases from the central regions outwards) of the order of .
6. Conclusions
We have analyzed the stellar populations of a sample of 65 early–type galaxies, mainly located in the field, and biased toward the presence of emission lines. Summarizing our results:
-
•
We derive a large age spread, from a few Gyr to 15 Gyr. The average SSP-equivalent ages for the whole sample, E and S0 are 8, 8.7, and 6.3 Gyr, respectively; the metallicity distribution shows a broad peak at ; finally, the [/Fe] ratio definitely presents a peak at 0.22.
-
•
We do not find a clear global trend of age with velocity dispersion; on the other hand, significant positive trends are derived for metallicity and /Fe enhancement. These results testify that the chemical enrichment is more efficient in more massive galaxies, and that the overall duration of the star formation process is shorter within deeper potential wells. These two relations do not depend on galaxy morphological type, indicating that the galaxy gravitational potential is the main driver of the chemical enrichment process of the galaxy.
-
•
Very young objects (from 1 Gyr to 4 Gyr) are found in very low density environments (). None of the galaxies in high density regions is younger than 4-5 Gyr. The lack of environmental effect on the (-enhancement)– relation indicates that in very low environments rejuvenation episodes, rather than more prolonged star formation, are frequent.
-
•
By comparing the number of “young” objects with the total number of galaxies, and by means of simple two-SSP component models, we estimate that in these rejuvenation episodes (like major mergers), not more than 25% of the galaxy mass could be formed, that is, about 75% of the galaxy mass is formed during the initial epoch of formation.
-
•
We derive negative metallicity gradients within single galaxies, while on average the -enhancement remains quite flat within re/2. This indicates that the star formation proceeded on typical lifetimes not significantly different across re/2, but evidently with a larger efficiency in the center.
References
- Annibali et al. (2006a) Annibali, F., Bressan, A., Rampazzo, R.,Zeilinger, W.W. 2006, AA, 445, 79: PaperII
- Annibali et al. (2006b) Annibali, F., Bressan, A., Rampazzo, R., Zeilinger, W.W., L. Danese, 2006, AA, in press, astro-ph/0609175: PaperIII
- Bressan et al. (1994) Bressan, A., Chiosi, C., Fagotto, F. 1994, ApJS 94, 63
- Eggen, Lynden-Bell & Sandage (1962) Eggen, O. J., Lynden-Bell, D., & Sandage, A. R. 1962, Apj, 136, 748
- González (1993) González , J.J. 1993, Ph.D. thesis , Univ. California, Santa Cruz
- Fukugita et al. (1998) Fukugita, M., Hogan, C. J., & Peebles, P. J. E. 1998, Apj, 503, 518
- Rampazzo et al. (2005) Rampazzo R., Annibali F., Bressan A., Longhetti M., Padoan F., Zeilinger W.W. 2005, AA 433, 497: PaperI
- Roberts et al. (1991) Roberts, M., Hogg, D., Bregman, J., Forman, W., Jones, C. 1991, ApJS 75, 751
- Sandage & Tammann (1987) Sandage, A.R., Tammann, G. 1987, A Revised Shapley Ames Catalogue of Bright Galaxies, Carnegie, Washington (RSA)
- Sarzi et al. (2006) Sarzi, M., Falcón-Barroso, J., Davies, R.L., Bacon, R. et al. 2006, MNRAS, 366, 1151
- Tantalo & Chiosi (2004) Tantalo, R., & Chiosi, C. 2004, MNRAS, 353, 917
- Thomas, Maraston & Bender (2003) Thomas, D., Maraston, C., Bender, R. 2003, MNRAS 339,897
- Tinsley (1972) Tinsley, B. M. 1972, ApJ, 178, 319
- Trager et al. (1998) Trager, S.C., Worthey, G., Faber, S.M., Burstein, D., Gozalez J.J. 1998, ApJS 116, 1
- White & Rees (1978) White, S. D. M., & Rees, M. J. 1978, MNRAS, 183, 341
- Worthey et al. (1994) Worthey, G., Faber, S.M., Gonzalez, J.J., Burstein, D. 1994, ApJS 94, 687
- Worthey & Ottaviani (1997) Worthey, G., Ottaviani, D.L. 1997, ApJS 111, 377