Discovery of a remarkable subpulse drift pattern in PSR B081841
Abstract
We report the discovery of a remarkable subpulse drift pattern in the relatively less studied wide profile pulsar, B081841, using high sensitivity GMRT observations. We find simultaneous occurrence of three drift regions with two different drift rates: an inner region with steeper apparent drift rate flanked on each side by a region of slower apparent drift rate. Furthermore, these closely spaced drift bands always maintain a constant phase relationship. Though these drift regions have significantly different values for the measured , the measured value is the same and equal to . We interpret the unique drift pattern of this pulsar as being created by the intersection of our line of sight (LOS) with two conal rings on the polar cap of a fairly aligned rotator (inclination angle °), with an “inner” LOS geometry (impact angle °). We argue that both the rings have the same values for the carousel rotation periodicity and the number of sparks . We find that is 19-21 and show that it is very likely that, is the same as the measured , making it a truly unique pulsar. We present results from simulations of the radiation pattern using the inferred parameters, that support our interpretations and reproduce the average profile as well as the observed features in the drift pattern quite well.
keywords:
Stars: neutron – stars: pulsars: general – stars: pulsar: individual: B0818411 Introduction
The study of pulsars showing systematic subpulse drift patterns provides important clues for the understanding of the unsolved problem of pulsar emission mechanism. Constraints provided by such observations can have far reaching implications for the theoretical models, as exemplified by some of the recent results in this area (e.g. [Deshpande & Rankin (1999)] and [Gupta et al. (2004)]). In this context, pulsars with wide profiles interpreted as, emission coming from one magnetic pole of a highly aligned pulsar (pulsar with the magnetic axis almost parallel to the rotation axis) can provide extra insights because of the presence of multiple drift bands, as illustrated in the recent studies of B082634 ([Gupta et al. (2004)] and [Esamdin et al. (2005)]) and B081509 ([Qiao et al. (2004)]).
B081841 is a relatively less studied wide profile pulsar with emission occurring for more than 180°of pulse longitude. Discovered during the second Molonglo pulsar survey ([Manchester et al. (1978)]), it has a period of 0.545 and is relatively old, with a characteristic age of years. The inferred dipolar magnetic field of this pulsar is G, which is a typical value for slow pulsars. From a study of its average polarization behaviour at 660 and 1440 MHz, [Qiao et al. (1995)] predict that the pulsar must have a small inclination angle between the magnetic and rotation axes.
We have carried out high sensitivity GMRT observations of B081841, which bring out a unique pattern of subpulse drift, which is hitherto not reported. The main results from our initial observations and the interpretations thereof are reported in this paper.
2 Observations and data analysis
We observed B081841 at 325 MHz, on 24th February, 2003 at the GMRT, using the phased array mode ([Gupta et al. (2000)]). The raw data were recorded with 0.512 msec sampling interval. During the offline analysis we further integrated the raw data to achieve the final time resolution of 2.048 msec. The duration of the observations was about 31 minutes (i.e. 3414 pulses).

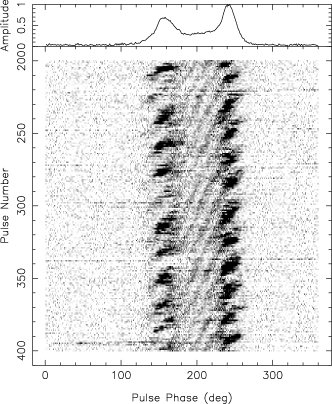
The raw data were first dedispersed (with a DM value equal to 113.4 ) and then bad data points were filtered out from the dedispersed data. The final average pulse profile, illustrated in Fig. 1, was obtained by synchronous folding of this data with the Doppler corrected pulsar period. It shows a fairly steep sided and double peaked structure. The two components of the double peaked profile are separated by 86.6°0.3°and are joined by a saddle region.
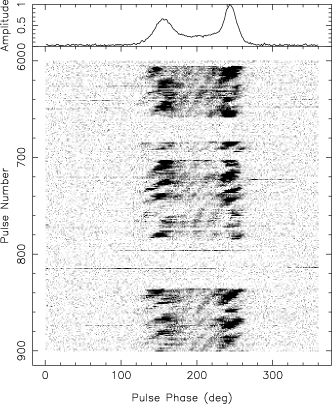
Single pulse sequences from our data reveal an interesting pattern of drifting. Fig. 2 shows a typical drift pattern over a sequence of 200 pulses. We see three different drift regions with two different drift rates an inner region with steeper apparent drift rate flanked on each side by a region of slower apparent drift rate. Multiple drift bands (typically 3 to 4) can be seen in the inner region for any single pulse, whereas the outer regions show only a single drift band. Though the regular drift patterns seen in Fig. 2 are quite common in our entire 3414 pulse sequence, there are regions of disturbed drifting, as well as significant sections of nulls. An illustrative 300 pulse sequence of this kind is shown in Fig. 3. Changes in drift rate, including curved drift bands (e.g. pulse # 720 to pulse # 780) are seen clearly. In this context this pulsar behaves similar to B082634. In Fig. 3 some instances of the pulsar in null state are also seen pulse sequences, 647 to 687, 693 to 705 and 780 to 835.
We note that the inner and the outer drift regions are quite closely spaced with almost no discontinuity between the drift bands of the two region. Furthermore, the two drift regions are clearly locked to each other in phase the subpulse emission from the inner drift region is in phase with that from the outer drift region on the right side, and at the same time the emission in inner drift region is out of phase with the outer drift region situated on the left side. This phase locked relationship (hereafter PLR) is maintained for the entire stretch of the data and does not appear to get perturbed after intermittent nulling or during changes in the drift rate.
We can characterise the observed drift pattern by estimating (the measured time interval between the recurrence of successive drift bands at a given pulse longitude) and (the measured longitude separation between two adjacent drift bands). In practice, the and values need not correspond to the true values ( and ) see [Gupta et al. (2004)].


To determine , we use the fluctuation spectrum analysis technique ([Backer (1970)]). Fig. 4 shows the phase resolved fluctuation spectrum for the 200 pulse sequence of Fig. 2. There is one strong peak at (where is the period of the pulsar). This feature is identified as and the error bar in is proportional to the reciprocal of the total length of the pulse sequence. Fig. 5 shows the fluctuation spectrum for the inner drift region for the same pulse sequence. The is found to be the same for both the inner and the outer drift regions, which is expected given the PLR.
The value for the inner drift region is calculated from the auto correlation function of the single pulses, averaged over the total number of pulses. The result is shown in Fig. 6, where the secondary peak is due to the correlation between the adjacent drift bands and the corresponding value is 17.5°1.3°. Because of the fact that one is not seeing simultaneous multiple subpulses from the outer drift region, for this region can not be estimated using the correlation analysis method. Rough estimation of value for the outer region obtained from the slope of the drift bands in this region is around 28°. Thus although the values are the same, the values are significantly different for the two drift regions.
3 Interpretation & Modelling
We interpret our observations and analysis results within the frame work of [Ruderman & Sutherland (1975)] model and improved versions of the same (e.g. [Gil, Melikidze & Geppert (2003)] and the references therein). According to these, subpulse drifting is produced from a system of sub-beams (subpulse associated plasma columns). Sparks (sparking discharges within the vacuum gap), rotating around the magnetic axis under the action of an E x B drift, gives rise to a circulating pattern of sub-beams, and the time for one full circulation is referred to as the carousel rotation period, which we designate as . As pulsar radiation beams are widely believed to be arranged in concentric cones, it it natural to expect the circulating sparks to be distributed in annular rings on the polar cap (e.g. [Gil & Sendyk (2000)]), each ring giving rise to one cone in the nested cones of emission. To confirm and support our interpretations, we have carried out simulations of the expected radiation pattern for this pulsar. These are described at the end of this section, but their results are alluded to at the different stages of our interpretation, which are as follows.
(1) The possibility that the observed drift pattern could be produced from sparks circulating in one ring can be ruled out on the basis of the large difference in values and the pattern of intensity distribution between the drift regions. A simple interpretation of the observed drift pattern is that the inner saddle region corresponds to an inner conal ring that is somewhat tangentially grazed by the observer’s line of sight (LOS), while the outer drift regions are produced by the intersection of the LOS with an outer conal ring. The simulation results show that the inner drift region can be produced by the intersection of the LOS with three/four neighbouring sparks of the inner ring, whereas the outer drift region can be created by the intersection of the LOS with one spark of the outer ring, on each side of the inner ring.
(2) The closely spaced inner and outer drift regions can be explained with a rapid transition of the LOS from one ring to the other. For the inner LOS geometry (negative ), the LOS traverses the region between the inner and the outer region almost perpendicularly and as a consequence one can achieve quite closely spaced drift regions with reasonably well separated rings of emission. This is borne out by the simulation results (see Fig. 7).
(3) The observed PLR implies that the apparent angular drift rate is the same for both the inner and the outer rings. This can be achieved with two possibilities: different parts of polar cap plasma rotating at the same rate (i.e. the rotation is quasi-rigid), or different parts of the polar cap plasma circulating with different speeds which are fine tuned to maintain the apparent PLR. We do not see a natural way to achieve the later and hence, we suggest that the carousel rotation period, , and the number of sparks, , are the same for both the inner and the outer ring. The simulations with two rings of emission with same and , with 180°out of phase emission between the rings, successfully reproduces the PLR.
(4) What are the likely values for , (and hence ), for this pulsar? To start with, we note that for a LOS grazing the inner ring, the is expected to be close to . So, . Now, for , there are two possibilities : (i) The represents an unaliased true drift rate i.e., in successive pulses, the observer sees the same spark, shifted to a nearby longitude. In this case, and . (ii) The is an aliased version of i.e., in successive pulses, a given spark drifts by an amount very close to the separation between adjacent sparks (or a multiple thereof, depending on the order of the aliasing). As shown by [Gupta et al. (2004)], under the effect of aliasing, and are related as,
| (1) |
where and depend on the alias order, . Note that we observe a negative drift rate for this pulsar. For an inner LOS geometry, this can happen for the case of an unaliased drift (as in case (i) above) the ExB drift of the spark plasma is slower than the rotation of the star ([Ruderman (1976)]). For an aliased drift, this can happen when (i.e . Taking the case for the lowest possible alias order (), and using , we obtain and . This leads to the interesting result that the carousel rotation rate is the same as the measured . For this scenario, the entire spark pattern rotates with an angular velocity of .
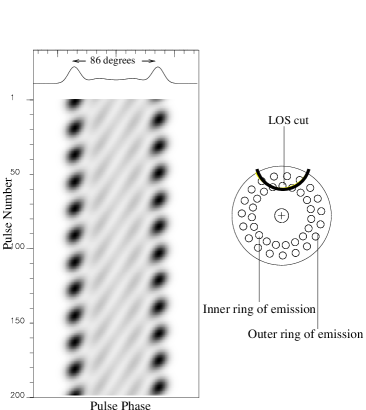
To confirm these interpretations, we simulate the radiation from B081841 using the method described in [Gil & Sendyk (2000)]. The goal of the simulations is to reproduce the following observed properties : (i) width of the pulse profile, (ii) the relative intensities of the drift regions and (iii) the overall pattern of drifting. Based on our interpretation, we use 19 equi-spaced sparks in each of 2 concentric rings, rotating with a drift rate of . The other free parameters in the simulations are the angle between the magnetic and rotation axes (), the angle between the magnetic axis and the LOS (), the radii of the rings, the sizes and relative intensities of the sparks. We note that the presence of closely spaced drift regions with widely different values, and our inference that the LOS intersects only one spark from the outer ring, all favour an inner LOS geometry (negative ) over an outer LOS geometry (positive ).
For an inner geometry, we find satisfactory results for a fairly narrow range of values of , : roughly from °and °to °and °. Fig. 7 shows a typical simulation result, for the case of °and °. Here, the radius of the outer ring is 0.8 and the inner ring is 0.6 ( being the polar cap radius). As can be seen, most of the observed features of the average profile and the drift bands are well reproduced, including the significant change of between the inner and the outer drift regions, which is clearly a geometrical effect. Interestingly, a 180°phase shift between the spark locations on the inner and outer rings is needed to match the PLR of the observed drift pattern (see Fig. 2). For an outer LOS geometry, typical best fit results are for °and °. In this case, we find that for any reasonable geometry, (i) to reproduce the closely spaced inner and outer drift regions, the radial separation between the two rings needs to be rather small (0.72 and 0.82 ); (ii) to reproduce the observed in the inner region (with the observed profile width), the sizes of the sparks need to be very small; (iii) furthermore, the wide difference in values of the two regions is difficult to reproduce accurately.
Finally, to investigate the relationship between and , simulations have been tried using sparks of unequal intensities to bring out the presence of explicitly in the fluctuation spectrum. Different values of are achieved by using slightly different values of the drift rate. In the general case, two different features can be seen in the spectrum, corresponding to (caused by periodic drifting features) and (caused by the amplitude modulation due to the unequal sparks). For the appropriate choice of drift rate (equal to 20°/), these two features merge/overlap in the spectrum to produce the measured signal. For the real data, we believe that if the is present in the spectrum, it is co-located with the aliased signal, at .
4 Discussions and Summary
The remarkable subpulse drift pattern of B081841 can be interpreted as being due to an unaliased drift with a , or an aliased drift with . We believe that the latter is a more likely scenario for this pulsar. An unaliased drift can not explain the occurrence of longitude stationary sub-pulses and sense reversal of the drift rate that is seen in our data. For an aliased drift rate, this can be explained by small variations of the drift rate that move the across the nearest Nyquist boundary ([Gupta et al. (2004)]). Though it is rare for the signature of carousel rotation period to be directly present as a low frequency feature in the fluctuation spectrum, we note that this has been claimed for at least two other cases : B0834+06 ([Asgekar & Deshpande (2005)]) and B094310 in Q mode ([Asgekar & Deshpande (2001)] and [Rankin & Suleymanova (2006)]).
It is interesting to compare our results with the theoretical models for drift, such as that given by [Gil & Sendyk (2000)]. According to their equations (12) and (13), the complexity parameter (which can be represented as , with being the putative number of cones), can be used to estimate the number of sparks in a ring as . Taking , we get : . Further, if , then from Eqn. 1 we obtain, . Hence, , which relates the number of cones to the measured periodicity and the alias order. Here, the plus sign applies for even alias orders, i.e. , and the minus sign for the odd alias orders, i.e. , . Thus, for our measured periodicity of , the right hand side evaluates to for the inner LOS solution and first allowed alias order (). For the outer LOS solution, it evaluates to for the first allowed alias order (). The left hand side evaluates to for and to for . Thus, the outer LOS solution is more compatible with the pulsar having two cones, whereas the inner LOS solution is in closer agreement with a three cone model. It is quite likely that the LOS misses the third innermost cone in this pulsar. Note that drift with higher alias orders (e.g. ) is incompatible with the above picture : either the number of sparks has to be twice as many (which is unlikely), or the has to be shorter by a factor of 2.
Furthermore, the complexity parameter can be used to estimate the screening factor for the partially screened gap model, which describe the inner acceleration region in pulsars ([Gil, Melikidze & Geppert (2003)]). From equation (2) of [Gil et al. (2006)], . For unaliased drifting (), and for and , respectively. For aliased drifting with , the corresponding estimates for are 0.14 and 0.19. In [Gil, Melikidze & Geppert (2003)], calculated values for different pulsars range from 0.032 to 0.36, with a typical value of meaning that on the average the actual potential drop is of the order of 10% of the pure vacuum gap ([Ruderman & Sutherland (1975)]. The value for the aliased drift case for B081814 is comparable to this, whereas for the unaliased drift case it will be the lowest amongst the known values of . This lends further support to our preference for aliased drift in the case of this pulsar.
The attempt to determine and has been successful only for a few other pulsars : B083406 (, [Asgekar & Deshpande (2005)]), B094310 (, =0, [Deshpande & Rankin (1999)]), B080974 (, , [van Leeuwen et al. (2003)]) and B082634 (, [Gupta et al. (2004)]). We note that compared to these values, our results for B081841 give for the unaliased case and for the aliased case.
The permanent PLR between the inner and the outer drift regions is a unique feature in B081841. It suggests that the relative location of the circulating spark pattern in the two rings is strongly correlated, rather than being independent. Furthermore, the circulation rate is the same for both the rings, indicating a common electodynamic control in the entire polar cap. Arrangement of sparks located 180°phase shifted in the inner and the outer rings would correspond to the sparks that are maximally packed on the polar cap. Spark discharges occur in every place where the potential drop is high enough to ignite and develop pair production avalanche ([Ruderman & Sutherland (1975)]), so sparks populate the polar cap as densely as possible. At the same time such arrangement of sparks should be quasi rigid, a property which is also suggested by the data. These results could be of significant implication for the physics of the polar cap. Multiple drift regions, with their drifts phase related to each other, are known in only a few pulsars, e.g. B081509 by [McLaughlin et al. (2004)], and B183904 by [Weltevrede et al. (2006)]. The mirrored drift bands for B081509 are explained in the sparking gap model as emission coming from an inner core gap (we refer as vacuum gap) and inner annular gap ([Qiao et al. (2004)]). The closely spaced inner and the outer drift regions can constrain the radial distances between the rings of emission in the polar cap of B081841. The radius of the inner and the outer ring from the simulation (Fig. 7) are, and are roughly in the range predicted for other pulsars by [Gupta & Gangadhara. (2003)] with a separate investigation method.
To summarize, we find that B081841 is a wide profile pulsar with unique drifting properties:
closely spaced inner and outer drift regions, with apparently different drift rates, but permanently
locked in phase to each other. To explain the observations, we find that the pulsar needs to be a
fairly aligned rotator, with emission seen from two conal rings on the polar cap, likely viewed with
an inner LOS geometry. Each ring has about 19 - 21 sparks, and it is very likely that the carousel
rotation period is about for this pulsar.
The observations and analysis presented here constitute only a preview of the remarkable
properties of B081841. Follow up studies, including polarisation information and single pulse
observations at different frequencies, are expected to provide new and interesting results.
Acknowledgements : We thank the staff of the GMRT for help with the observations. The GMRT is run by the National Centre for Radio Astrophysics of the Tata Institute of Fundamental Research. We thank R. Smits for the fluctuation spectrum analysis routine, and J. Rankin and D. Mitra for insightful discussions. J. G. and M. S. acknowledge a partial support polish grant 1 P03D02926.
References
- [Asgekar & Deshpande (2001)] Asgekar, A., Deshpande, A. A., 2001, MNRAS, 326, 1249.
- [Asgekar & Deshpande (2005)] Asgekar, A., Deshpande, A. A., 2005, MNRAS, 357, 1105.
- [Backer (1970)] Backer, D. C., 1970, Nature, 227, 692.
- [Deshpande & Rankin (1999)] Deshpande, A. A. and Rankin, J. M., 1999, ApJ, 524, 1008.
- [Esamdin et al. (2005)] Esamdin, A., Lyne, A.G., Graham-Smith, F., Kramer, M. and Manchester, R.N., 2005, MNRAS, 356, 59.
- [Gil & Sendyk (2000)] Gil, J. and Sendyk, M., 2000, ApJ, 541, 351.
- [Gil, Melikidze & Geppert (2003)] Gil, J., Melikidze G. I., Geppert U., 2003, A&A, 407, 315.
- [Gil et al. (2006)] Gil, J., Melikidze, G. and Zang, B., 2006, A&A, 457, L5.
- [Gupta et al. (2004)] Gupta, Y., Gil, J., kijak, J. and Sendyk, M., 2004, A&A, 426, 229.
- [Gupta & Gangadhara. (2003)] Gupta, Y., Gangadhara, R. T., 2003, ApJ, 584, 418.
- [Gupta et al. (2000)] Gupta, Y., Gothoskar, P. B., Joshi, B. C., Vivekanand, M., Swain, R., Sirothia, S., and Bhat, N.D.R., 2000, in IAU Colloq. 177, Pulsar Astronomy, ed. M. Kramer, N. Wex, and R. Wielebinski (ASP Conf. Ser. 202; San Francisco: ASP), 277.
- [McLaughlin et al. (2004)] McLaughlin, M. A., in IAU Symp. 218, Young Neutron Stars and Their Environments, ed F. Camilo & B. M. Gaensler (San Francisco: ASP), 127.
- [van Leeuwen et al. (2003)] van Leeuwen A. G. J., Stappers B. W., Ramchandran R., Rankin J. M., 2003, A&A, 399, 223.
- [Manchester et al. (1978)] Manchester, R. N., Lyne, A. G., Taylor, J. H., Durdin, J. M., Large, M.I., Little, A.G., 1978, MNRAS, 185, 409.
- [Qiao et al. (1995)] Qiao Guojun, Manchester, R. N., Lyne, A.G., Gould, D. M., 1995, MNRAS, 274, 572.
- [Qiao et al. (2004)] Qiao G., Lee, K. J., Zang, B., Xu, R. X. and Wang, H. G., 2004, ApJ, 616, L127.
- [Rankin & Suleymanova (2006)] Rankin, J. M., Suleymanova, S. A., 2006, A&A, 453, 679.
- [Ruderman & Sutherland (1975)] Ruderman, M. A. and Sutherland, P. G., 1975, ApJ, 196 51.
- [Ruderman (1976)] Ruderman, M. A., 1976, ApJ, 203 206.
- [Weltevrede et al. (2006)] Weltevrede, P., Edwards, R. T. and Stappers, B. W., 2006, A&A, 445 243.