The Structured Chromosphere and Wind of TW Hya1
Abstract
The nearby accreting T Tauri star, TW Hya is viewed almost pole on, so its accretion and wind characteristics can be examined. A continuous set of echelle spectra of TW Hya, taken with the MIKE spectrograph on the Magellan2/Clay telescope at Las Campanas Observatory in April 2006 reveals systematic variations in the flux, velocity, and profile of the H-alpha emission line. These variations appear to be consistent with the photometric period of 2.8 days. Absorption features recur at high outflow velocities (100 and 200 km s-1) in the wind. Additional spectra from 2004 show a similar repetitive pattern. This behavior suggests that: (a) accretion is not uniformly distributed over the stellar hemisphere in view; (b) stable structures are present in the chromosphere, most likely due to the stellar magnetic field configuration. Semi-empirical models of the atmosphere have been constructed to reproduce line profiles of H- and He I, 10830 using the PANDORA code and to define the wind structure. These preliminary calculations suggest the mass loss rate is variable and comparable to H- mass accretion rates in the literature, requiring a very efficient mechanism if the wind is powered only by accretion.
Harvard-Smithsonian Center for Astrophysics, 60 Garden Street, Cambridge, MA 02138 USA
1. Introduction
The nearby accreting T Tauri star, TW Hya is oriented with its rotation axis almost along our line of sight, and the surrounding accretion disk approximately in the plane of the sky (Krist et al. 2000) providing a good opportunity to study its accretion and wind characteristics. The discovery of a hot, fast wind from this star (Dupree et al. 2005) calls for a determination of the mass loss rate, wind speed, and temperature in the outer atmosphere, and its relation to the mass accretion rate. A sufficiently robust stellar wind may lead to optical jets, could remove angular momentum from the star (Matt & Pudritz 2005), contribute to the opacity needed for X-ray absorption (Flaccomio et al. 2003), and influence the diminution of dust in accretion disks (Alexander et al. 2005). The chromospheric lines of H- and He I 10830 are reported here for TW Hya to characterize the flux variations and line profiles. Detailed models of wind-sensitive line profiles of H- and He I (10830) are presented for expanding semi-empirical atmospheric models using the Avrett/Loeser PANDORA code for full non-LTE effects. These models constrain both the atmospheric structure and the mass loss rate implied by the observed wind-scattered line profiles.
2. Observations
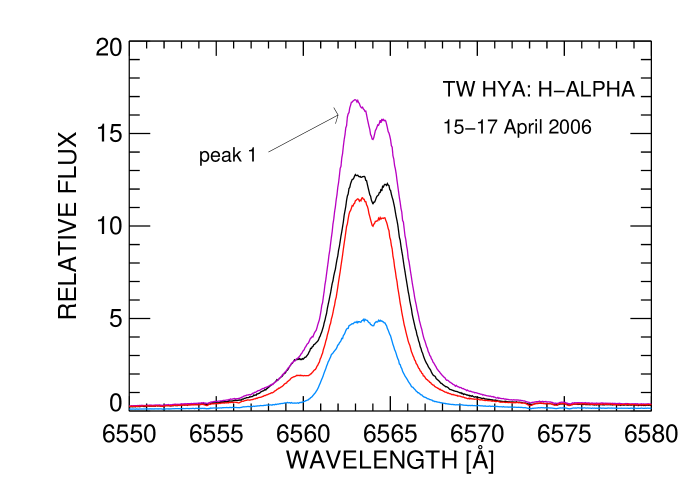
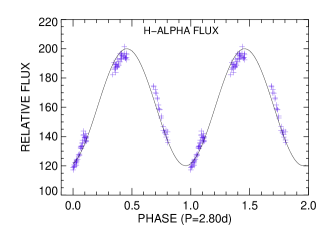
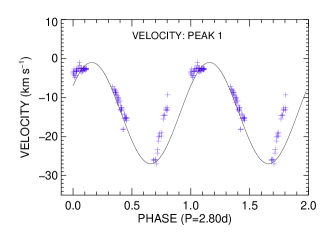
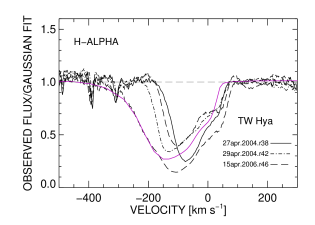
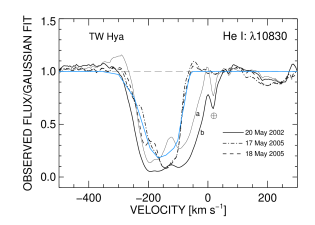
TW Hya was observed continuously for 3 successive nights in April 2006 at the Magellan/Clay telescope using the MIKE echelle spectrograph. Additional optical spectra were taken previously in April 2004. The slit width of 0.75 arcsec yielded a resolution of 36,000 near H-. Infrared spectra of He I 10830 were taken at KECK II using the NIRSPEC infrared spectrograph in May 2002 and July 2005, and reported elsewhere (Dupree et al. 2005). Profiles of H- showed substantial variation in flux and radial velocity over the course of all observations, (see Fig. 1, 2, and 3). The P Cygni profiles of He 10830 showed variations in the wind absorption among the 3 observations suggesting changes in the wind structure. The extent of absorption reaches 300 km s-1 in both H and He I. Since H- and 10830 are chromospheric lines, these velocities are supersonic and may be an indication of shocks and transient events. The photospheric escape velocity is 500 km s-1, but at a distance of 1R⋆ above the surface, the escape speed approaches 300 km s-1 so a small extension of the atmosphere could easily lead to mass loss.


3. Models
The PANDORA code is a general purpose non-LTE atmospheric modeling and spectrum synthesis code (Avrett & Loeser 2003). We invoke a model atmosphere which is spherical and expanding. PANDORA takes into account the time-independent optically-thick non-LTE transfer of line and continuum radiation for multilevel atoms and multiple stages of ionization including partial frequency redistribution. In calculating the line source functions we include the effects of atmospheric outflows. Multi-level atoms (3 levels for hydrogen, and 5 levels for helium, plus the continua) were used.
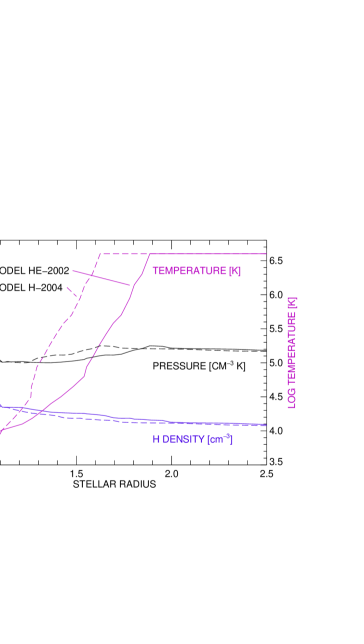
The starting semi-empirical models for the observations consist of temperature, density, and velocity and their radial dependence (see Fig. 6). In this calculation, the run of temperature and density are comparable to solar values; the density at 30,000K is consistent with values from the diagnostic C II lines (2326Å) in TW Hya that indicate Ne 4109 cm-3. The maximum coronal temperature is taken as the value ( K) suggested by the emission measure distribution derived from CHANDRA X-ray spectra (Kastner et al. 2002). The velocity profile is constructed to match the velocities observed in the lines and is close to mass-conserving. The velocities and the radial height scales are varied in order to fit the observed absorption line profiles.
The strengths of emission lines observed in T Tauri stars are substantially influenced by the hot plasma produced on the stellar surface as a result of the accretion flow. Thus we have focussed, not on reproducing the emission flux profile which is difficult to predict, but rather on the effects of the wind scattering on the line profile.
4. Conclusions
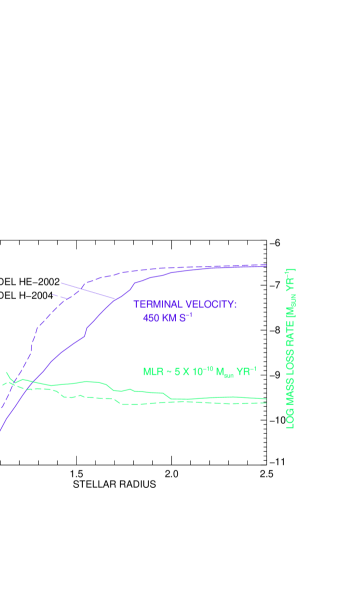
A continuous set of echelle spectra of TW Hya, taken with MIKE on Magellan2 in April 2006 reveals systematic variations in the flux, velocity, and the profile of the H- emission line. Absorption features recur at high velocity in the wind. Additional spectra from 2004 show a similar repetitive pattern. The flux variation indicates that accretion is not uniform and is consistent with the photometric variation found by Lawson and Crause (2005) which they attribute to the presence of accretion hot spots on the stellar surface. Absorption ‘notches’ appear on the short wavelength side of the H- line at velocities near 100 and 200 km s-1. Similar notches appear in the He I 10830 profiles too. The fact that similar H- profiles (with notches) occur in our data from 2004 and 2006 indicates stable atmospheric structures. An obvious source creating such structures is a magnetic field that configures the chromosphere. Semi-empirical models of the atmosphere have been constructed to compute the scattering line profiles using the PANDORA code. The wind absorption appears to vary in both H- and He 10830, and will require multiple models. The first approximations shown here for H- and He suggest that the (spherical) mass outflow rate is on the order of 5 10-10 M⊙ yr-1. This value is comparable to the accretion rate indicated by H- (Muzerolle et al. 2000) of 410-10 M⊙ yr-1 and would appear to require a very efficient mechanism if the wind is powered only by accretion.
Acknowledgments.
This research is supported in part by the Smithsonian Astrophysical Observatory, and a Hungarian OTKA Grant No. T042509.
References
- (1) Alexander, R. D., Clarke, C. J., & Pringle, J. E. 2005, MNRAS, 358, 283
- (2) Avrett, E., & Loeser, R. 2003, in Modeling of Stellar Atmospheres, IAU Symp. 210, ed. N. Piskunov, W. Weiss, & D. Gray, (Dordrecht:Kluwer), 14 pp, CD-A21
- (3) Dupree, A. K., Brickhouse, N. S., Smith, G. S., & Strader, J. 2005, ApJ, 625, L131
- (4) Flaccomio, E., Damiani, F., Micela, G., Sciortino, S., Harnden, F. R. Jr., Murray, S. S., & Wolk, S. J. 2003, ApJ, 582, 398
- (5) Howarth, I. D., Prinja, R. K., & Massa, D. 1995, ApJ, 452, L65
- (6) Kastner, J. H., Huenemoerder, D. P., Schulz, N. S., Canizares, C. R., & Weintraub, D. A. 2002, ApJ, 567, 434
- (7) Krist, J. E., Stapelfeldt, K. R., Ménard, François, Padgett, D. L., & Burrows, C. J. 2000, ApJ, 538 793
- (8) Lawson, W. A., & Crause, L. A. 2005, MNRAS, 357, 1399
- (9) Matt, S., & Pudritz, R. E. 2005, ApJ, 632, L135
- (10) Muzerolle, J., Calvet, N., Briceño, C., Hartmann, L., & Hillenbrand, L. 2000, ApJ, 535, L47