Deep Spitzer spectroscopy of the ‘Flying Saucer’ edge-on disk: Large grains beyond 50 AU.
Abstract
We present deep Spitzer-IRS low-resolution (100) 5-35 m spectroscopy of the edge-on disk “the Flying Saucer” (2MASS J16281370-2431391) in the Ophiuchus molecular cloud. The spectral energy distribution exhibits the characteristic two-peak shape predicted for a circumstellar disk viewed very close to edge-on. The short-wavelength peak is entirely due to photons scattered off the surface of the disk, while the long-wavelength peak is due to thermal emission from the disk itself. The Spitzer spectrum represents the first spectroscopic detection of scattered light out to 15 m from a bona-fide, isolated edge-on disk around a T Tauri star. The depth and the wavelength of the mid-infrared ”valley” of the SED give direct constraints on the size distribution of large grains in the disk. Using a 2D continuum radiative transfer model, we find that a significant amount of 5-10 m-sized grains is required in the surface layers of the disk at radii of 50-300 AU. The detection of relatively large grains in the upper layers implies that vertical mixing is effective, since grain growth models predict the grains would otherwise settle deep in the disk on short time scales. Additionally, we tentatively detect the 9.66 m S(3) line of H2 and the 11.2 m emission feature due to PAHs.
1 Introduction
Highly inclined circumstellar disks are particularly well-suited for studies of the dust properties in optically thick proto-planetary systems. The very high degree of obscuration toward the bright inner parts of these disks acts as a natural coronograph and thereby increases the contrast to the fainter outer parts by several orders of magnitude, enabling direct studies of the optical and infrared properties of the disk surface layers at radii of 50 AU; the region of the surface to scattering as seen by an observer. In particular, the scattering properties and therefore the grain size distributions and the vertical height of the disk can be constrained using spatially resolved imaging. Examples of such studies employing optical and near-infrared scattered light images of edge-on disks include Burrows et al. (1996); Stapelfeldt et al. (1998); Cotera et al. (2001); Stapelfeldt et al. (2003); Wolf et al. (2003).
These studies have shown that the extended emission at optical and near-infrared wavelengths has a morphology closely resembling that theoretically expected for edge-on disks, i.e. two flattened reflection nebulosities bisected by a dark lane in the disk plane. Attempts to use these relatively short wavelengths to search for grains larger than those found in the interstellar medium have produced somewhat inconclusive results, and it has become clear that observations at longer wavelengths are required (e.g. Brandner et al., 2000; Wood et al., 2002). A number of mid-infrared images have been made of edge-on disks. Spatially resolved emission at 11.8 m from the edge-on disk HK Tau B was presented by McCabe et al. (2003), who used the image to infer a grain size distribution with relatively large grains (1.5–3.0 m). Perrin et al. (2006) presented mid-infrared images of an edge-on disk clearly dominated by Polycyclic Aromatic Hydrocarbon (PAH) emission rather than scattered light.
A problem is that edge-on disks tend to be very faint in the mid-infrared, requiring very sensitive observational facilities. Highly sensitive spectroscopy offered by the Spitzer Space Telescope provides new possibilities. Spitzer will not spatially resolve the mid-infrared emission, except for extremely large disks, but can obtain spectroscopic information that provides essential constraints for systems that have already been imaged at shorter wavelengths. One important advantage of spectroscopy is that line emission can be distinguished from scattered light, a distinction that becomes essential when trying to constrain scattering properties of the dust.
In this letter, we report deep mid-infrared spectroscopic observations using the Infrared Spectrograph (IRS) on Spitzer of the “Flying Saucer” edge-on disk located on the outskirts of the Ophiuchus star forming cloud core, first identified in high resolution near-infrared images (Grosso et al., 2003). The spectrum was obtained as part of the “From cores to disks” (c2d) Legacy program (Evans et al., 2003). The “Flying Saucer” is one of the most isolated edge-on disks known with a foreground visual extinction less than a few magnitudes, and is viewed almost exactly edge-on ().
2 Data reduction and results
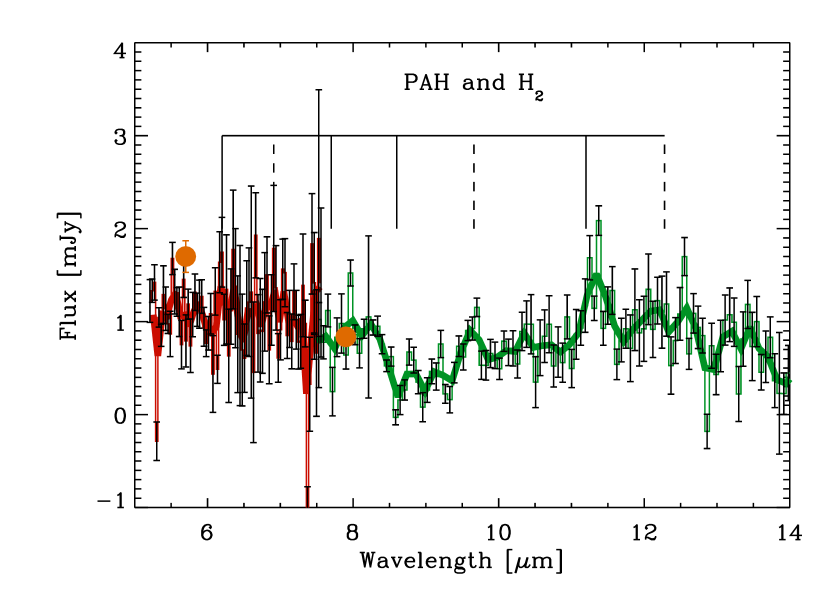
The “Flying Saucer” (2MASS J16281370-2431391, 16h28m137, -24°31′39″[J2000]) was observed using both the short-low (SL2 = 5.2–7.5 m, SL1 = 7.5–14.5 m) and long-low (LL2 = 14.2–21.0 m, LL1 = 19.8–38.1 m) modules of the IRS (AOR KEY 0009829632). Each SL order was observed for s and each LL order for s. The spectral extraction was performed from the BCD pipeline (version S13.2.0) products by co-adding each nod position and then subtracting the two resulting 2D spectra to effectively remove the background. Due to the presence of a bright source on the peakup array for the SL1 observation, the noise at wavelengths between 12.7 and 14.5 m is significantly higher than in other parts of the spectrum. The “Flying Saucer” is clearly detected in SL1 and 2 as well as in LL1; there is no detection in LL2, consistent with a location of the flux minimum around 20 m. One-dimensional spectra were extracted using 3-pixel (5.4″) apertures to optimize the signal-to-noise. To aid the modeling efforts, IRAC and MIPS photometry has been extracted from the c2d photometric database. The spectra match the IRAC band 3 (5.7 m) and 4 (7.9 m) photometry within the accuracy of the absolute calibration. The difference in slope between the spectrum and IRAC 3 and 4 may be due to the source being extended; the SL slit width is 3.6″. The source is detected in MIPS1 (24 m) and only an upper limit is available in MIPS2 (70 m) (see Table 1).
The resulting SL spectrum is shown in Fig. 1 and shows two weak, narrow emission features at m and m with line-to-continuum ratios of . Care should be taken in interpreting these features because the behaviour of the spectrograph is not yet fully understood, and features at the 5-10% level may be spurious. Assuming gaussian noise, the two emission features are detected with S/N ratios of 4-5. Inspection of the co-added 2D spectra confirms that the features are compact and centered on the continuum position, at least along the slit, which is aligned at a position angle of 5°, or roughly perpendicular to the disk plane. We tentatively identify the emission features as the H2 S(3) line at 9.66 m and the out-of-plane bending mode of PAHs at 11.2 m. The strength of the S(3) line corresponds to an integrated flux of , while the 11.2 m line flux is , using a 1st order polynomial fit to the continuum. For an excitation temperature of K the other H2 lines are expected to be below the detection limit, taking into account the higher noise at the 6.9 m S(5) line. The PAH line flux is 2-3 orders of magnitude less and the line-to-continuum ratio is about 10 times larger than those determined for other PAH-emitting disks in the c2d sample (Geers et al., 2006).
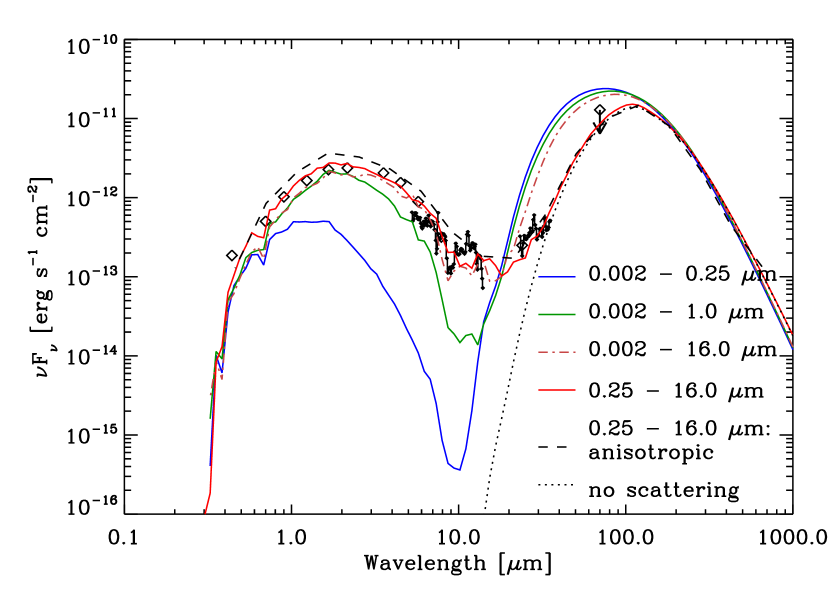
The spectral energy distribution (SED), shown in Fig. 2, declines between 4 and 14 m. The LL spectrum falls below the detection limit of mJy below 24 m, but rises steeply at longer wavelengths. This spectral shape closely resembles that theoretically expected for a circumstellar disk viewed close to edge-on (see e.g. Whitney et al., 2003). The observed mid-infrared fluxes of 1 mJy matches closely those predicted by the Grosso et al. (2003) model. At short wavelengths (m) the optical depth to the source (the star and hot dust in the inner disk) is much greater than unity. This means all the short-wavelength photons are those that are scattered off the surface of the disk at large radii - in this case, 50–300 AU. The SED of the scattered light will have a shape that can be calculated roughly as the spectrum of the inner star+disk system multiplied by the albedo of the dust in the outer disk. At long wavelengths, the SED is dominated by thermal emission from the cold, outer part of the disk. These two components create a characteristic double-peaked SED with a minimum in the range 5-20 m that is unrelated to, but may in some cases be confused with, the silicate band at 9.7 m
| Wavelength (m) | Flux [mJy] | Reference |
|---|---|---|
| 3.6 | c2d | |
| 4.5 | c2d | |
| 5.7 | c2d | |
| 7.9 | c2d | |
| 24 | c2d | |
| 70 | c2d |
3 Constraining the dust size distribution
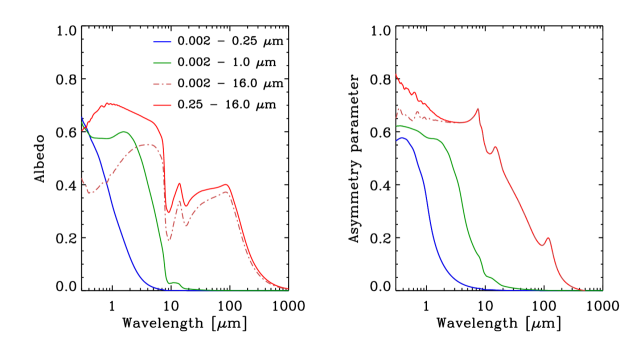
We have constructed a 2D continuum radiative transfer model of the “Flying Saucer” with a setup similar to that of Pontoppidan et al. (2005) using the Monte Carlo code RADMC (Dullemond & Dominik, 2004). This setup uses an axisymmetric density structure on a polar grid to calculate images and spectra. We use Mie theory to calculate the input opacities to the model and explore a range of different grain size distributions. These are modeled by a power law size distribution with maximum and minimum grain radii, and and . The dust material is silicate with optical constants from Draine & Lee (1984) and amorphous carbon (800 K experiment of Jager et al. (1998)). For simplicity, it is assumed that carbon and silicate grains are separate populations with 15% of the mass in carbon. Fig. 3 shows the scattering properties for some of the grain models.
We model the physical disk structure using the Grosso et al. (2003) model parameters as a starting point. These are an outer disk scale height of , a disk mass of , a surface density power law and a flaring scale height that varies as: . The disk has a radius of 300 AU. The disk parameters have been obtained by Grosso et al. (2003) by detailed fitting to the near-infrared images, using a grain size distribution with a maximum grain size of m. Since no photometry is available above 70 m, the properties of the disk mid-plane are not well-constrained. Some changes to the Grosso et al. (2003) model were made. First, we adopted a slightly smaller distance of 125 pc instead of 140 pc (de Geus et al., 1989). Second, to improve the fit to the near-infrared and IRAC photometry, we found it necessary to include a relative accretion luminosity of to the system, modeled by adding a blackbody with a temperature of 1400 K to the input stellar spectrum, which is modeled by a 0.084 3500 K stellar atmosphere from Kurucz (1979), as well as setting the foreground extinction to mag. The accretion luminosity, and effective temperature are somewhat interdependent, so other combinations may be possible, in particular, the central star may be cooler and more luminous, requiring less accretion. Removing the accretion component entirely will lower the 1-5 m flux by a factor of . In any case, these parameters do not affect wavelengths longer than m, and therefore not the derived grain size distribution.
Given a set of parameters determining the physical structure of the disk the grain size distribution strongly affects the shape and the location of the minimum of the SED in the mid-infrared. In Fig. 2, models with different grain size distributions are compared to the observed SED and in particular to the IRS spectrum. As larger grains are included in the grain population, the mid-infrared flux due to scattered photons increases relative to the rest of the SED. While light is always scattered at the surface where the scattering optical depth () is unity, the albedo controls how much light actually survives (is not absorbed and re-emitted at longer wavelengths) to be scattered at . According to Fig. 3, a significant population of m grains is required in order to have an albedo at 20 m. Additionally, as the small grains are removed, the thermal emission peak shifts to longer wavelengths.
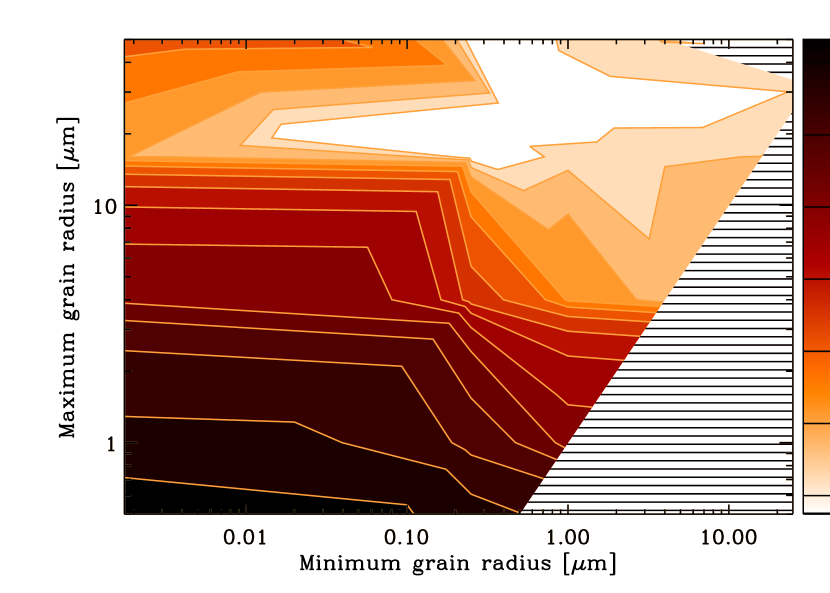
We ran a grid of models varying the minimum and maximum grain sizes, while keeping the density structure constant, to minimize the quantity . Figure 4 shows the goodness-of-fit surface. Inspection shows that good matches to the SED are found for grain size distributions with m and m. While the exact limits to the grain size distribution are not strictly constrained from the SED alone, the presented model clearly excludes grain size distributions with no grains larger than m or distributions that are dominated (in mass) by grains that are m. The upper cutoff for the grain size distribution may be significantly larger. The required presence of large grains is very stable to changes in the density structure of the disk and slope of the grain size distribution. Whether there is a lower cutoff to the grain size is less secure. For instance, a shallower grain size distribution was found to, at least in part, lessen the need for a lower cutoff of grain sizes. Additionally, a larger disk mass may be required since our best-fitting J-band opacity is times lower than that used by Grosso et al. (2003). Models with higher disk masses lessen the need for a lower grain size cutoff by shifting the thermal peak in the SED to longer wavelengths, but do not affect the scattering peak. We are therefore confident that large grains are present in the Flying Saucer, while the evidence for a lack of small grains is somewhat more ambiguous. This result strengthens similar conclusions obtained for other edge-on disks using less constraining data at shorter wavelengths (Wood et al., 2002; McCabe et al., 2003) and provides strong evidence for the presence of grain growth in the outer disk of the “Flying Saucer”.
The model grid uses isotropic scattering, thereby requiring much fewer photon packages than if anisotropic scattering is used. While not a proper treatment of scattering of large grains, computing time is drastically cut this way. To ensure that the conclusions are not affected, we also calculated the SED of the best-fitting model using a proper anisotropic scattering model. Anisotropic scattering has the effect of making the image of the disk more compact around the central star. The effect on the SED is small as seen in in Fig. 2; it changes the flux by at wavelengths dominated by scattered photons. This difference is very small compared to the 2-3 orders of magnitude dependence on the grain size distribution in the mid-infrared.
4 Discussion
The IRS spectrum of the “Flying Saucer” has provided important constraints on the nature of disk material in the surface layers () of the disk at radii larger than 50 AU in several different ways. First, dust grains in this part of the disk are much larger than grains in the interstellar medium, clearly implying significant grain growth. Second, tentative emission features from PAHs and H2 reveal clues about emission excited by UV photon processes in the outer disk. Had the disk been viewed face-on, these faint features would have disappeared in the glare from the warm inner parts of the disk; at 10 m the “Flying Saucer” would be 200 times brighter if viewed face-on.
Evidence from silicate emission features has already indicated that grains have grown to several m (Bouwman et al., 2001; van Boekel et al., 2005) at small disk radii, within AU (van Boekel et al., 2004), in Herbig Ae disks, as well as T Tauri stars (Kessler-Silacci et al., 2006). In contrast, mid-infrared observations of scattered light such as those presented in this letter can reveal the presence of large grains in the surface layers much further away from the central star. While millimeter continuum studies have also found evidence for large grains in the outer regions of disks (e.g. Natta et al., 2004; Rodmann et al., 2006), such observations probe only the mid-plane. In the case of the “Flying Saucer”, we have shown that significant grain growth has taken place at large distances from the star (up to several 100 AU), consistent with the conclusions of McCabe et al. (2003) in the case of HK Tau B, a similar edge-on disk. When comparing this result to recent models of grain growth and settling (e.g. Dullemond & Dominik, 2004, 2005), an apparent problem appears. These models predict that grain growth to sizes m followed by rapid settling to the disk mid-plane takes place on very short timescales ( years). This will effectively remove larger grains from the disk surface on a time scale that increases with radius and decreases with grain size. The new observational evidence presented here shows that large grains are present in the disk surface not only close to the star, as found in other studies, but also at much larger distances. This implies that in both these regimes there is an efficient mechanism for preventing grains in the m range from settling.
Adding to the puzzle is the indication of the presence of very small grains, such as PAHs, in the same general region of the disk as the large grains. Even if the detection of PAHs in the “Flying Saucer” is only tentative, some edge-on disks clearly show very strong PAH features (Perrin et al., 2006). Very small grains will not settle, so the question they pose is why they have not been removed by the grain coagulation producing the observed population of large grains, or whether there is a process to replenish them.
Another possibility for explaining the presence of PAH emission is that the 11.2m feature may be light from the inner parts of the disk scattered on the outer surface. This requires that the line-to-continuum ratio of the PAH emission from the inner disk is the same as that observed in the “Flying Saucer”. Observations of face-on disks have shown that such strong line emission is rare, but not impossible (Geers et al., 2006).
The tentative detection of the S(3) line of H2 is interesting. The S(3) line dominates the H2 line spectrum for gas at a temperature of a few hundred Kelvin. Detailed modeling by Nomura & Millar (2005) has shown that, in the presence of a significant UV excess, the S(3) line flux from a disk very similar to that of the “Flying Saucer” is expected to be , with most of the flux originating in the uppermost layers of the disk at radii of 10-100 AU. If confirmed, the presence of the line can therefore be interpreted as an indicator of a strongly enhanced UV field in the upper layers.
Finally, the possible presence of high contrast emission lines in the spectrum of the “Flying Saucer” suggests that edge-on disks may be excellent targets for looking for fluorescent tracers in the outer disk that would not have been seen if the disk had been viewed face-on. This illustrates the need for sensitive space-born high-resolution mid-infrared spectroscopy in the future offered by SOFIA and the James Webb Space Telescope.
References
- Bouwman et al. (2001) Bouwman, J., Meeus, G., de Koter, A., Hony, S., Dominik, C., & Waters, L. B. F. M. 2001, A&A, 375, 950
- Brandner et al. (2000) Brandner, W. et al. 2000, A&A, 364, L13
- Burrows et al. (1996) Burrows, C. J. et al. 1996, ApJ, 473, 437
- Cotera et al. (2001) Cotera, A. S. et al. 2001, ApJ, 556, 958
- de Geus et al. (1989) de Geus, E. J., de Zeeuw, P. T., & Lub, J. 1989, A&A, 216, 44
- Draine & Lee (1984) Draine, B. T., & Lee, H. M. 1984, ApJ, 285, 89
- Dullemond & Dominik (2004) Dullemond, C. P., & Dominik, C. 2004, A&A, 417, 159
- Dullemond & Dominik (2005) —. 2005, A&A, 434, 971
- Evans et al. (2003) Evans, N. J. et al. 2003, PASP, 115, 965
- Geers et al. (2006) Geers, V. C. et al. 2006, A&A, in press, astro-ph/0609157
- Grosso et al. (2003) Grosso, N., Alves, J., Wood, K., Neuhäuser, R., Montmerle, T., & Bjorkman, J. E. 2003, ApJ, 586, 296
- Jager et al. (1998) Jager, C., Mutschke, H., & Henning, T. 1998, A&A, 332, 291
- Kessler-Silacci et al. (2006) Kessler-Silacci, J. et al. 2006, ApJ, 639, 275
- Kurucz (1979) Kurucz, R. L. 1979, ApJS, 40, 1
- McCabe et al. (2003) McCabe, C., Duchêne, G., & Ghez, A. M. 2003, ApJ, 588, L113
- Natta et al. (2004) Natta, A., Testi, L., Neri, R., Shepherd, D. S., & Wilner, D. J. 2004, A&A, 416, 179
- Nomura & Millar (2005) Nomura, H., & Millar, T. J. 2005, A&A, 438, 923
- Perrin et al. (2006) Perrin, M. D., Duchêne, G., Kalas, P., & Graham, J. R. 2006, ApJ, 645, 1272
- Pontoppidan et al. (2005) Pontoppidan, K. M., Dullemond, C. P., van Dishoeck, E. F., Blake, G. A., Boogert, A. C. A., Evans II, N. J., Kessler-Silacci, J. E., & Lahuis, F. 2005, ApJ, 622, 463
- Rodmann et al. (2006) Rodmann, J., Henning, T., Chandler, C. J., Mundy, L. G., & Wilner, D. J. 2006, A&A, 446, 211
- Stapelfeldt et al. (1998) Stapelfeldt, K. R., Krist, J. E., Menard, F., Bouvier, J., Padgett, D. L., & Burrows, C. J. 1998, ApJ, 502, L65+
- Stapelfeldt et al. (2003) Stapelfeldt, K. R., Ménard, F., Watson, A. M., Krist, J. E., Dougados, C., Padgett, D. L., & Brandner, W. 2003, ApJ, 589, 410
- van Boekel et al. (2004) van Boekel, R. et al. 2004, Nature, 432, 479
- van Boekel et al. (2005) van Boekel, R., Min, M., Waters, L. B. F. M., de Koter, A., Dominik, C., van den Ancker, M. E., & Bouwman, J. 2005, A&A, 437, 189
- Whitney et al. (2003) Whitney, B. A., Wood, K., Bjorkman, J. E., & Wolff, M. J. 2003, ApJ, 591, 1049
- Wolf et al. (2003) Wolf, S., Padgett, D. L., & Stapelfeldt, K. R. 2003, ApJ, 588, 373
- Wood et al. (2002) Wood, K., Wolff, M. J., Bjorkman, J. E., & Whitney, B. 2002, ApJ, 564, 887