22email: Ronald.Weinberger@uibk.ac.at 33institutetext: Thüringer Landessternwarte Tautenburg, Sternwarte 5, 07778 Tautenburg, Germany
33email: stecklum@tls-tautenburg.de
A photo-ionized canopy for the shock-excited Criss-Cross Nebula ††thanks: Based on observations made with the Nordic Optical Telescope, operated on the island of La Palma jointly by Denmark, Finland, Iceland, Norway, and Sweden, in the Spanish Observatorio del Roque de los Muchachos of the Instituto de Astrofisica de Canarias.
Abstract
Aims. We study a new broad well-defined arc of optical nebulosity close to the cloud-shock interacting Criss-Cross Nebula, derive the basic physical properties of the former and revise those of the latter, and compare both objects to simulations of cloud-shock interactions from the literature.
Methods. Deep optical, partly wide-field, images were used to reveal the intricate morphology and overall extent of the nebulosities. Optical spectroscopy enabled us to uncover their nature.
Results. The two nebulosities obviously are physically linked, but are of different type; the Criss-Cross Nebula is, as was shown also in an earlier paper, excited via a slow shock from the expanding Orion-Eridanus Bubble, but the broad arc is definitely photo-ionized. The source for ionizing photons appears to be hot gas in this bubble. Some results of simulations of interactions of SNRs with interstellar clouds available from the literature bear a striking resemblance to our nebulae, which appear to represent an example - unrivalled in closeness and clarity - for an early to medium stage in the destruction of an isolated cloud over-run by a highly evolved SNR. Thereby the Criss-Cross Nebula is, when seen from the SNR, the rear disrupted part of the original small cloud, whereas the arc probably is its yet rather intact front part.
Key Words.:
ISM: supernova remnants – ISM: individual objects: Criss-Cross Nebula1 Introduction
The interstellar medium (ISM) is a highly turbulent compound of various interacting gas phases and of dust. Supernova explosions probably dominate the global kinetic energy input into the ISM (Mac Low & Klessen 2004). Their remnants (SNRs) are ubiquitous in the Galaxy and the majority of these estimated 20 000-30 000 objects are very old and visible in H i only, but merely about 230 Galactic SNRs, i.e. younger examples of their kind, are currently known (Koo et al. 2006). The old SNRs fill large volumes of space; many condensations (clumps, clouds) in the ISM will be created and/or shaped by them and by the stellar winds of their predecessors, and a number of clouds will eventually be destroyed by shock-cloud interactions. Despite the frequent occurrence of the latter processes and their obvious significance for understanding the dynamics, the mass distribution within the ISM and the mixing and evolution of the ISM, only about a dozen interactions between (isolated) clouds and shocks are known. On the other hand, there are numerous theoretical - and recently, also one major experimental - studies on this topic (Stone & Norman 1992; Klein et al. 1994; Orlando et al. 2005; Byun et al. 2006; Nakamura et al. 2006; Klein et al. 2003). With respect to observed SNR shock-cloud interactions, the Cygnus Loop SNR turned out to be particularly prolific: because of its large angular size (3), low foreground extinction (a few tenths of mag in ) and various shock conditions, it serves as a favorable location for investigating shock-cloud interactions of middle-aged remnants (Patnaude & Fesen 2005).
Evolved, very close SNRs and/or wind-blown (super)-bubbles, located at moderate to high Galactic latitudes would obviously be optimum for studying how the majority of SNRs interacts with (isolated) ISM clouds or clumps. Due to the rather small expansion velocities of objects of this type (less than 100 km s-1), one would neither expect X-ray emission nor highly-ionized atomic species from such shocked clouds. Instead, the latter would show up as small optical nebulae of complex morphology and display an emission spectrum typical for shock-excitation (e.g. prominent [S ii] lines).
The Orion-Eridanus (Super)Bubble (OEB) could be a promising target for a search for interactions with ISM clouds. Its size (about 45) is comparable to its distance (0.25 kpc) and its centre is at () (195,). The OEB is filled with hot gas ( K) and is bounded by a slowly expanding ( km s-1) H i shell, the near side of which is only 0.15 kpc away from us (Heiles et al. 1999; Guo et al. 1995; Brown et al. 1995). The total mass of the H i shell is estimated to be about 2.3 105 , and its kinetic energy about 3.7 1051 erg (Brown et al. 1995). Heiles et al. (1999) call the OEB the ‘Rosetta Stone‘ of superbubbles, being in a middle evolutionary stage, having originated long ago and still being energized by massive stellar winds and supernovae, and exhibiting a remarkable range of astrophysical processes.
One decade ago, in a preliminary study we presented a new faint small (6) optical nebula of curious filamentary morphology that was found to be projected against the centre of the OEB H i shell (Zanin & Weinberger 1997). Because of its unique shape we dubbed it ‘Criss-Cross Nebula‘ (CCN). The object had no known counterpart at any other wavelengths.
A medium resolution and signal-to-noise optical spectrum (4200–6900 Å) showed a few emission lines from low ionization species only ([O iii] was not detected): the line ratios H/[S ii] = 0.9 and H/[N ii] = 1.2 prompted these authors to classify it as probably being shock-excited. They concluded that the CCN is a small, perhaps isolated, cloud over-run by the slow moving shock wave responsible for the OEB and argued for a distance of 150 pc for the CCN. The CCN remained practically unnoticed in the subsequent years. Very recently, however, Seibert et al. (2006) detected the CCN in both near and far ultraviolet passbands and modelled the UV emission as two-photon emission from a moderate velocity shock.
In 1999 we obtained a (to date unpublished) image of the CCN that reveals a complex network of filaments. Hitherto, there were only reproductions from the Palomar Observatory Sky Survey (POSS) available. However, the main reason why we are again dealing with the CCN is the advent of wide-field, high-resolution CCD imaging within the last decade, which enable us to look for previously unknown structures around the Criss-Cross Nebula and thus to perform a more detailed comparison to results of numerical simulations of cloud-shock interactions from the literature.
2 Observations
2.1 Imaging
An -band 1200 s exposure covering a field of view of 6′6′ was obtained in 1999 November at the Nordic Optical Telescope (NOT) with the faint object spectrograph and camera ALFOSC. The image has a pixel-scale of 0188 pixel-1 and the seeing during the observations was 08. A Landolt (1992) standard field for photometric calibration was observed with the same filter three times during the night. The standard reduction steps (bias subtraction, flat-fielding, cosmic-ray cleaning), as well as the determination of the magnitude zero-point and atmospheric extinction coefficient through aperture photometry of the photometric standard stars were performed with the available IRAF111IRAF is distributed by the National Optical Astronomy Observatories, which are operated by the Association of Universities for Research in Astronomy, Inc., under cooperative agreement with the National Science Foundation. packages.
Broad band I (2180 sec) and narrow band H (21200 sec) and [S ii] 6716+6731 Å (21200 sec) exposures were acquired in 2005, October 8/9, at the Thüringer Landessternwarte Tautenburg (Germany), with the 2 m telescope in the Schmidt mode, for which the correction plate limits the aperture to 1.34 m. The bandpass width (FWHM) of the H and [S ii] filters is 97 Å. The pixel size of the 2k2k SITe CCD chip, 2424 m, and the plate scale of 514 mm-1 give a field of view of 42′42′ with an image scale of 123 pixel-1.
2.2 Spectroscopy
A long slit spectrum in the wavelength range 6250 - 8190, with dispersion 1.93 Å pixel-1 and resolution 9.5 Å at 6600 Å, was obtained with a 1 hr exposure in 2005, November 9, at the 1.82 m telescope of the Padova Astronomical Observatory at Asiago (Italy), equipped with the Asiago Faint Object Camera and Spectrograph (AFOSC), that, combined with a TEK 1024 thinned CCD chip, provides a spatial scale of 047 pixel-1.
The spectrophotometric standard star G191B2B was observed immediately after the target spectrum for flux calibration purposes. The standard reduction steps (bias subtraction, flat-fielding, wavelength linearization, sky-background subtraction, atmospheric extinction correction and flux calibration) were carried out with IRAF. Cosmic-ray events were rejected by means of the package L.A.COSMIC (van Dokkum 2001).
3 Images of the CCN and its neigborhood
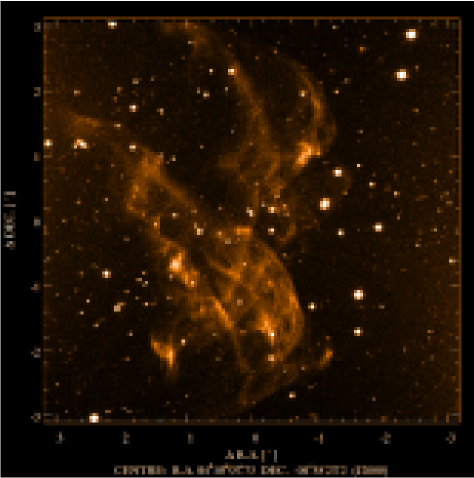
The image taken at the NOT (Fig. 1) shows the structure of the CCN in considerable detail. Compared to the extent as visible on the POSS, only a very small portion, namely its northernmost tip (03) is not covered by this image. The CCN appears to consist of two main parts, a northern and a southern one, connected by at least one long (), slightly bent, thin () filament, stretching N-S. The northern part of the CCN appears to be made up of a part of the just mentioned filament plus an additional western, more bent, filament which seems to consist of at least two subfilaments and contains one brighter region. This part of the CCN is about half as broad in E-W direction compared to the southern part. The latter stretches from NE to SW, with an extent of and shows, particularly in its southern portion, a wealth of criss-cross filaments and brightness enhancements, which partly originate in the crossing of two filaments. The brightest spot however, located at R.A. = 4h10m12.4s, Dec. = 04°59′03″ (2000), i.e. SE of the centre of the image, does not seem to be an outcome of such a projection. The apparent centre of the CCN, 11 away from this bright spot towards the NW direction, looks like a tiny horizontally extending rectangle with dimensions 021 and has a 2000.0 position R.A. = 4h10m08.2s, Dec. = 04°58′33″ ( = 1970, = 8).
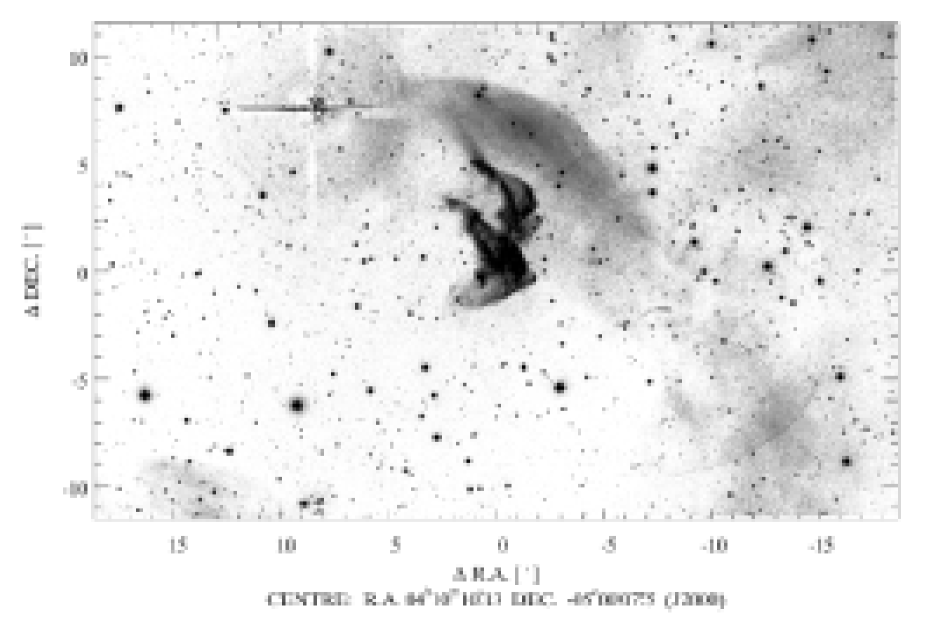
In Fig. 2 we present a wide-field image taken in the Schmidt mode of the 2 m telescope of the Thüringer Landessternwarte Tautenburg, centered on the CCN. The faint large (16′ in diameter) circle in the western part of the field as well as the smaller circles or disks plus the dark horizontal streak in the NE are residuals from removing bright stars and hence are artificial.
To the NW of the CCN, about 80″ apart, an extended broad arc with clear outer borders becomes visible. It appears to be a long portion of a circular structure with a diameter of 20′, but there are no traces of this arc visible in the W, SE or SW of the CCN. The centre of this circle would be located very close (1′), just outside, to the south-easternmost part of the CCN. The width of this arc-like structure is about 27. There is an extension of the northernmost filament of the CCN which seems to be connected to the eastern part of the arc, at least in projection.
The CCN interestingly displays very sharp borders in this deep wide-field image, particularly to the south and west, but shows - with exception of its northernmost filament - no particular additional emission outside the CCN compared to its extent on the POSS or on the NOT image. However, in the N and, especially, NW and W part of the field presented in Fig. 2, very faint nebulae are present: any connection to the CCN or the arc is not obvious, but cannot be ruled out. Using the whole field of view of 42′42′and very high contrast does not change this perception. A thorough inspection of a deep H image of the OEB (Figs. 2 and 3 in Boumis et al. (2001)) shows that the CCN is close to, but just outside, a faint H protrusion of their ’Arc A‘, the major arc of the complex filamentary nebulosity first discovered by Meaburn (1965, 1967). In our Fig. 2 the division of the CCN into two main components, a northern and a southern one, is quite evident and the large-scale direction of the northern parts of both components are approximately parallel to the arc.
4 Spectroscopy of the CCN and the arc
The 79 long and 21 wide slit was positioned in such a way to cross some filaments in the CCN and the extended emission feature (the arc) north of it, as well as to include some sky-background free of emission, as shown in Fig. 3. We used the [S ii] image, because it shows much better which parts of the inner structure of the CCN are covered by the slit, but the broad arc is only faintly visible.

The emission lines H, [N ii] 6548 and 6583, [S ii] 6716 and 6731 were detected in the regions of the CCN and - with exception of [S ii] 6731 - also in the broad arc, although in the latter region the forbidden emission lines are considerably weaker. We obtained emission-line ratios through Gaussian fitting of the aforementioned lines in 5 regions along the slit. The relevant values with the associated relative errors are given in Table 1 together with the extent of each region in arcsec along the slit. The region labelled ’5’ and largely also ’4’ identify the part of the extended region north of the CCN (i.e. the broad arc).
In Table 1 a striking difference between the [N ii]/H and the [S ii]/H ratio of the CCN and those of the broad arc is obvious and will be discussed below. This discrepancy prompted us to check whether it is of general nature or valid for a restricted area only. For this purpose we constructed an H/[S ii] image (not presented here). This image unambiguously shows that the discrepancy is present everywhere in the two nebulae. Only in the northernmost portion of the northern filament, which appears to be a link to the arc, there is a distinct gradient visible, smoothly varying from the high value of the CCN to the low one of the arc.
A high-dispersion long-slit spectrum would be quite useful to irrevocably identify the nature of the CCN, and is planned for follow-up observations of this object. However, the radial velocity information derived from our low-dispersion spectrum gives us already some important clues to the nature of the CCN and the northern arc. Radial velocities were obtained from the positional measurements of the emission-lines after splitting the spectrum in two parts, one including regions 1-3 and the other including regions 4-5. The wavelength calibration was based on the night-sky lines from 6250 to 6875 Å. The radial velocities of the two groups of regions are the same within the errors (estimated to be in the range 5-10 km s-1 by taking into account a slight dependence on the choice of the wavelength region for the calibration) and are close to zero. Average values are vLSR = 4.4 km s-1 and 1.4 km s-1 for the CCN and the arc, respectively. This is consistent with the two structures being inter-related local phenomena.
|
-
a
Lower limits to the S II 6716/S II 6731 ratio are provided assuming a 1 upper limit to the flux of the 6731 line, if the line is not detected.
5 Discussion
In all of the above-mentioned 5 regions the estimated ratio of the [S ii] emission lines indicates low electron densities, Ne 100 cm-3.
No proper motion, neither of localized nor general nature could be detected for the CCN, neither by comparing with the POSS (where the resolution however is poor) nor via a comparison of the NOT image (Nov. 1999) with an H + [S ii] Tautenburg image (Oct. 2005). In the case of the latter comparison an astrometric calibration on the basis of USNO2 was carried out. If there had been displacements of 3 NOT pixels (i.e. 056), we would have noted that. At the CCN’s distance of 150 pc, this corresponds to an upper velocity limit of 70 km s-1.
5.1 Arc and CCN: projection or connection?
The [N ii]/H as well as the [S ii]/H emission-line ratios gave us a surprise: they vary from values typical of shock-excited gas in the CCN filaments (regions 1 to 3) to values typical of photo-ionized gas in the arc (regions 5 and 4). This assertion can best be examined by using a diagnostic diagram, like the one presented in Fig. 7 of Garcia-Lario et al. (1991). There, the CCN falls in the area of SNRs and HH-objects, while the arc occupies a position within the borders of H ii regions. A closer look at the data in Table 1 furthermore reveals that both the [N ii]/H ratio and the [S ii]/H ratio have a gradient: the closer in projection to the arc, the lower the values. Nevertheless there is a sharp jump as soon as the northern border of the CNN has been passed.
Although both this gradient and the above-mentioned H/[S ii] image support a physical link between the CCN and the arc, we searched for a further proof for this connection. Taken alone, the arc could, in principle, represent the brightest portion of a shell filled with low-ionized gas, as frequently observed in highly evolved planetary nebulae or in H ii regions. Having in mind that the interstellar extinction is small or negligible in this direction (Zanin & Weinberger 1997), we examined on POSS red-sensitive and blue-sensitive copies the whole area of radius for any blue or bluish star. We found none. An H ii region can easily be excluded, since an object of this kind can hardly be farther away from us than a few kpc (note the Galactic coordinates of , ) and its ionizing source(s) would, even in the case of a B3V star ( = mag), be of quite high apparent brightness.
Highly evolved planetary nebulae (PNe) of this size, morphology, and spectral characteristics are, however, known. Examples are IW 1, S 176, and WDHS 1 (Tweedy & Kwitter 1996). The intrinsically largest have maximum linear diameters of a few pc. If we assume 3 pc as the maximum, a large PN would be located about 500 pc distant from us. The central stars of highly evolved PNe interestingly have closely similar absolute visual magnitudes: According to Phillips (2005) = 7.050.25 mag with an intrinsic scatter of order 0.5 mag. In the case of interstellar extinction = 0 mag, even at 500 pc the (strikingly) blue central star of such a PN would have an apparent magnitude between 15 and 16 mag in . To sum up, we may hence take it for granted that the CCN and the arc are in fact two parts of one object.
5.2 A shock-cloud interaction
Zanin & Weinberger (1997) suggested that the CCN is a small cloud being over-run by the slow moving SNR shock wave responsible for the OEB. We try to substantially add to this conclusion and its details below. The broad arc, recognized to belong to the CCN, will thereby be of importance, and we will show that rather the CCN is a part, better an appendage, of the arc - and not vice versa.
The above authors found the CCN to be projected onto the centre of the OEB H i shell, best seen by plotting the position of the CCN on the maps of H i emission in various velocity intervals in Fig. 8, particularly Fig. 8d, of Brown et al. (1995). The same figure also shows that one does not deal with an ideal spherical expanding shell, but with a set of filaments and loops. Hence, even looking at the projected centre of the shell, one must not expect that the approaching plane of the shock front is perpendicular to the line-of-sight. This made us think that the arc and its CCN come from an originally spherical (or ellipsoidal) cloud, over-run by a shock front which is oblique with respect to the line-of-sight.
By taking into account results of simulations from the literature (Stone & Norman 1992; Klein et al. 1994; Orlando et al. 2005; Byun et al. 2006; Poludnenko et al. 2002; Nakamura et al. 2006), we suspect that we deal with the following situation: The slow (about 40 km s-1) shock has first hit the (perhaps spherical) cloud on the side facing the OEB, has moved through it and swept over it, producing vortices and various other instabilities at the rear of the cloud. This means that the broad arc is nothing else that the still rather intact original forepart of the interstellar cloud and the CCN is the unscrewn rear of the cloud. In other words, the system arc + CCN is inclined to the line-of-sight, where the southern part of the CCN is closest to us, the northern one farther away, connected to the remnant of the cloud, which is now a kind of ’cap’, closest to the OEB.
A closer look at the results of published simulations and a comparison with our nebulae is very encouraging, since the arc + CCN can be found to be represented quite well by early to middle phases in shock-cloud interactions: We particularly refer to Fig. 6 in the experimental work of Klein et al. (2003) or to Fig. 6 in Poludnenko et al. (2002); the latter figure rather looks like a sketch of the arc + CCN - with a cap, a filamentary stream of gas heading away from the cap, a narrowing and then a widening of the filaments. In addition, recent simulations considering the realistic case of an interaction of a planar shock with a smooth boundary interstellar cloud (Nakamura et al. 2006) result in a density distribution of the shocked cloud at the early stages of its evolution (their Fig. 2, panels (c) and (d)) that closely resembles the observed structure of the system arc + CCN (although from a different viewing angle). At early phases of an interaction, the surviving (fore)part of the original cloud did not undergo substantial lateral expansion. Hence, we can estimate the true linear radius of the cloud, assuming spherical shape and a lateral expansion of, say, one third compared to the initial dimension.
The observed radius of 10′ corresponds, at D = 150 pc, to 0.44 pc, that is the original radius was 0.3 pc, and hence the volume of the spherical cloud was 3 1054 cm3. We assume uniform filling with (originally neutral) gas and further assume two densities, 90 cm-3 and 9 cm-3. We note that the ambient density around the OEB has been found to be rather high, 0.9 cm-3 by Brown et al. (1995). The higher of the two above densities accounts for the expected value of the density contrast between the cloud and the ambient intercloud medium, which is of the order 102 for cold atomic gas ( 102 K) embedded in either the warm neutral medium or the photo-ionized warm medium ( 104 K) (Klein et al. 2003). The lower of the two values however appears to be perhaps more realistic given the location away from the plane of the Galaxy and the very small size of the cloud (Nagashima et al. 2006). By assuming (as in Zanin & Weinberger 1997) a molecular weight 1.24, we then find a total mass for the original spherical cloud of 0.3 (or 0.03) for the two densities from above. Hence, the shock front of the OEB has been caught red-handed interacting with an interstellar cloud of considerably small size and mass.
Why is the arc photo-ionized, but the CCN shock-excited? We suggest that the arc, which actually seems to be a spherical cap, is exposed to ionizing photons from the hot gas filling large parts of the OEB and gas at intermediate temperatures, K, that exists between the hot bubble interior and the surrounding material (Kregenow et al. 2006). We also cannot exclude that there is some UV photon contribution from the Ori OB1 association. Anyway, the cap appears to act like a protective canopy or screen and is mildly permeable - note the gradient in Table 1. We believe that there must also some shock-excitation be present in this cap, but this is masked by the photo-ionization.
How long can the cloud survive? Practically all theoretical studies show that small isolated clouds will be destroyed after a few units of cloud crushing time. This is the timescale for the cloud to be crushed by the shocks moving into it and is defined (Klein et al. 2003) as = /, where in addition to , the cloud-intercloud density contrast, is the original radius of the cloud and is the velocity of the shock wave. Two of these parameters, and are rather well known, and we take both = 102 and = 10 from above. Then, for = 102, yr, and for = 10, yr. In the latter case, our preferred one, the cloud would hence be completely disrupted after about 105 years, a period which is short compared to the total age of the OEB of up to a few 106 years (Brown et al. 1995).
An alternative possibility to the scenario described above would be that the CCN is just an isolated old SNR in the vicinity of the OEB. However, we do not favour this alternative point of view because of the structure of the CCN/canopy system and because of its radial velocity, which indicates it is a local phenomenon, consistent with OEB being the cause for the features. Furthermore, as already noticed by Zanin & Weinberger (1997), no radio or X-ray sources have been detected at its location. Accurate velocity measurements based on a long-slit high-dispersion spectrum, not yet available to us, would allow to definitely discard (or otherwise accept) this alternative interpretation.
To sum up, the CCN and its cap appear to represent an example - unrivalled in closeness and clarity - for an early to medium stage in the destruction of an isolated cloud over-run by an evolved SNR and thus may deserve further study.
Acknowledgements.
The authors are grateful to F. di Mille for having carried out the spectroscopic observations at the Asiago Observatory. This work was supported by the Austrian Science Fund (FWF), projects P15316 and P17772.References
- Boumis et al. (2001) Boumis, P., Dickinson, C., Meaburn, J. et al. 2001, MNRAS, 320, 61
- Brown et al. (1995) Brown, A. G. A., Hartmann, D., & Burton, W. B. 1995, A&A, 300, 903
- Byun et al. (2006) Byun, D.-Y., Koo, B.-C., Tatematsu, K., & Sunada, K. 2006, ApJ, 637, 282
- Garcia-Lario et al. (1991) Garcia-Lario, P., Manchado, A., Riera, A., Mampaso, A., & Pottasch, S. R. 1991, A&A, 249, 223
- Guo et al. (1995) Guo, Z., Burrows, D. N., Sanders, W. T., Snowden, S. L., & Penprase, B. E. 1995, ApJ, 453, 256
- Heiles et al. (1999) Heiles, C., Haffner, L. M., & Reynolds, R. J. 1999, ASP Conf. Ser. 168: New Perspectives on the Interstellar Medium, 211
- Klein et al. (1994) Klein, R. I., McKee, C. F., & Colella, P. 1994, ApJ, 420, 213
- Klein et al. (2003) Klein, R. I., Budil, K. S., Perry, T. S., & Bach, D. R. 2003, ApJ, 583, 245
- Koo et al. (2006) Koo, B.-C., Kang, J.-H., & Salter, C. J. 2006, ApJ, 643, L49
- Kregenow et al. (2006) Kregenow, J., Edelstein, J., Korpela, E. J. et al. 2006, ApJ, 644, L167
- Landolt (1992) Landolt, A. U. 1992, AJ, 104, 340
- Mac Low & Klessen (2004) Mac Low, M.-M., & Klessen, R. S. 2004, Rev. Mod. Phys., 76, 125
- Meaburn (1965) Meaburn, J. 1965, Nature, 207, 179
- Meaburn (1967) Meaburn, J. 1967, Zeit f. Astr., 65, 93
- Nagashima et al. (2006) Nagashima, M., Inutsuka, S.-I., & Koyama, H. 2006, ApJ, 652, 41
- Nakamura et al. (2006) Nakamura, F., McKee, C. F., Klein, R. I., & Fisher, R. T. 2006, ApJS, 164, 477
- Orlando et al. (2005) Orlando, S., Peres, G., Reale, F., et al. 2005, A&A, 444, 505
- Patnaude & Fesen (2005) Patnaude, D. J., & Fesen, R. A. 2005, ApJ, 633, 240
- Phillips (2005) Phillips, J. P. 2005, MNRAS, 357, 619
- Poludnenko et al. (2002) Poludnenko, A. Y., Frank, A., & Blackman, E. G. 2002, ApJ, 576, 832
- Seibert et al. (2006) Seibert, M., et al. 2006, in preparation
- Stone & Norman (1992) Stone, J. M., & Norman, M. L. 1992, ApJ, 390, L17
- Tweedy & Kwitter (1996) Tweedy, R. W., & Kwitter, K. B. 1996, ApJS, 107, 255
- van Dokkum (2001) van Dokkum, P. G. 2001, PASP, 113, 1420
- Zanin & Weinberger (1997) Zanin, C., & Weinberger, R. 1997, A&A, 324, 1165