Cometary water expansion velocity from OH line shapes
Abstract
Aims. We retrieve the H2O expansion velocity in a number of comets, using the 18-cm line shapes of the OH radical observed with the Nançay radio telescope.
Methods. The H2O velocity is derived from the large base of a trapezium fitted to the observed spectra. This method, which was previously applied to 9 comets, is now extended to 30 further comets. This allows us to study the evolution of their water molecule outflow velocity over a large range of heliocentric distances and gas production rates.
Results. Our analysis confirms and extends previous analyses. The retrieved expansion velocities increases with increasing gas production rates and decreasing heliocentric distances. Heuristic laws are proposed, which could be used for the interpretation of observations of cometary molecules and as a touchstone for hydrodynamical models. The expansion velocities retrieved from 18 cm line shapes are larger than those obtained from millimetric observations of parent molecules with smaller fields of view, which demonstrates the acceleration of the gas with cometocentric distance. Our results are in reasonable quantitative agreement with current hydrodynamical models of cometary atmospheres.
Key Words.:
Comets: general – line: profiles – molecular processes – radio lines: Solar System1 Introduction
Due to the small gravity field of cometary nuclei, cometary atmospheres are not captive and expand freely in the interplanetary medium. The expansion velocity of the atmosphere is a parameter of crucial importance for the interpretation of cometary observations and the modelling of cometary phenomena. This velocity is not constant; it is governed by the sublimation mechanism, photolytic heating of the coma and collisions, so that case-by-case studies are in principle necessary. It is suspected to depend basically upon the heliocentric distance, which governs photolytic heating, and the gas production rate, which governs collisions (e.g., Bockelée-Morvan & Crovisier 1987; Combi et al. 2005). Heuristic laws have been proposed, but they need to be checked and validated by hydrodynamical models and direct measurements.
One of the best methods to determine this expansion velocity is the observation of the shapes of molecular lines at radio wavelength, taking benefit of the high spectral resolution of such observation. These lines, when optically thin (which is practically the case for all species except water), have purely Doppler profiles. Therefore, they directly trace the velocity distribution over the line of sight. This has been applied to the millimetric and submillimetric lines of molecules, such as HCN, CO, CH3OH, H2S, directly sublimated from nucleus ices (e.g., Despois et al. 1986; Schloerb et al. 1987; Biver et al. 2002).
One can also use the OH lines at 18 cm, for which an important cometary database now exists. However, OH is a secondary species, coming from the photodissociation of water. At photodissociation, the OH radical is given an ejection velocity km s-1 (Crovisier 1989). The kinematics and the space distribution of the OH radical must be evaluated in the frame of a vectorial model (Combi & Delsemme 1980; Festou 1981).
First attempts to deconvolve the OH line profiles in order to retrieve the expansion velocity of the OH-parent used Monte Carlo simulations (Bockelée-Morvan & Gérard 1984; Tacconi-Garman et al. 1990). Another approach, proposed by Bockelée-Morvan et al. (1990, hereafter Paper I), derived the H2O velocity from the large base of a trapezium fitted to the observed 18-cm line shapes of the OH radical. This method, which is much more rapid than Monte Carlo simulations, was applied to 9 comets observed with the Nançay radio telescope and checked over the Monte Carlo method in specific cases.
In the present paper, we extend this work to 30 further comets recently observed at Nançay, including C/1995 O1 (Hale-Bopp) which was observed up to more than 4 AU from the Sun, and several comets which were observed close ( AU) to the Sun. This allows us to study the evolution of their water molecule outflow velocity over a wide range of heliocentric distances and gas production rates.
Section 2 presents the database and the method of analysis. Section 3 presents the results and the correlation between the gas expansion velocity, the heliocentric distance and the gas production rate. In Section 4, these results are discussed in the frame of hydrodynamical models of cometary atmospheres and are compared with other determinations of cometary expansion velocities. Section 5 concludes. Further details on this work are given in Tseng (2004).
| Comet | ref. | |
|---|---|---|
| C/1982 M1 Austin | a) | |
| C/1984 N1 Austin | a) | |
| 21P/Giacobini-Zinner (1985) | a) | |
| C/1985 R1 Hartley-Good | a) | |
| C/1985 T1 Thiele | a) | |
| 1P/1982 U1 Halley | a) | |
| C/1986 V1 Sorrells | a) | |
| C/1986 P1 Wilson | a) | |
| C/1987 P1 Bradfield | a) | |
| C/1990 K1 Levy | b) | |
| 109P/1992 S2 Swift-Tuttle | c) | |
| C/1988 A1 Liller | d) | |
| 23P/1989 N1 Brorsen-Metcalf | d) | |
| C/1989 Q1 Okazaki-Levy-Rudenko | d) | |
| C/1989 W1 Aarseth-Brewington | d) | |
| C/1989 X1 Austin | d) | |
| C/1991 Y1 Zanotta-Brewington | d) | |
| C/1991 T2 Shoemaker-Levy | d) | |
| 24P/Schaumasse (1993) | d) | |
| C/1993 Y1 McNaught-Russell | d) | |
| 19P/Borrelly (1994, 2001) | d) | |
| 45P/Honda-Mrkos-Pajdušáková (1996) | d) | |
| C/1996 B2 Hyakutake | d) | |
| 22P/Kopff (1996) | d) | |
| C/1996 Q1 Tabur | d) | |
| C/1995 O1 Hale-Bopp | d) | |
| C/1998 J1 SOHO | d) | |
| 21P/Giacobini-Zinner (1998) | d) | |
| C/1999 H1 Lee | d) | |
| C/1999 N2 Lynn | d) | |
| C/1999 T1 McNaught-Hartley | d) | |
| C/2000 W1 Utsunomiya-Jones | d) | |
| C/2001 A2 LINEAR | d) | |
| C/2000 WM1 LINEAR | d) | |
| 153P/2002 C1 Ikeya-Zhang | d) | |
| C/2002 F1 Utsunomiya | d) | |
| C/2002 V1 NEAT | d) | |
| C/2002 X5 Kudo-Fujikawa | d) | |
| C/2002 Y1 Juels-Holvorcem | d) |


2 Analysis
The database of OH observations of comets at Nançay up to 1999 is
described in Crovisier et al. (2002a)111See also
http://www.lesia.obspm.fr/planeto/cometes/basecom/. In
1995–2000, the Nançay radio telescope was upgraded
(van Driel et al. 1996), resulting in improved performances of the
instrumentation (the sensitivity was improved by a factor
and a more versatile spectrometer was installed). Cometary
observations after this upgrade are described by Crovisier et al. (2002b, and in
preparation). At 18 cm wavelength, the Nançay
radio telescope has an elliptical field of view of , which corresponds to km at AU and is equivalent to a circular field
of view of radius km.
As explained in Paper I, a symmetric trapezium is fitted to the OH line. The large base of the trapezium is assumed to be , where is the water expansion velocity and is the OH ejection velocity upon water photodissociation. As discussed in Paper I, we assume km s-1, which is close to the theoretical value of 1.05 km s-1 (Crovisier 1989). Hence the evaluation of . An example of OH spectra with their fitted trapezia is shown in Fig. 1.
As in Paper I, the OH production rates are derived using the OH inversion curve of Despois et al. (1981) and the quenching law and OH parameters of Gérard (1990). The model is fully described in Crovisier et al. (2002a, Table 3, last column). The model consistently uses the parent velocity derived from the trapezium fit to compute the OH production rate; therefore, the production rates of the present analysis may differ somewhat from those published by Crovisier et al. (2002a) which were computed assuming km s-1.
The list of comets investigated in the present study is given in Table 1. The analysis is performed on spectra integrated over several days for which the signal-to-noise ratio is sufficient (typically ). The total number of samples is 190. A comprehensive tabulation of the data may be found in Tseng (2004).
As an example, the expansion velocity as a function of heliocentric distance is shown in Fig. 2 for C/1995 O1 (Hale-Bopp), for which the OH lines could be observed over a large range of . The fitted power law is
| (1) |
to be compared to
| (2) |
for the velocities derived from the millimetric molecular lines (Biver et al. 2002) which were observed in a smaller field of view (see discussion in Section 4). One must note that in the range AU which is investigated here, varied by about three orders of magnitude, so that the strong variation on implicitly includes a dependence on both and .


| range | power-law fit |
|---|---|
| [s-1] | [ in units of AU] |
| – | |
| – | |
| range | power-law fit |
| [AU] | [ in units of s-1] |
| 0.3 – 0.6 | |
| 0.6 – 0.9 | |
| 0.9 – 1.1 | |
| 1.1 – 1.3 | |
| 1.3 – 1.5 |
3 Results
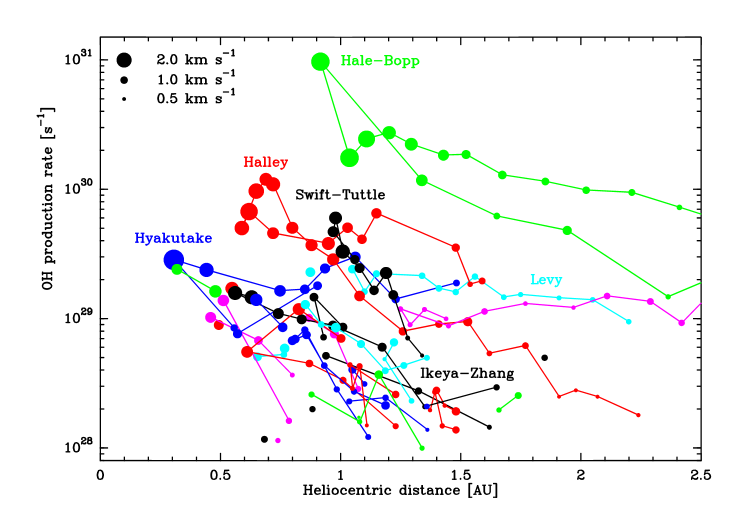
From the profiles of the 18-cm OH lines, we have investigated the expansion velocity of cometary atmospheres for heliocentric distances ranging from 0.3 to 4.6 AU and OH production rates from to s-1. Confirming the results of Paper I, is found to consistently increase with increasing and with decreasing , as expected qualitatively from hydrodynamical models (Combi et al. 2005 and references therein). The observed ’s range from 0.5 to 2.5 km s-1.
An overview of the correlation between retrieved water expansion velocities, heliocentric distances and OH production rates is shown in Fig. 3 (an update of Fig. 14 in Paper I). In order to investigate separately the dependence of to and , we have divided the data into various subsamples. Power laws fitted to the different subsamples are listed in Table 2 and shown in Figs 4–5.
From these plots, we can see the existence of a threshold effect: the expansion velocities are km s-1, insensitive to the heliocentric distances from 1.5 to 5.0 AU for moderately active comets with OH production rates from a few s-1 to a few s-1. The expansion velocities strongly depend on the heliocentric distance for 1.5 AU.
Errors reported in Table 2 are the 1– formal errors resulting from the fits to the data. They do not include possible systematic errors due to shortcomings in the modelling. Given the limited number of data, their arbitrary binning, and possible systematic effects, we do not think that the differences of the exponent of the power law , in the upper part of Table 2, are firmly established. The same for the exponent of in the lower part of the table. and are probably the values to be retained.
Taking a step further, we tried to fit a combined power law to our data. A unique law could not be obtained for the whole domain covered by the observations. The results are shown in Table 3. For 2 AU, barely depends upon and as already discussed. The dependence with is over the range 0.3–2 AU, as inferred from power-law fits over restricted ranges of (Table 2). Between 0.3 and 1 AU, the dependence is in , but the data suggest a steeper heliocentric dependence in between 1 and 2 AU. Power-law fits in the subsamples [ s-1 ; AU] and [ s-1 ; AU] are similar ( ), which suggests that the difference in heliocentric evolution between 1 AU and 1 AU could be a characteristics of behaviour. Note, however, that there is significant dispersion between the data and the fitted curves (reduced between 2 and 3, see Table 3).
4 Discussion
The empirical laws derived from non-linear fits and listed in Table 2 can be used as a touchstone for hydrodynamical models of cometary atmospheres. They can also help us to analyse cometary observations, and especially to derive more reliable OH production rates from the 18-cm observations, when the signal-to-noise ratio is not sufficient to apply the trapezium method to the line shapes.
These results, however, should only be used for the range of parameters (, ) pertaining to the data analysed in the present work. In particular, we caution the reader against extrapolating the laws of Table 2 to distant comets. At large ’s, cometary activity is governed by the sublimation of CO and other hypervolatile species rather than that of water, resulting in quite different temperatures and velocities at the nucleus surface (Ip 1983).
The top part of Table 2 shows that, for a restricted range of , the heliocentric dependence is close to the law
| (3) |
which was proposed sometime (e.g., Cochran & Schleicher 1993; Budzien et al. 1994). But the dependence upon cannot be ignored. Cochran & Schleicher (1993) proposed the law
| (4) |
for AU from the results of Paper I, where is in units of s-1. This law appears to be a poor fit to our data.
| range | range | combined power-law fit | reduced |
|---|---|---|---|
| [AU] | [s-1] | [ in units of 1029 s-1] | |
| 2.0 | |||
| 3.3 | |||
| 2.0 |
Interestingly, photochemical heating is more sensitive to the heliocentric distance than to the water production rate. The heating rate is directly proportional to (through the water photodissociation rate), but is weighted by the efficiency of the thermalization process of fast hydrogens. The size of the region where the efficiency is significant scales proportionally to the water production rate (e.g., Ip 1983; Bockelée-Morvan & Crovisier 1987). Though other processes, such as radiative cooling, do affect the hydrodynamics of the coma, the steeper dependency (compared to variation) observed in our data is consistent with photolytic heating being the main process controlling the gas velocity in the outer coma. The different heliocentric variations in the 0.3–1 AU and 1–2 AU domains remain to be explained.
We will now compare our results with other observations and with model predictions. For this prospect, we have to take into account the effect of the field of view and of the geocentric distance .
The expansion velocity of a cometary atmosphere is not a well defined parameter. In the inner, collisional coma where classical hydrodynamics prevails, this velocity is progressively increasing with distance to the nucleus, as a result of photolytic heating (Combi et al. 2005). In the outer coma where the free-molecular flow is governed by rarefied gas dynamics, the velocity distribution is not maxwellian.
The observed line shapes are averages of all molecules present in the instrumental field of view. In the following, we will assume that the observed is representative of molecules at a distance equal to the field-of-view radius. This assumption is justified by Monte Carlo simulations of the HCN line shape (Paper I, Fig. 15). Alternatively, the field of view radius for 18-cm observations may be larger than the water scale length for photodissociation (typically km at 1 AU). In this case, we may wish to adopt . This must be considered as an approximation.
We note that one would also expect that for very small fields of view, the collisional region is sampled, in which OH is thermalized and partakes the kinetics of water. Then the trapezium model would fail. An extreme observational case was that of comet C/1996 B2 (Hyakutake), which was observed at AU, AU, with s-1. We retrieved km s-1, right in the range of the laws of Table 2. Quite recently, we observed 73P/Schwassmann-Wachmann 3 at AU only, with AU and s-1; the retrieved (0.8 km s-1) was also normal (Crovisier et al., in preparation; these observations are not in the database analysed in the present work). This suggests that for both observations, the field of view was still not small enough for a significant thermalization of the OH radicals, or that this thermalization also quenched the OH maser, so that the 18 cm observations are insensitive to such OH radicals.
Complementary data are provided by millimetric and submillimetric observations of line shapes of parent molecules. is then close to the line half-width at half maximum (Biver et al. 2002 adopt for 90% of the half-width, to account for thermal broadening). Data for several molecules (especially HCN, CO, CH3OH and H2S) are now available for many comets (e.g., observations at IRAM, SEST, JCMT and CSO; Biver et al. 1999, 2000, 2002, 2006). Direct observations of the water line at 557 GHz from space with the SWAS and Odin satellites also exist (Neufeld et al. 2000; Lecacheux et al. 2003), but their kinematic interpretation is hampered by the saturation of this strong line.
The typical angular field-of-view diameter for millimetric observations with the IRAM 30-m telescope is at a frequency of 145 GHz, corresponding to a linear radius km at a geocentric distance AU. This is much smaller than the elliptical field of view of the Nançay radio telescope (equivalent to a radius of 178 000 km).

As previously noted in, e.g., Paper I, the determined from parent molecules observed at millimetric wavelengths are systematically smaller than those obtained from OH line shapes, with larger fields of view. This effect is shown in Fig. 6. Observations of comets 1P/Halley, C/1996 B2 (Hyakutake), C/1995 O1 (Hale-Bopp), C/1999 H1 (Lee) and 153P/2002 C1 (Ikeya-Zhang) were selected at various ’s, chosen so that the gas production rates were similar ( in the range 1–4 s-1). Points on the right are determined from the present work. Points on the left are measurements from millimetric observations (Biver et al. 1999, 2000, 2002, 2006). For comet Halley, the various points from left to right are from in situ measurements (Giotto, Lämmerzahl et al. 1987), HCN (IRAM, Despois et al. 1986), HCN (FCRAO, Schloerb et al. 1987) and OH (Nançay, present work). As discussed above, is evaluated as the field-of-view radius. For all comets, an increase of with is observed. This increase is much more important for comets close to the Sun (e.g., 153P/2002 C1 (Ikeya-Zhang) at AU) than for distant comets (e.g., C/1995 O1 (Hale-Bopp) at 3 AU). This clearly demonstrates the acceleration of the gas with cometocentric distance, attributed to photolytic heating.
Direct imaging of near-UV OH emission was made by Harris et al. (2002) in comet C/1995 O1 (Hale-Bopp). From their analysis, km s-1 was retrieved for s-1 for cometocentric distances km. This agrees well with our measurement (2.4 km s-1).

In order to achieve a quantitative comparison of these results with models, we have plotted in Fig. 7 the predictions of the hybrid kinetic/dusty gas hydrodynamical model of Combi et al. (1999) for comet C/1995 O1 (Hale-Bopp). as a function of cometocentric distance is plotted for five heliocentric distances (1.0, 1.5, 2.0, 2.5 and 3.0 AU, all pre-perihelion) and the corresponding observed water production rates (80, 20, 14, 4 and s-1, respectively, according to Combi et al.). Observational determinations of , from the present work (points on the right) and from the millimetric observations of Biver et al. (2002) (points on the left), have been superimposed. For all these points, the cometocentric distances are again those corresponding to the field-of-view radii. We can see that the model predictions lead to somewhat overestimated velocities. Otherwise, the variation of with and (and the related ) is remarkably well reproduced by the model. The discrepancy between model and observations may be attributed to:
- •
-
•
the difficulty to model the transitional region between hydrodynamical flow and free-molecular flow (sophisticated Monte Carlo simulations are required; cf. Hodges 1990);
-
•
an inaccurate estimation of the cometocentric distance to which the measured pertains (see discussion above);
-
•
the presence of anisotropic outgassing, whereas models assume spherical symmetry.
Finally, we note that, as already discussed in Paper I, there are some observations, especially for distant, weak comets, leading to small values of (0.5–0.6 km s-1) that can difficultly be reconciled with hydrodynamical models.
5 Conclusion
We have extended the previous analysis of OH 18-cm line shapes from the Nançay database (paper I) from 9 to 39 comets with the following results:
-
•
This analysis confirms the increase of the coma expansion velocity with increasing gas production rate and decreasing heliocentric distance .
- •
-
•
The present results, compared to analyses of line shapes of parent molecules observed at millimetric wavelengths, yield significantly larger ’s. This may be attributed to the much larger field of view of the 18-cm observations. The two sets of data are complementary. The increase of with the field of view demonstrates the acceleration of cometary gas with cometocentric distance.
-
•
A threshold effect is observed: comets with small gas production rates (typically a few s-1) have similar expansion velocities (typically km s-1). Gas acceleration is inefficient for such weak comets.
-
•
Our results are in reasonable agreement with current hydrodynamical models of cometary atmospheres. Small discrepancies may be attributed to modelling issues such as inadequate treatment of the cooling/heating processes, or of the transitional region between hydrodynamical flow and free-molecular flow.
Acknowledgements.
This work was done while W.-L. T. was guest of Observatoire de Paris. Part of her work was supported by NSC grant 94-2111-M-008-033 and Ministry of Education under the Aim for Top University Program NCU. The Nançay Radio Observatory is the Unité scientifique de Nançay of the Observatoire de Paris, associated as Unité de service et de recherche (USR) No B704 to the French Centre national de la recherche scientifique (CNRS). Its upgrade was financed jointly by the Conseil régional of the Région Centre in France, the CNRS and the Observatoire de Paris.References
- Biver et al. (2002) Biver, N., Bockelée-Morvan, D., Colom, P., et al. 2002, Earth Moon and Planets, 90, 5
- Biver et al. (1999) Biver, N., Bockelée-Morvan, D., Crovisier, J., et al. 1999, AJ, 118, 1850
- Biver et al. (2000) Biver, N., Bockelée-Morvan, D., Crovisier, J., et al. 2000, AJ, 120, 1554
- Biver et al. (2006) Biver, N., Bockelée-Morvan, D., Crovisier, J., et al. 2006, A&A, 449, 1255
- Bockelée-Morvan et al. (1992) Bockelée-Morvan, D., Colom, P., Crovisier, J., Gérard, E., & Bourgois, G. 1992, in Asteroids, Comets, Meteors 1991, 73–76
- Bockelée-Morvan & Crovisier (1987) Bockelée-Morvan, D. & Crovisier, J. 1987, in ESA SP-278: Diversity and Similarity of Comets, ed. E. J. Rolfe & B. Battrick, 235–240
- Bockelée-Morvan et al. (1990) Bockelée-Morvan, D., Crovisier, J., & Gérard, E. 1990, A&A, 238, 382
- Bockelée-Morvan & Gérard (1984) Bockelée-Morvan, D. & Gérard, E. 1984, A&A, 131, 111
- Bockelée-Morvan et al. (1994) Bockelée-Morvan, D., Padman, R., Davies, J. K., & Crovisier, J. 1994, Planet. Space Sci., 42, 655
- Budzien et al. (1994) Budzien, S. A., Festou, M. C., & Feldman, P. D. 1994, Icarus, 107, 164
- Cochran & Schleicher (1993) Cochran, A. L. & Schleicher, D. G. 1993, Icarus, 105, 235
- Combi & Delsemme (1980) Combi, M. R. & Delsemme, A. H. 1980, ApJ, 237, 633
- Combi et al. (2005) Combi, M. R., Harris, W. M., & Smyth, W. H. 2005, in Comets II, ed. M. C. Festou, H. U. Keller, & H. A. Weaver (Univ. Arizona Press), 523–552
- Combi et al. (1999) Combi, M. R., Kabin, K., Dezeeuw, D. L., Gombosi, T. I., & Powell, K. G. 1999, Earth Moon and Planets, 79, 275
- Crovisier (1989) Crovisier, J. 1989, A&A, 213, 459
- Crovisier et al. (2002a) Crovisier, J., Colom, P., Gérard, E., Bockelée-Morvan, D., & Bourgois, G. 2002a, A&A, 393, 1053
- Crovisier et al. (2002b) Crovisier, J., Colom, P., Gérard, E., et al. 2002b, in ESA SP-500: Asteroids, Comets, and Meteors: ACM 2002, 685–688
- Despois et al. (1986) Despois, D., Crovisier, J., Bockelée-Morvan, D., Gérard, E., & Schraml, J. 1986, A&A, 160, L11
- Despois et al. (1981) Despois, D., Gérard, E., Crovisier, J., & Kazès, I. 1981, A&A, 99, 320
- Festou (1981) Festou, M. C. 1981, A&A, 95, 69
- Gérard (1990) Gérard, E. 1990, A&A, 230, 489
- Harris et al. (2002) Harris, W. M., Scherb, F., Mierkiewicz, E., Oliversen, R., & Morgenthaler, J. 2002, ApJ, 578, 996
- Hodges (1990) Hodges, R. R. 1990, Icarus, 83, 410
- Ip (1983) Ip, W.-H. 1983, ApJ, 264, 726
- Lämmerzahl et al. (1987) Lämmerzahl, P., Krankowsky, D., Hodges, R. R., et al. 1987, A&A, 187, 169
- Lecacheux et al. (2003) Lecacheux, A., Biver, N., Crovisier, J., et al. 2003, A&A, 402, L55
- Neufeld et al. (2000) Neufeld, D. A., Stauffer, J. R., Bergin, E. A., et al. 2000, ApJ, 539, L151
- Schloerb et al. (1987) Schloerb, F. P., Kinzel, W. M., Swade, D. A., & Irvine, W. M. 1987, A&A, 187, 475
- Tacconi-Garman et al. (1990) Tacconi-Garman, L. E., Schloerb, F. P., & Claussen, M. J. 1990, ApJ, 364, 672
- Tseng (2004) Tseng, W.-L. 2004, Cometary water expansion velocity from OH line shapes, Tech. rep., Nançay radio telescope
- van Driel et al. (1996) van Driel, W., Pezzani, J., & Gérard, E. 1996, in High-Sensitivity Radio Astronomy, ed. N. Jackson & R. J. Davis (Cambridge Univ. Press), 229–232