Very Massive Galaxies: A Challenge For Hierarchical Models?
Abstract
Hierarchical models of galaxy formation now provide a much closer match to observations than they did a few years ago. The progress has been achieved by adjusting the description of baryonic processes such as star formation and supernova/AGN feedback, while leaving the evolution of the underlying dark matter (DM) halos the same. Being most results very sensitive to the input baryonic physics, the ultimate vindication of the hierarchical paradigm should come from observational tests probing more directly the merging history of DM halos rather than the history of star formation. Two questions may start addressing this deeper level: is the predicted halo merging rate consistent with the observed galaxy merging rate? and, are predicted and observed evolution of the galaxy mass function consistent with each other? The current status of these issues is briefly reviewed.
INAF – Osservatorio Astronomico di Padova, Italy
1. Introduction
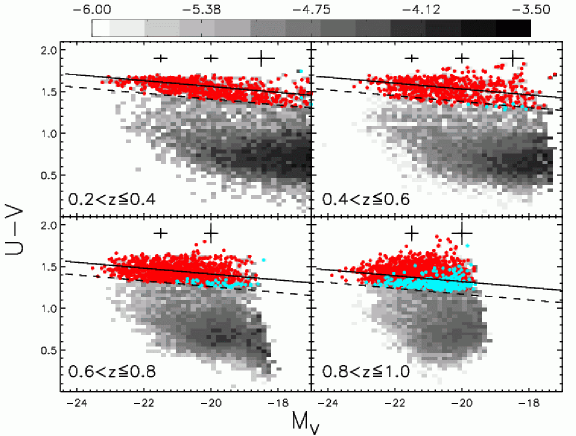
The organizers of this meeting have asked me to review the current status of the intercomparison of observations and theory of galaxy formation and evolution, specifically for the massive galaxies. This is not an easy task, as both observations and theory are progressing at a virtually daily rate, and what is perceived as a major discrepancy today may soon disappear. Indeed, pressed by major advancements in mapping galaxy populations at low and high redshifts, theoretical models of galaxy formation have evolved dramatically in the last few years. By and large, models are now in far better agreement with observations that were just a few years ago, especially concerning the evolution of massive, passively evolving galaxies. Until recently most models failed to produce such early type galaxies (ETG) in the observed number virtually at all redshifts, primarily because star formation was continuously fed by cooling flows in massive dark-matter halos (e.g. Somerville 2004). As a result, models did not reproduce the color bimodality in galaxy color-magnitude diagrams so evident at (e.g., Baldry et al. 2004), as well as all the way to , as illustrated here in Fig. 1 (from Scarlata et al. 2007).
On the other hand, it was understood since a long time that cooling flows could not be ubiquitous among local ETGs, otherwise such galaxies would have been ten or more times brighter in X-Rays than they typically are (Ciotti et al. 1991). Suppression of stationary cooling flows was then achieved by invoking feedback from a central supermassive black hole, and physical models of such AGB feedback were attempted (Ciotti & Ostriker 1997, 2001). Moreover, evidence for the bulk of stars in ETGs having formed at very high redshifts was available since at least the early ’nineties (cf. Renzini 2006, for a recent review). To match these constraints, models have been tuned to promote more star formation at early cosmic times, and to suppress it in massive halos not too much after the bulk of stars had formed.
The first goal was achieved by adding a starburst mode of star formation to the quiescent one, i.e., by assuming that a fraction of the gas in merging galaxies is instantly turned into stars (e.g., Kauffmann & Haehnelt 2000; Somerville, Primack, & Faber 2001). For the second goal, supernova feedback was adjusted to higher values, and when not enough star formation was suppressed altogether attributing such effect to AGN feedback, as first incorporated into semi-analytical models by Granato et al. (2001). AGN feedback is now included in most galaxy formation models, although one should be aware that no physical modeling of the process is actually attempted. In practice, star formation is discontinued when appropriate to reproduce pertinent observations, and the suppression is attributed to AGN feedback.
As a result of these improvements, models are now in far better agreement with observations than they used to be. However, the lesson to be drawn from this progress is that the physics of the baryonic component of the universe is so complex, that the theoretical description of its manifold behaviors (star formation, supernova feedback, black hole formation and growth, AGN feedback, etc.) necessarily relies on schematic recipes and numerous adjustable parameters. Thus, empirical star formation histories don’t really give us a test that models could not be forced to match. Therefore, the question is whether there is a more fundamental test, an ultimate vindication for the hierarchical CDM paradigm of galaxy formation.
Contrary to baryonic physics, the growth of dark matter halos from the initial perturbations is governed by much simpler physics, and the merging history of such halos can be reliably predicted by modern N-body simulations (e.g., Springel, Frenk & White 2006). Hence, the Mass Assembly of galaxies may provide the more fundamental test of the CDM paradigm that we are looking for, as it is more directly related to the merging history of DM halos.
2. The rate of (dry) merging among massive galaxies
Major merging events, and especially ETG-ETG dry mergers at , have been proposed to be responsible for the mass assembly of ETGs to their final size (e.g., Bell et al. 2004: Faber et al. 2005). Therefore, the direct estimate of the rate of (dry) merging events is potentially able to check this suggestion, and perhaps even to provide a test for the CDM paradigm itself. So, do empirical merging rates among the most massive galaxies support this suggestion, and how do they compare with models?
There have been several recent attempts at estimating this rate, both in the nearby universe and all the way to redshift . The main conclusion of these studies is synthetically reported here:
“less than 9% of massive ETGs experienced a major merger since ”
(DEEP2, Lin et al. 2004)
“ of ETGs had a merger with a mass ratio since ”
(van Dokkum 2005)
“Each ETGs has undergone 0.5-1 major dry mergers since ”
(COMBO-17, Bell et al. 2006a)
“ of had a major dry merger since ”
(COMBO-17, Bell et al. 2006b)
“less than 1% probability of a dry merger per Gyr at ”
(SDSS, Masjedi et al. 2006).
While the different merger definitions and redshift intervals complicate the intercomparison, these derived merging rates differ too much for all being consistent with one another. Arguing whether some of these estimates are more reliable than others goes beyond the scope of this review. Suffice here to point out that major discrepancies exist among the most recent estimates of the merging rate, hence they do not provide yet a clear cut test for the CDM paradigm.
3. The Galaxy Mass Function From to
An alternative way to check for the mass assembly of galaxies is to look to the evolution with redshift of their mass function, or of its proxy, the luminosity function. Within the hierarchical paradigm the most massive galaxies are the last to be fully assembled, and their number is predicted to keep increasing with time all the way to the present. We all certainly agree that the most massive galaxies must have originated from the highest primordial overdensities, hence having been the first to start forming stars. If a mechanism exists such that the more massive a galaxy the sooner star formation is quenched, then the more massive a galaxy the older its stellar content, and downsizing follows “naturally”, as indicated by the observations (again, cf. Renzini 2006, for an extensive review.) However, along with downsizing in star formation, the continuous merging of dark matter halos should result in an upsizing in mass assembly, with the most massive galaxies being the last to be fully assembled.
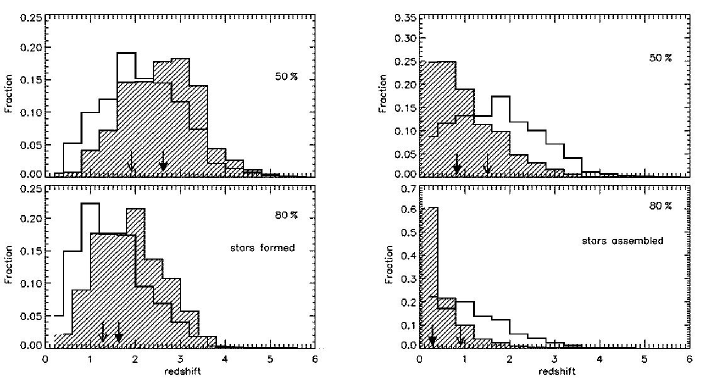
These trends are illustrated by the result of recent semi-analytical models shown in Fig. 2 (from De Lucia et al. 2006), where indeed downsizing in star formation and upsizing in mass assembly are clearly apparent. Now, while there is direct evidence for downsizing in star formation, at low as well as high redshift, do we have observational evidence also for upsizing in mass assembly? Here the situation is less clear cut. Fig. 3 (From Cimatti et al. 2006) shows that the number density of ETGs with stellar mass in excess of stays nearly constant up to and starts decreasing only at higher redshifts. On the contrary, the number density of less massive ETGs declines steadily with redshift, from onward. Cimatti et al. argued that in the hierarchical models shown in Fig. 2 the most massive ETGs are the most rapidly declining component, contrary to empirical evidence. Shall we conclude that Fig. 3 provides evidence against the upsizing predicted by the hierarchical merging paradigm? Such a conclusion may be premature. Indeed, also shown in Fig. 3 are the predictions from another rendition of the paradigm (Menci et al. 2006, supplemented by private communication), where the number density of the most massive ETGs does stay constant all the way to , in nice agreement with the observations. The baryonic recipes differ somewhat between the two sets of models, and it remains to be understood which specific ingredient is responsible for the different predictions.
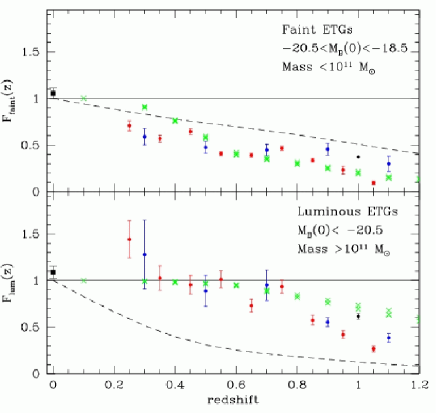

One may argue that limiting the test to ETGs may introduce a bias, as in some simulations the massive galaxies may be fully assembled at , but their star formation has not been quenched in time to qualify them as ETGs. On the observational side, even very modest amounts of ongoing star formation can suffice to disqualify a galaxy from listing in morphological or photometric samples of ETG. On the theoretical side, no strong prediction can be made about modest residual star formation within massive DM halos. Note, however, that virtually all most massive galaxies ( few ) are passive ETGs all the way to , as apparent from Fig. 1, and their number density has not appreciably changed since (e.g. Bundy et al. 2006; Borch et al. 2006). Thus, Cimatti et al. also argued that if the number density of the most massive ETGs is constant up to , then very little room is left for dry merging playing a major role in the build-up of massive ETGs in the corresponding interval of cosmic time. A similar conclusion is indeed reached by Scarlata et al. (2007) for galaxies in the COSMOS field, as illustrated here in Fig. 4.
In any event, the total stellar mass of a galaxy is somewhat more fundamental than either its morphology or color, and should be a more robust prediction of the models. Hence, looking at the evolution of the mass function may offer a chance to submit the models to a deeper scrutiny. Still, the mass functions from different renditions of the CDM paradigm, once tuned to match low redshift observables used to diverge dramatically beyond redshift (e.g., Fontana et al. 2004), due just to different assumption concerning the baryonic physics.
In a recent attempts at tracing the evolution of the mass function of galaxies all the way to , broad agreement with the results of several semi-analytic as well as hydrodynamical models was instead found (Fontana et al. 2006), which illustrates the great progress on the theoretical side that has been achieved in the last two years. Yet, not all problems may have been solved.
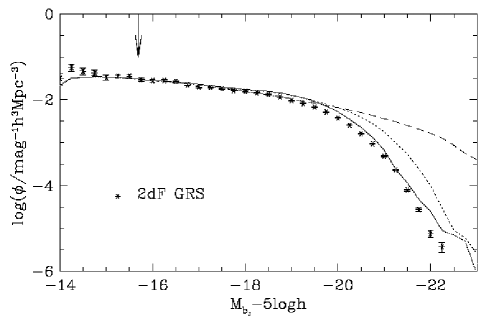
Here I will focus on three recent theoretical contributions, where subtle differences with respect to observations may guide us towards the fundamental test we are looking for. Earlier generations of models suffered from an extreme overproduction of massive galaxies at coupled with an extremely rapid disappearance of them with increasing redshift (e.g. Baugh et al. 2003, see their Fig. 4), at dramatic variance with observations. The progress made in the meantime is here illustrated in Fig. 5, from Bower et al. (2006), and resulting from an update of the same semi-analytic code used by Baugh et al. (2003). Suppressing star formation in massive halos, attributed to AGN feedback, has a dramatic effect at the top end of the luminosity function (LF), thus cutting the previous overproduction of massive galaxies by , while the same model gives a reasonable fit to the observed LF up to . Still, a sizable excess is noticeable at the top end of the -band LF at , which is finally adjusted by assuming internal dust obscuration in the model galaxies. As well know, the top end of the LF is dominated by passively-evolving galaxies all the way to (cf. Fig. 1), for which internal extinction must be very low. Hence, this model may still somewhat overproduce massive galaxies at low redshifts.
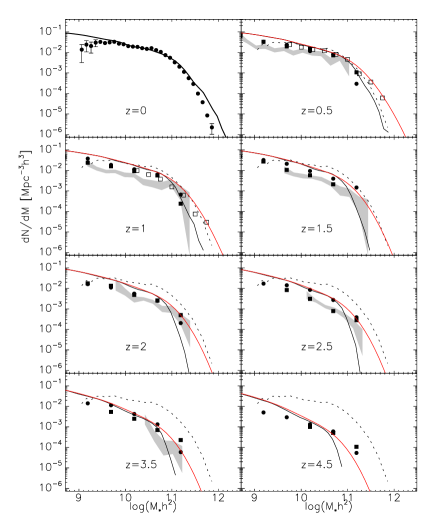
A relatively modest overproduction of massive galaxies at is also apparent in a recent incarnation of the Millennium Simulation (Kitzbichler & White 2006), here shown in Fig. 6. Besides, the model tend to underproduce massive galaxies at higher and higher redshifts, compared to the observed mass functions taken at face value. Observations are then brought to agreement with the models by convolving the theoretical mass function with an assumed random error in empirical mass determinations. Given the very steep slope at high masses, random errors have a fairly appreciable effect at the top end, while having very little effect further down in the mass function. Thus, the discrepancy is alleviated by attributing it to an empirical overestimate of the number of massive galaxies at high redshifts. However, applying a similar convolution also at would further amplify the overproduction of the most massive galaxies in the local universe.
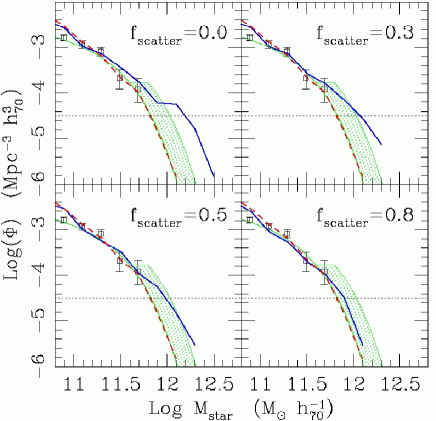
How to cope with the model overproduction of massive galaxies between and is the prime focus of the third study (Monaco et al. 2006), with Fig. 7 illustrating the case. Having fixed the star formation and feedback parameters in such a way to get a good fit to the mass function at , Monaco et al. continued the simulation down to having switched off all star formation, and allowing the mass of individual galaxies to grow under the sole effect of merging. By ignoring any possible mass increase by star formation, the result should be a lower limit to the top end of the mass function, and yet by an overproduction at the top mass end by more than an order of magnitude has gown (cf. top/left panel in Fig. 7). Monaco et al. explore the possibility of solving the discrepancy by assuming that a fraction of the stellar mass of merging galaxies does not end up in the merger product, but is rather scattered away to make up a population of free-floating intergalactic stars. Monaco et al. conclude that with at least as high as the theoretical mass function at could be reconciled with the observed one. One may also argue from Fig. 7 that a value as high as would give an even better fit to the data, which would be almost equivalent to neglect merging altogether.
In summary, 2006 semi-analytic models still appear to overproduce the most massive galaxies at , although different recipes have been suggested to bring them in agreement with the observations, namely, internal obscuration, random errors in empirical estimates of the masses of galaxies, and a relative inefficiency of merging in growing galaxy masses. In essence, there appears to be less merging activity in nature between and , compared to CDM expectations, which may also be indicated by some of the attempts at directly estimate the merging rates (cf. Section 2). May be there is a fourth option to solve the apparent discrepancy: perhaps dark matter halos do merge after all, but most galaxies don’t, and just the halo occupation number increases.
4. Conclusions
The last generation of hierarchical CDM models of galaxy formation and evolution provide a far better match to observations compared to the recent past. This improvement has resulted mainly from tuning the star formation and feedback recipes which are used to treat the baryonic physics in a schematic way.
A more fundamental test of the CDM paradigm should come from direct estimates of the merging rate of massive galaxies, to be compared to the theoretical merging rate of DM halos. However, current estimates of the (dry) merging rate at diverge widely, hence are not yet able to give a secure answer.
There appears to be some evidence for downsizing in both star formation and mass assembly of ETGs, i.e. the most massive ellipticals seem to be the first, not the last to be fully assembled as instead expected on the theoretical side. Once tuned to match the LF/MF at , models apparently overproduce the most massive galaxies ( few ) by z=0, due to still high merging rate of DM halos between and . It has been suggested that the discrepancy may not be real, but just arising from observational errors in stellar mass estimates. In alternative, if the discrepancy is real it could be due to merging not automatically resulting in an additive increase of the stellar mass of galaxies. Or maybe the merging rate of galaxies differs from the merging rate of their host halos.
With so many degrees of freedom in our description of baryonic physics, the vindication of the CDM hierarchical paradigm of galaxy formation should rather come from accurate estimates of the evolution with redshift of the galaxy merging rate, along with the evolution of the mass function, and especially of its top end.
Acknowledgments.
I am grateful to the organizers for having forced me to look deeper at the comparison of galaxy formation models and observations. I am indebted to the authors of the papers from which figures have been reproduced here with their permission.
References
- (1) Baugh, C.M., Benson, A.J.. Cole, S., Frenk, C.S., Lacey, C. 2003, in The Mass of galaxies at Low and High Redshift, ed. R. Bender & A. Renzini (Berlin: Springer), p. 91
- (2) Bell, E.F., Wolf, C., Meisenheimer, K., Rix, H.-W., et al. 2004, ApJ 608, 752
- (3) Bell, E.F., Naab, T., McIntosh, D.H., Somerville, R.S., et al. 2006a, ApJ 640, 241
- (4) Bell, E.F., Phleps, S., Somerville, R.S., Wolf, C., Borgh, A., et al. 2006b, ApJ, in press (astro-ph/0602038)
- (5) Borch, A., Meisenheimer, K., Bell, E.F., Rix, H.-W., et al. 2006, A&A, 453, 869
- (6) Bower, R.G., Benson, A.J., Malbon, R., Helly, J.C., et al. 2006, MNRAS, 370, 654
- (7) Bundy, K., Ellis, R.S., Conselice, C.J., Taylor, J.E., et al. 2006. ApJ, 651, 120
- (8) Cimatti, A., Daddi, E., & Renzini, A. 2006, A&A, 453, L29
- (9) Ciotti, L., D’Ercole, A., Pellegrini, S., Renzini, A. 1991, ApJ, 376, 380
- (10) Ciotti, L., & Ostriker, J.P. 1997, ApJ, 487, L10
- (11) Ciotti, L., & Ostriker, J.P. 2001, ApJ, 551, 131
- (12) De Lucia, G., Springel, V., White, S.D.M., Croton, D., & Kauffmann, G. 2006. MNRAS 366, 499
- (13) Drory, N., Salvato, M., Gabasch, A., Bender, R., Hopp, U., et al. 2005, ApJ, 619, L131
- (14) Faber, S.M., Willmer, C.N.A., Wolf, C., Koo, D.C., et al. 2006, astro-ph/0506044
- (15) Fontana, A., Pozzetti, L., Donnarumma, I., Renzini, A., et al. 2004, A&A, 424, 23
- (16) Fontana, A., Salimbeni, S., Grazian, A., Giallongo, E., Pentericci, L., et al. 2006, astro-ph/0609068
- (17) Granato, G.L., Silva, L., Monaco, P., Panuzzo, P., et al. 2001, MNRAS, 324, 757
- (18) Kauffmann, G., Haehnelt, M. 2000, MNRAS, 311. 576
- (19) Kitzbichler, M.G., & White, S.D.M. 2006, MNRAS, 366, 858
- (20) Lin, L., Koo, D.C., Willmer, C.N.A., Patton, D.R., et al. 2004, ApJ, 617, L9
- (21) Masjedi, M., Hogg, D.W., Cool, R.J., Eisenstein, D.J., et al. 2006, ApJ, 644, 54
- (22) Menci, N., Fontana, A., Giallongo, E., Grazian, A., & Salimbeni, S. 2006, ApJ, 647, 753
- (23) Monaco, P., Murante, G., Borgani, S., & Fontanot, F. 2006, ApJ, 652, L89
- (24) Renzini, A. 2006, ARA&A, 44, 141
- (25) Scarlata, C., Carollo, C.M., Lilly, S.J., Feldmann, R., Kampczyk, P., et al. 2007, ApJS, in press (astro-ph/0701746)
- (26) Somerville, R.S. 2004, in Multiwavelength Mapping of Galaxy Formation and Evolution, ed. A. Renzini & R. Bender (Berlin: Springer), p. 131
- (27) Somerville, R.S., Primack, J.R., & Faber, S.M. 2001, MNRAS, 320, 504
- (28) Springel, V., Frenk, C.S., & White, S.D.M. 2006, Nature, 440, 1137
- (29) van Dokkum, P.G. 2005, AJ, 130, 2647