X-ray selected starbursts in the GOODS-North
Abstract
We investigate claims that recent ultra-deep X-ray surveys are detecting starbursts at cosmologically interesting redshifts (). We combine X-ray data from the 2 Ms Chandra Deep Field North and multi-wavelength observations obtained as part of the GOODS-North to build the Spectral Energy Distributions (UV, optical, infrared) of X-ray sources in this field. These are fit with model templates providing an estimate of the total infrared luminosity () of each source. We then exploit the tight correlation between infrared and X-ray luminosities for star-forming galaxies, established in the local Universe, to select sources that are dominated by star-formation rather than supermassive black hole accretion. This approach is efficient in discriminating normal galaxies from AGN over a wide range of star-formation rates, from quiescent systems to starbursts. The above methodology results in a sample of 45 X-ray selected star-forming systems at a median redshift , the majority of which (60%) are either Luminous or Ultra-Luminous Infrared Galaxies. This sample is least affected by incompleteness and residual AGN contamination and is therefore well suited for cosmological studies. We quantify the X-ray evolution of these sources by constructing their differential X-ray counts, dN/dS, and comparing them with evolving luminosity function models. The results are consistent with luminosity evolution of the form with . This is similar to the evolution rate of star-forming galaxies selected at other wavelengths, suggesting that the deep X-ray surveys, like the Chandra Deep Field North, are indeed finding the starburst galaxy population that drives the rapid evolution of the global star-formation rate density in the range . Our analysis also reveals a separate population of infrared-faint X-ray sources at moderate-. These include old galaxies but also systems that are X-ray luminous for their stellar mass compared to local ellipticals. We argue that these may be post-starbursts that will, over time, become fainter at X-ray wavelengths and will eventually evolve into early-type systems (i.e E/S0).
keywords:
Surveys – galaxies: starbursts – galaxies: evolution – X-rays: galaxies1 Introduction
In the last two decades independent observational programs selecting galaxies over almost the entire range of the electromagnetic spectrum (UV, optical, infrared, sub-mm, radio) have consistently identified a fast evolving population of actively star-forming galaxies at moderate and high- (e.g. Rowan-Robinson 1993; Lilly et al. 1996; Wilson et al. 2002; Takeutchi et al. 2003; Babbedge et al. 2006; see Hopkins 2004 for a more complete reference list). These systems drive the rapid evolution of the global star-formation rate density from the local Universe to (e.g. Hopkins 2004).
Recently, surveys with the Chandra and the XMM-Newton missions have claimed the detection, for the first time at X-ray wavelengths, of this star-forming galaxy population. For example, stacking the X-ray photons at the positions of optically selected galaxies, not individually detected at X-rays, provide estimates of the mean X-ray properties of star-forming systems out to (Brandt et al. 2001; Hornschemeier et al. 2002; Nandra et al. 2002; Georgakakis et al. 2003; Laird et al. 2005, 2006). Hornschemeier et al. (2000) reported one of the first direct detections of X-ray emission from a normal galaxy outside the local Universe: an off-nuclear X-ray source associated with a low- spiral in the HDF-N, most likely an X-ray binary or a supernova remnant. Alexander et al. (2002) find a large overlap between narrow optical emission-line X-ray sources in the 1 Ms Chandra Deep Field North (CDF-North) and ISO detections in the Hubble Deep Field North (HDF-N). The X-ray and mid-infrared properties of these systems are found to be consistent with starburst activity. Bauer et al. (2002) using data from the same field also report a high identification rate between Jy radio sources, dominated by star-forming galaxies, and narrow optical emission-line X-ray detections. The radio and X-ray luminosities of these systems are also consistent with star-formation (but see Barger et al. 2007), further suggesting the appearance of starbursts at X-ray wavelengths. Quiescent early and late-type galaxies at have also been identified in the 2 Ms CDF-North by selecting sources with low X-ray–to–optical flux ratios (), about 2 dex below typical AGN (Hornschemeir et al. 2003). Parallel to these ultra-deep pencil-beam studies, shallow wide-area samples with both the Chandra and the XMM-Newton are also routinely finding normal galaxy candidates at lower redshift (e.g. Georgakakis et al. 2006a; Kim et al. 2006). The number counts of this new (for X-ray surveys) population increases steeply with decreasing X-ray flux, suggesting that it will outnumber AGN below the flux limit of the current deepest surveys (e.g. Horschemeier et al. 2003; Bauer et al. 2004; Kim et al. 2006). These sources will therefore be the dominant component of future X-ray samples.
In addition to the observational work above, studies are also in progress to model the physical processes responsible for the X-ray emission of star-forming galaxies (e.g. accreting binaries) and to understand how these systems evolve with time (e.g. Belczynski, Kalogera & Bulik 2002; Sipior 2003; Belczynski et al. 2007). Ghosh & White (2001) adopt a semi-empirical approach to link the lifetime of accreting binaries with the star-formation rate and to place the X-ray evolution of galaxies in a cosmological context. Depending on the star-formation history of the Universe and the evolution timescales of the high and low mass X-ray binaries (LMXRBs and HMXRBs respectively), which dominate the X-ray emission of late-type galaxies, these authors predict different evolution rates at X-ray wavelengths compared to other wavebands. Inverting this argument, constraining the X-ray evolution of galaxies can potentially provide information on physical properties, such as the characteristic timescales of LMXRBs and HMXRBs. For example, if HMXRB dominate the X-ray emission, we expect the total X-ray luminosity to follow closely the star-formation history of the Universe as observed at optical and IR wavelengths. In contrast, the LMXRB evolve much more slowly and in this case the integrated X-ray luminosity of galaxies should present a significant time lag behind the optical/IR star-formation density profile. The number density and evolution of LMXRB also presents interest for the LISA gravitational wave mission. This will be sensitive to the gravitational wave radiation of binaries with orbital periods less than 4 hr. These sources will consist primarily of LMXRB, where the companion is a low mass () main sequence star (Verbunt & Nelemans 2001). The determination of the LMXRB evolution with cosmic time holds important information on the number of expected LISA detections as well as on the level of its background radiation
The evidence above has motivated attempts to constrain observationally the X-ray evolution of these systems. Norman et al. (2004) compiled a sample of normal galaxy candidates in the CDF-North and South and determined their luminosity function at different redshifts in the range . Their analysis indicates luminosity evolution of the form , consistent with that inferred from other wavebands. Similar results are obtained by the complementary approach of constructing the X-ray number counts of galaxies and comparing them with evolutionary model predictions (Ranalli et al. 2006; Georgakakis et al. 2006b). The evidence above implies that the galaxy populations in X-ray surveys are dominated by the fast evolving starbursts, also found at other wavelengths, and that their X-ray emission is predominantly from short-lived HMXRB that trace the current star-formation rate of the host galaxy.
However, AGN remain the dominant component of current X-ray surveys. As a result the nature of the X-ray selected star-forming galaxy candidates identified in recent X-ray samples remains controversial. Although star-formation is an attractive option, the role of low-level or obscured AGN activity, that may dominate at X-ray wavelengths, is unclear. As in any waveband, residual AGN contamination in X-ray selected star-forming galaxy samples may significantly distort any conclusions on the evolution of these systems, casting doubt on the results of the studies above. For example, Bauer et al. (2004) use a range of criteria (e.g. optical and X-ray spectra, X-ray–to–optical flux ratio, X-ray luminosity) to group X-ray sources in the CDF-North and South into obscured/unobscured AGN and normal galaxy candidates. The number of sources in the latter sample varies by about 50% depending on how conservative the criteria are in excluding any possible AGN contribution. Therefore, any attempt to constrain the X-ray evolution of star-forming galaxies strongly depends on the sample selection (e.g. Georgakakis et al. 2006b). In order to place this new X-ray population in a cosmological context it is important that we quantify the significance of star-formation and AGN activity to the observed X-ray emission of these sources.
In this paper we combine deep X-ray, optical and mid-IR data in the Great Observatories Origins Deep Survey (GOODS) North region to construct the Spectral Energy Distributions (SEDs) of X-ray selected starburst candidates and to constrain their dominant energising source, star-formation or AGN activity. We exploit in particular the tight correlation between X-ray and infrared luminosities for star-forming galaxies (e.g. Ranalli et al. 2003) to compile an X-ray selected sample of such systems, least affected by AGN contamination. The advantage of this approach is that it is not affected by biases introduced when selecting star-forming galaxies by applying cuts in X-ray–to–optical flux ratio and/or the X-ray luminosity. Our main goal is to explore the cosmological evolution of starbursts at X-ray wavelengths. Throughout this paper we adopt , and .
2 Data
Deep multi-waveband optical imaging () in the GOODS North region has been obtained by Capak et al. (2004). The data reduction, source detection and catalogue generation are described in detail by these authors. These observations cover about and extend beyond the GOODS field of view (). In this study we use the -band selected sample comprising 47 451 sources to the limit mag ().
X-ray observations are available as part of the 2 Ms CDF-North survey. This covers a total of about and provides the deepest X-ray sample currently available []. In this paper we use the X-ray point source catalogue constructed by Alexander et al. (2003).
The mid-infrared is one of the key wavelength regimes of the GOODS. The observations were carried out by the Spitzer Space Telescope using the IRAC (3.6, 4.5, 5.8 and 8.0) and MIPS (24) detectors. These cover a total area of about on the sky, smaller than the CDF-North but centered on the most sensitive region of the X-ray observations. The data reduction is based on the Spitzer Science Center pipeline and is further refined by the GOODS team using custom routines (Dickinson et al. in preparation). The final data products comprise photometrically and astrometrically calibrated mosaiced images in all five wavebands. In this paper we use the 2nd data release (DR2) of the IRAC superdeep images (version 0.30) and the interim data release (DR1+) of the MIPS 24 mosaic (version 0.36) provided by the GOODS team (Dickinson et al. 2003; Dickinson et al. in preparation). The pixelscale is 0.6 and 1.2 arcsec for the IRAC and MIPS data respectively. Sources are detected on the individual IRAC and MIPS wavebands by running SExtractor (Bertin & Arnouts 1996) on the exposure-map weighted images convolved with a pixel Gaussian filter with a full-width half maximum (FWHM) of 1.2 and 3 arcsec for the IRAC and MIPS observations respectively. The source fluxes are estimated using apertures with diameters of 3.6 arcsec for the IRAC bands and 7.2 arcsec for the MIPS image. Total fluxes are estimated by multiplying the measured fluxes with aperture correction factors. These are determined by integrating the Spitzer point spread function (PSF) in different wavebands and are found to be 1.40, 1.47, 1.73, 1.86 and 2.49 for the IRAC 3.6, 4.5, 5.8 and 8.0 and MIPS 24 bands respectively. In the case of non-detection we assign an upper limit to the flux which corresponds to a value close the peak of the source counts in individual wavebands.
3 The Sample
We choose to work in the soft spectral band (0.5-2 keV), using the CDF-N catalogue of Alexander et al. (2003), as the sensitivity of Chandra is highest in this energy range and also because late and early-type galaxies typically have soft X-ray spectral properties (, keV; e.g Fabbiano 1995). For the initial classification of the X-ray sources into different types we use the scheme presented by Bauer et al. (2004) as a starting point. At this stage we do not use the IR information. Bauer et al. (2004) grouped X-ray sources into galaxy candidates and AGN on the basis of their (i) X-ray spectra, (ii) radio properties, (iii) X-ray luminosity, (iv) optical spectroscopy when available. In particular galaxies have off-nuclear X-ray emission, soft X-ray spectra with or hardness ratio , radio properties that do not suggest AGN activity, , somewhat brighter than the most X-ray luminous starbursts in the local Universe (Zezas, Georgantopoulos & Ward 1998; Moran, Lehnert & Helfand 1999) and low X-ray to optical flux ratio, . We define our “secure” galaxy sample to include all the sources that fulfill the criteria above. This conservatively selected sample is least affected by AGN contamination at the expense of potentially missing X-ray luminous starbursts and/or massive ellipticals (i.e. ; e.g. Tzanavaris, Georgantopoulos & Georgakakis 2006). We address this issue by considering as potential galaxies X-ray sources that although classified AGN by Bauer et al. (2004; e.g. high , ) have soft X-ray spectral properties (i.e. not obscured AGN) and optical emission that does not reveal AGN activity (i.e. broad emission lines). Most of these systems are Seyferts but luminous starbursts with may also be present. These sources define our “optimistic” galaxy sample. Late-type galaxies likely exist in both the “optimistic” and the “secure” samples. For clarity we keep these two sub-samples independent and therefore there is no overlap between the sources in each of them. In section 5 we include the the IR information in the analysis to improve this classification by minimising the AGN contamination of the star-forming galaxy sample.
The X-ray detections are identified with optical sources using the photometric catalogues of Capak et al. (2004) with a search radius of 3 arcsec. The optical counterparts are identical to those presented by Barger et al. (2003). For sources with optical identifications, we use the optical centroid, which has better positional accuracy, to cross-correlate with the IRAC and MIPS source positions. Visual inspection confirms that the mid-IR counterparts are robust. A number of X-ray sources lie outside the IRAC or MIPS field of view. These are excluded from the analysis that follows. Our final sample comprises a total of 230 0.5-2 keV selected sources with optical identifications that overlap with both the IRAC and the MIPS survey regions and therefore have detections or upper limits in all bands, . This includes 56 and 59 independent sources in the “optimistic” and “secure” samples respectively. There are additionally 95 and 20 sources classified obsucred (type-II) and unobscured (type-I) AGN respectively by Bauer et al. (2004). These systems are not considered as potential galaxy candidates but will serve as comparison sample.
4 Spectral Energy Distributions
The observed optical to mid-IR Spectral Energy Distribution (SED) of the X-ray sources in our sample are modeled following the methods fully described in Rowan-Robinson et al. (2005). In brief the -band to photometric data are fit using a library of 8 templates described by Babbedge et al. (2004), 6 galaxies (E, Sab, Sbc, Scd, Sdm and sb) and 2 AGN. At longer wavelengths () any dust may significantly contribute or even dominate the observed emission. Before fitting models to these wavelengths the stellar contribution is subtracted from the photometric data by extrapolating the best-fit galaxy template from the previous step. The residuals are then fit with a mixture of four templates: cirrus (Efstathiou & Rowan-Robinson 2003), AGN dust tori (Rowan-Robinson 1995; Efstathiou & Rowan-Robinson 1995), M 82 and Arp 220 starbursts (Efstathiou et al. 2000). The modeling above provides an estimate of the total infrared luminosity, , of our sample sources in the wavelength range . As discussed by Rowan-Robinson et al. (2005) this is expected to be accurate within a factor of two. For sources without spectroscopic redshift we use the photometric redshift estimated from the optical template SED fitting to determine . The accuracy of the photometric redshifts is estimated ( rms). We note however, that most of the galaxy candidates have spectroscopic redshifts available. A total of 12 and 7 sources in the “secure” and “optimistic” samples respectively show no infrared excess above the stellar expectation and therefore cannot be estimated. These infrared-faint sources are most likely early-type galaxies and are discussed separately. There are 47 and 49 star-forming galaxy candidates in the “secure” and “optimistic” samples respectively, which show mid-infrared excess above the stellar prediction.
In addition to the infrared luminosities above we also independently estimate stellar masses () for the GOODS-North X-ray sources. Our method is similar to those used by other groups (e.g. Bundy et al. 2005) and is based on minimisation to find, from a grid of template SEDs, the best-fit solution to the observed broad-band photometry of each galaxy ( and IRAC 3.6m). The SED library consists of a large number (about 20 000) of synthetic spectra extracted using the Bruzual & Charlot (2003) stellar population synthesis code adopting the Chabrier (2003) Initial Mass Function (IMF). The SEDs span a range of exponentially declining star-formation histories (e-folding time Gyrs), ages since the initial burst ( Gyr), metallicities () and diffuse interstellar medium dust obscuration () using the SMC extinction law (Gordon et al. 2003). When comparing model with observation we only use the IRAC 3.6m photometry from the available Spitzer bands. The stellar emission decreases significantly at longer wavelengths. Also, in the fitting process the redshift of source is fixed to either the spectroscopically determined value (when available) or to the photometric redshift estimated above. Stellar masses are estimated using the mass-to-light ratio () at 3.6m of the best-fit SED and the observed luminosity of the galaxy at this waveband. The advantage of using this wavelength is that first, it is least affected by extinction and second, it lies close to the stellar emission peak of the galaxy SED proving a reliable census of the stellar mass of the system. We note that although the allowed template SED parameter space is large, a number of uncertainties and systematic effects such as simplistic assumptions about the adopted SEDs (e.g. single burst stellar populations) and aliases between different templates may bias our results. Bundy et al. (2005) quantify the uncertainty in because of these effects. Based on this study we expect the derived stellar masses to be accurate within a factor of two. The observed and rest-frame properties of sources in the “optimistic” and “secure” samples are listed in Table 1 for infrared-faint sources and Table 2 for the star-forming galaxy candidates.
5 Results


In Figure 1 we plot X-ray luminosity in the 0.5-2 keV spectral band, after correcting for intrinsic obscuration, against for the GOODS-N X-ray sources, both AGN and galaxy candidates. For comparison we also show the X-ray/infrared luminosity relation for the sample of local star-forming galaxies compiled by Ranalli et al. (2003). These authors showed that for galaxies dominated by star-formation the X-ray and infrared luminosities are tightly correlated, while AGNs deviate from this relation in the sense that they are X-ray luminous for their infrared luminosity. This relation can therefore be used to discriminate between AGN and systems dominated by star-formation. In order to compare our results with those of Ranalli et al. (2003) we convert their infrared luminosity, , estimated using the IRAS 60 and bands (Helou et al. 1988), to total infrared luminosity used here, , adopting the conversion (Takeuchi et al. 2005). We also estimate the expected rms envelope of the X-ray/infrared luminosity relation for star-forming galaxies by quadratically adding the scatter of the Ranalli et al. relation () and the factor of 2 () uncertainty in .
In Figure 1 the majority of X-ray sources classified AGN by Bauer et al. (2004) deviate from the relation for star-forming galaxies. Also most of the sources in the “secure” sample scatter around the Ranalli et al. (2003) relation suggesting that their X-ray emission is dominated by star-formation. As expected, the AGN contamination of the “optimistic” sample is large, in agreement with the classification of Bauer et al. (2004). There are nevertheless few sources in a that subsample that have X-ray and infrared luminosities consistent with star-formation, notably those with high . In the discussion that follows we define “normal galaxies” those X-ray sources in the “secure” and “optimistic” samples which deviate by less than from the Ranalli et al. (2003) relation. Galaxies selected in this way are assumed to be dominated by star-formation. Relaxing the above limit for “normal galaxy” selection will not significantly alter our conclusions but is likely to include an increasing fraction of AGN dominated systems in the “normal galaxy” sample. Based on the above, the fraction of “normal galaxies” in the “secure” and “optimistic” samples (excluding infrared faint sources) is 80 (38/47) and 14 (7/49) per cent respectively.
Also in Figure 1 we find only one “normal galaxy” with X-ray luminosity marginally in excess of . The lack of X-ray luminous starbursts in the sample is independent of the Bauer et al. (2004) classification and is based only on the distance of X-ray sources from the relation of star-forming galaxies. In the nearby Universe the X-ray brightest starbursts known also have (e.g. Zezas, Georgantopoulos & Ward 1998; Moran, Lehnert & Helfand 1999) suggesting that this X-ray luminosity may correspond to the upper limit that can be produced by star-formation. The evidence above justifies the use of an upper limit in when searching for star-formation dominated sources in X-ray samples (e.g. Bauer et al. 2004; Tzanavaris et al. 2006). This issue will be discussed in more detail in section 6.
In addition to the cutoff, the X-ray–to–optical flux ratio, , is also used to select against AGN (e.g. Hornschemeier et al. 2003; Georgantopoulos et al. 2005). Our “normal galaxy” sample is independent of and therefore, can be used to assess the level of bias introduced when selecting star-forming systems using this quantity. Figure 2 plots against . The X-ray–to–optical flux ratio is estimated using the -band magnitude and the 0.5-2 keV flux (not corrected for absorption) according to the relation (Hornschemeier et al. 2003)
| (1) |
Rather than using rest-frame fluxes for the we prefer to use observed quantities because this is what is available to observers when selecting their sample. In Figure 2 the X-ray–to–optical flux ratio of “normal galaxies” increases, on average, with . Quiescent systems with low-level star-formation rate have , while more active galaxies have (e.g. Alexander et al. 2003). AGN dominated systems although typically have , also overlap with the region of the parameter space occupied by starbursts resulting in significant contamination when selecting galaxies only on the basis of . For example, in the case of , about 53% (48/91) of the GOODS-North X-ray sources are AGN dominated. This underlines the need for multiwavelength data to identify star-forming systems in X-ray selected samples. Selecting at lower X-ray–to–optical flux ratios, i.e. , though minimising AGN contamination (28%; 11/39), results in incompleteness since the most X-ray luminous starbursts are not included. Georgakakis et al. (2006b) show that it is precisely those sources with , that drive the evolution of the X-ray population. We also note that this incompleteness is likely to be more severe at moderate and high- samples since at lower redshifts () such X-ray luminous starbursts are rarer. For example using the late-type galaxy X-ray luminosity function of Georgakakis et al. (2006a) with luminosity evolution of the form we find that the volume density of sources with decreases by a factor of about 2.5 from (the median redshift of the “normal galaxy” sample presented here) to .
Finally, in Figure 2 we find that 60 (27/45) and 11 (5/45) per cent of the X-ray selected “normal galaxies” belong to the luminous (LIRGs; ) and ultra-luminous (ULIRGs; ) infrared galaxy classes respectively. This is direct evidence that current ultra-deep X-ray surveys detect the starburst galaxy population that is responsible for the rapid evolution of the global star-formation rate from the local Universe to .
Next we consider those X-ray sources in the “secure” and “optimistic” samples with SEDs that do not show infrared excess over the stellar prediction. For these sources we cannot estimate and therefore they are not shown in any of the plots presented above. Many of them (but not all) have early-type optical morphology in the ACS survey of the GOODS-North or absorption line optical spectra (see below). These systems are either early type galaxies with little star-formation or weak AGN. Figure 3 plots the stellar mass of these sources as a function of their X-ray luminosity. For comparison we also show nearby ellipticals from the sample of Ellis & O’Sullivan (2006) as well as the absorption-line SDSS galaxies presented by Hornschemeier et al. (2005). For the former sample stellar masses are approximated using the -band magnitudes listed by Ellis & O’Sullivan (2006) and the mass-to-light ratio of a 12 Gyr solar metallicity stellar population from the Bruzual & Charlot (2003) library with an exponentially declining SFR history with Gyr. In the case of the Hornschemeier et al. (2005) galaxies stellar masses are estimated by applying the method of section 4 to the SDSS photometry and using the -band mass-to-light ratio.
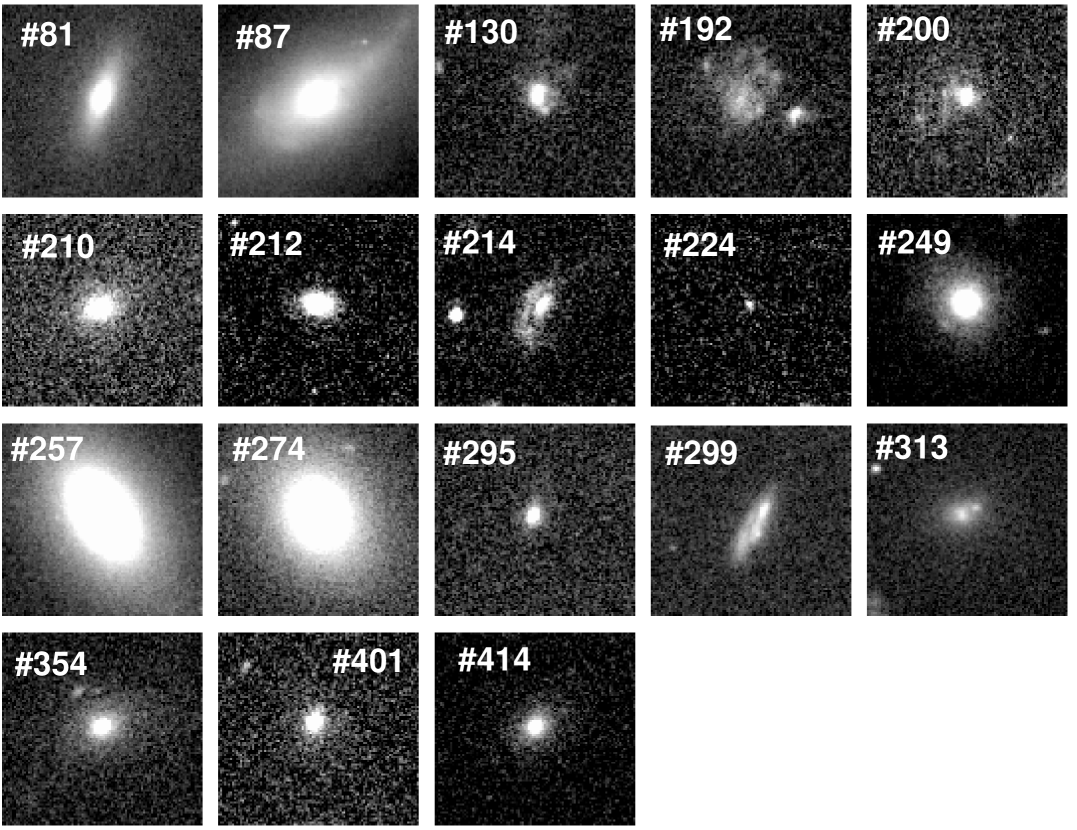
In Figure 3, some of the CDF-N sources are consistent with the relation of low- early-type galaxies, suggesting X-ray emission dominated by hot gas and LMXRBs (i.e. #81, 87, 210, 214, 257, 274, 313, 358, 401; Table 1). For those sources that optical spectra are available for visual inspection, we find absorption optical lines only. The Hubble Space Telescope (HST) Advanced Camera for Surveys (ACS) images also suggest E/S0 morphologies for most of these systems (Figure 4). Moreover, in Figure 3 there are also many sources that are X-ray luminous for their stellar mass and stand out from the region of the parameter space occupied by low- ellipticals (i.e #130, 192, 200, 212, 224, 249, 295, 299, 354, 414; Table 1). Low-luminosity AGN activity is an obvious interpretation for these sources. However, some of these systems also show the line in absorption with equivalent width in the range 3–7 Å (#192, 200, 212 and 414), superimposed on an absorption and/or emission line optical spectrum. Although the equivalent width uncertainties are , the features above are reminiscent of the K+A or E+A class of galaxies (e.g. Dressler & Gunn 1992) and suggest post-starburst systems. The HST/ACS optical morphology of some, but not all, of these sources show low surface brightness disturbances, that may indicate past interactions/mergers (Figure 4). It is therefore possible that these galaxies are observed just after a star-formation episode, possibly triggered by a merger event. In this scenario the X-ray emission is dominated by luminous X-ray binaries that will eventually dim, bringing these systems onto the elliptical locus of Figure 3. Post-starburst galaxies could potentially represent a large fraction of the CDF-N sources which appear X-ray luminous for their stellar mass in Figure 3. This is because for many of them we cannot measure the line. Either the optical spectra are not available in electronic form (#224, 249, 354) or the lies outside the observable spectral window (#130).


6 Discussion
6.1 Sample selection
Until recently, the study of star-forming galaxies at X-ray wavelengths was confined to the local Universe only via targeted observations of few X-ray bright systems. This was radically changed by the Chandra and the XMM-Newton which have claimed the identification, for the first time, of X-ray selected star-forming galaxies at cosmologically interesting redshifts opening the way for evolution studies (e.g. Hornschemeier et al. 2003; Norman et al. 2004; Georgantopoulos et al. 2005; Georgakakis et al. 2006a). The main concern however, is that a fraction of these X-ray sources may be associated with weak or obscured AGN and therefore their X-ray emission may be due to accretion on a supermassive black-hole rather than stellar processes. The low X-ray–to–optical flux ratio does not guarantee AGN free samples, while optical spectroscopy often fails to identify AGN signatures (e.g. Moran et al. 2002; Georgantopoulos, Zezas & Ward 2003; Peterson et al. 2006).
In this paper we address the AGN contamination in X-ray selected galaxy samples by exploiting the correlation between X-ray and infrared luminosities for star-forming galaxies (e.g. Ranalli et al. 2003). We use the GOODS-North Spitzer data to estimate the IR luminosity of X-ray sources in the CDF-North and to discriminate AGN from star-formation dominated systems. The effectiveness of the method is demonstrated in Figure 1. Using this figure we select a total of 45 sources that scatter away from the relation for local star-forming galaxies (“normal galaxy” sample). This limit is chosen so that the final “normal galaxy” sample includes sufficient number of sources minimising incompleteness and AGN contamination. Changing this selection cutoff does not change our main conclusions.
This method however, although efficient at high star-formation rates, may be biased in the case of quiescent galaxies. This is because the X-ray emission of starburst galaxies is dominated by HMXRBs which have been shown to be good tracers of the current star-formation rate (Grimm et al. 2003; Persic et al. 2004). In the case of quiescent systems however, the X-ray emission is mainly from LMXRBs with a long evolution timescale. These systems are associated with the stellar mass of the host galaxy rather than the on-going star-formation activity. For example Persic et al. (2004) argue that correcting for the LMXRB component significantly reduces the scatter in the relation. In Figure 1 we are not accounting for this effect and therefore we might expect larger scatter for galaxies in the low-luminosity end of the plot, rendering our selection method less reliable. Nevertheless, the tight linear relation between total X-ray and infrared luminosities of Ranalli et al. (2003), which also includes quiescent galaxies, suggest that although the LMXRB correction is important when calibrating the as a SFR estimator (e.g. Persic et al. 2004), it does not introduce biases in the selection of galaxies.
In any case, we quantify the effect of LMXRB in Figure 1 by estimating their contribution to the integrated X-ray luminosity of the galaxy. For this exercise we use the results from the study of Gilfanov (2004). He found a linear relation between the stellar mass of nearby early-type galaxies, , and the total X-ray luminosity of the X-ray point source population of these quiescent systems, expected to be dominated by LMXRB (). We adopt the mean ratio of found in this study and use the stellar masses estimated in section 4 to determine the mean expected LMXRB X-ray luminosity for each source in our sample. The fractional expected contribution of LMXRB to the total X-ray luminosity is shown in Figure 5 for the “secure” and “optimistic” galaxy samples. For the majority of the sources this contribution is small (). This fraction however, increases with decreasing , although there are only a handful of sources for which is large enough, , to significantly alter their position in the diagram. Nevertheless, reapplying the selection of “normal galaxies” (i.e. sources that scatter away from the relation) using X-ray luminosities corrected for the LMXRB contribution does not modify the final “normal galaxy” sample used here. We conclude that for the sample studied here the LMXRB population has little impact on the efficiency of Figure 1 for selecting star-forming galaxies.
At the bright- end of Figure 1, we find evidence for an upper limit in the X-ray luminosity produced by star-formation of . A similar result has been reported by Grimm et al. (2003) who studied the X-ray luminosity function of the point-source population (mostly X-ray binaries) of local late-type galaxies. These authors argue for a bright cutoff of about few times in the point-source luminosity function of starbursts, with the highest luminosity systems most likely associated with HMXRBs. Combining this cutoff and their finding that the normalisation of the luminosity function scales with SFR, these authors establish a linear relation between integrated X-ray luminosity and SFR, which implies that extreme star-formation rates are required () to produce . This is also consistent with the Ranalli et al. (2003) relation in Figure 1, which suggests that star-forming galaxies with should have and therefore extreme SFRs. Such objects however, may be too rare for the volume probed by the CDF-North to be detected. We explore this possibility adopting the following approach: we start from the 60 LF of cool infrared colour galaxies presented by Takeutchi et al. (2003) to estimate the expected number density of sources as a function of redshift and infrared luminosity. Density evolution of the form , proposed by these authors, is adopted in this calculation. We then use the Ranalli et al. (2003) relation and its scatter to convert the infrared luminosity to in a given redshift slice, under the assumption that the sources are dominated by star-formation. This approach allows us to estimate the surface number density of starbursts with at different redshift slices. Convolving that with the sensitivity map of the CDF-North we determine the expected total number of these systems within the surveyed area. We find that these sources are rare: about one luminous starburst is expected within the GOODS-North area. We conclude that the size of this sample is not large enough to find this class of sources. Larger area surveys at a similar X-ray depth are required to explore this issue.
6.2 X-ray evolution
The identification of star-forming galaxies outside the local Universe by the Chandra and the XMM-Newton has prompted studies on the cosmological evolution of this population at X-ray wavelengths (e.g. Norman et al. 2004; Ranalli et al. 2005; Georgakakis et al. 2006b). Although the star-formation history of the Universe has been mapped out to by numerous groups selecting galaxies at other wavebands (e.g. Hopkins 2004), the X-ray regime provides unique information on the physics of galaxies that is complementary to any other wavelength. Depending on the evolution timescales of the high and low mass X-ray binary populations, which dominate the X-ray emission of star-forming galaxies, models predict different evolution rates at X-ray wavelengths (Ghosh & White 2001). Conversely, constraining the X-ray evolution of galaxies can provide information on physical properties, such as the characteristic timescales of high and low mass X-ray binaries.
We quantify the X-ray evolution of star-forming galaxies using the “normal galaxy” sample defined in this paper on the basis of the relation. This has the advantage that is least affected by AGN contamination while still including powerful starbursts. The median redshift of the sample is . Although there are not enough sources (total of 45) to estimate a luminosity function at different redshift bins we explore the X-ray evolution of the population by constructing the differential counts . These are then compared with the predictions of the observed X-ray luminosity function (XLF) of star-forming galaxies (Georgantopoulos et al. 2005; Georgakakis et al 2006a) under different evolution scenarios. At the bright flux-end we complement the CDF-North sources with low- late-type galaxies identified in the wide-area shallow surveys summarised by Georgakakis et al. (2006b). In Figure 6 we compare the differential counts over 4 dex in flux with the estimated by integrating the late-type galaxy XLF of Georgakakis et al. (2006a) parameterising the evolution as . In this figure the curve is inconsistent with the data. A maximum likelihood fit yields , indicating evolution of this population to similar to that estimated in other wavebands (e.g. Hopkins 2004). This is not surprising since a large fraction of the X-ray selected “normal galaxies” used here (about 60%) are LIRG or ULIRGs which are known to evolve fast from the local Universe to higher- and are likely dominated by HMXRBs. Finally, the evolution rate derived here, , is consistent with those models of Ghosh & White (2001) that adopt a slow evolution timescale for the low-mass X-ray binary population, Gyr. Shorter timescales predict higher exponents, almost independent of the adopted functional form of the star-formation history of the Universe.
6.3 Infrared-faint galaxy candidates
In addition to star-forming galaxies our X-ray sample also includes infrared-faint sources. About 50% of them are early type systems with X-ray emission from hot gas and LMXRBs. The other half of this population deviates from the relation for low- early-type galaxies (see Figure 3). These sources are likely AGN powered but optical spectroscopy also suggests post-starbursts. In this picture the star-formation has stopped while the X-ray emission is dominated by luminous X-ray binaries that will eventually dim, bringing these systems on the elliptical locus of Figure 3.
Sipior (2003) have developed simulations of the evolution of X-ray binaries formed in a burst of star-formation lasting for 20 Myrs. Although their results are for the keV band instead of the 0.5-2 keV, their main conclusions are nevertheless useful for a qualitative comparison with the observations presented here. In this model the 2-10 keV luminosity of the X-ray binaries reaches a maximum of shortly after the end of the star-formation burst. At later stages the luminosity slowly declines, as new populations of lower-mass binaries become active, dropping by about 1 and 2 dex after and 1 Gyrs respectively. The normalisation of the light curve depends on the stellar mass produced during the star-formation burst as well as model dependent assumptions, such as the evolution details of massive stars () during the final stages of their lifetime and the mass-loss through winds for main sequence stars. For example lower mass-loss rates than those adopted by Sipior (2003) will increase the peak luminosity by a factor of few (e.g. Van Bever & Vanbeveren 2000). Assuming that the bulk of the stellar population in the infrared-faint sources in our sample, about , is produced during a single burst of star-formation, then scaling up the results of Sipior (2003) we estimate an instantaneous peak 2-10 keV luminosity of decreasing to after a few hundred Myrs.
Read & Ponman (1996) studied the evolution of the X-ray emission during merger-induced star-formation bursts. They also find that the ratio decreases from interacting systems close to nuclear coalescence (e.g. ARP 220) to merger remnants, Gyrs after the burst (e.g. NGC 7252). At later stages (), the X-ray luminosity of elliptical galaxies is found to increase, on average, with the age of their stellar population presumably because of the build-up of the hot diffuse halo (O’Sullivan, Forbes & Ponman 2001). The evidence above suggests that if the infrared-faint sources in the sample are post-starbursts we are observing them shortly after the star-formation has ended (about Gyr).
At lower redshifts, , Hornschemeier et al. (2005) using SDSS data also identified an absorption-line X-ray source with no optical spectral evidence for AGN activity that appears too X-ray luminous for its stellar mass (see Figure 3). These authors also discuss this source in the context of sustained X-ray emission following a burst of star-formation. Such objects are likely to be more common at the high- Universe, probed here, compared to the present day. We note however, that the evidence in favor of the post-starburst scenario is far from conclusive. For example Yan et al. (2006) argue that a large fraction of low- galaxies in the SDSS with K+A optical spectra (i.e. post-starbursts) show weak emission lines that are consistent with Seyfert or LINER type activity rather than residual star-formation. Goto (2006) also used the SDSS to identify systems with deep absorption lines, typical of post-starbursts, and optical emission lines typical of AGN. These sources represent about 4% of the AGN population in a volume limited subsample. Such emission-line post-starburst galaxies would not have been selected by traditional E+A/K+A criteria that require little or no emission lines to exclude residual star-formation activity. The comparison between the X-ray selected sample presented here and the optically selected SDSS post-starbursts, classified AGN on the basis of optical emission line ratios, is not straightforward. For example, the X-ray properties of the SDSS sources remain unexplored. At the same time the optical emission line properties of the CDF-N X-ray sources (i.e. line ratios) cannot be measured from the existing data because of the lower quality spectra compared to the SDSS (i.e. optically faint sources) and the different rest-frame wavelength coverage because of the higher redshift.
7 Conclusions
In this paper we show that the relation established in the local Universe is a powerful diagnostic for identifying starbursts in X-ray surveys. Using this approach we compile a sample of moderate- () star-forming galaxies in the CDF-North and conclude that the observed number density of this population is consistent with X-ray luminosity evolution of the form with . This rate of evolution, is similar to that inferred from other wavebands, suggesting that current ultra-deep X-ray samples are sensitive enough to detect the starburst population that drives the global SFR evolution to . In addition to star-forming galaxies we also find a population of infrared-faint passive galaxies that are however too X-ray luminous for their stellar mass, compared to local ellipticals. We argue that these may be galaxies observed yr after the end of a major star-formation event with sustained X-ray emission due to X-ray binaries produce during the burst. Over time, these sources are likely to become fainter at X-ray wavelengths and will eventually evolve into E/S0. The present data however, cannot exclude the possibility of underlying low-luminosity AGN activity in at least some of these sources.
| ID | T | |||||||||||||
|---|---|---|---|---|---|---|---|---|---|---|---|---|---|---|
| (J2000) | (J2000) | (mag) | (Jy) | (Jy) | (Jy) | (Jy) | (Jy) | () | () | (Å) | ||||
| (1) | (2) | (3) | (4) | (5) | (6) | (7) | (8) | (9) | (10) | (11) | (12) | (13) | (14) | (15) |
| 81 | 12 36 08.06 | +62 08 52.4 | 20.28 | 40.79 | 10.34 | 3 | ||||||||
| 87 | 12 36 09.75 | +62 11 45.9 | 18.52 | 39.81 | 9.36 | 3 | ||||||||
| 130 | 12 36 21.98 | +62 14 15.9 | 23.18 | 41.44 | 10.43 | 3 | ||||||||
| 192 | 12 36 36.25 | +62 13 19.2 | 22.64 | 40.82 | 9.01 | 3 | ||||||||
| 200 | 12 36 37.35 | +62 08 31.1 | 23.06 | 41.31 | 10.36 | 3 | ||||||||
| 210 | 12 36 39.72 | +62 15 47.3 | 22.53 | 41.51 | 10.78 | 3 | ||||||||
| 212 | 12 36 40.12 | +62 16 55.6 | 23.36 | 41.77 | 10.36 | 1 | ||||||||
| 214 | 12 36 40.54 | +62 18 33.2 | 23.55 | 41.37 | 11.22 | 1 | ||||||||
| 224 | 12 36 42.24 | +62 06 12.8 | 25.71 | 42.39 | 9.05 | 1 | ||||||||
| 249 | 12 36 48.07 | +62 13 09.0 | 20.98 | 41.31 | 10.17 | 3 | ||||||||
| 257 | 12 36 49.45 | +62 13 47.1 | 18.47 | 38.98 | 9.33 | 3 | ||||||||
| 274 | 12 36 52.89 | +62 14 44.1 | 19.39 | 40.91 | 10.62 | 3 | ||||||||
| 295 | 12 36 57.36 | +62 10 25.5 | 23.83 | 41.32 | 10.15 | 1 | ||||||||
| 299 | 12 36 57.91 | +62 21 28.6 | 22.43 | 42.34 | 9.68 | 1 | ||||||||
| 313 | 12 37 01.10 | +62 21 08.1 | 21.76 | 41.31 | 10.84 | 3 | ||||||||
| 354 | 12 37 08.68 | +62 15 01.5 | 22.17 | 41.07 | 9.66 | 3 | ||||||||
| 358 | 12 37 09.47 | +62 08 37.4 | 21.86 | 41.88 | 10.97 | 1 | ||||||||
| 401 | 12 37 20.31 | +62 15 23.5 | 23.23 | 41.53 | 10.95 | 1 | ||||||||
| 414 | 12 37 24.43 | +62 12 41.8 | 22.18 | 41.46 | 10.14 | 3 |
-
The columns are: 1: identification number in the Alexander et al. (2003) catalogue; 2: right ascension of the X-ray source; 3: declination of the X-ray source; 4: optical -band magnitude; 5: flux in micro-Jy; 6: flux in micro-Jy; 7: flux in micro-Jy; 8: flux in micro-Jy; 9: flux in micro-Jy; 10: 0.5-2 keV luminosity; 11: total IR luminosity in units of solar luminosity ; 12: stellar mass in solar units; 13: redshift, the superscripts are “phot”: photometric redshift, “A”: absorption line spectrum, “EA”: emission+absorption line spectrum; 14: equivalent width in . Sources for which their spectra are not availabe for visual inspection or the is outside the observable spectal window have a dash; 15: X-ray source type from Bauer et al. (2004), “1” is for “optimistic” sample and “3” corresponds to the “secure” sample.
| ID | T | ||||||||||||
|---|---|---|---|---|---|---|---|---|---|---|---|---|---|
| (J2000) | (J2000) | (mag) | (Jy) | (Jy) | (Jy) | (Jy) | (Jy) | () | () | ||||
| (1) | (2) | (3) | (4) | (5) | (6) | (7) | (8) | (9) | (10) | (11) | (12) | (13) | (14) |
| 46 | 12 35 55.43 | +62 15 05.0 | 18.99 | 40.04 | 9.52 | 9.47 | |||||||
| 56 | 12 35 58.94 | +62 15 42.4 | 20.26 | 39.48 | 8.63 | 8.24 | 3 | ||||||
| 57 | 12 35 59.72 | +62 15 50.0 | 19.10 | 40.77 | 11.53 | 10.59 | |||||||
| 61 | 12 36 01.50 | +62 14 06.5 | 23.42 | 42.81 | 12.60 | 10.45 | 1 | ||||||
| 67 | 12 36 03.31 | +62 11 11.0 | 20.72 | 41.40 | 11.42 | 10.90 | |||||||
| 77 | 12 36 06.70 | +62 15 50.7 | 23.21 | 43.55 | 12.31 | 10.33 | 1 | ||||||
| 78 | 12 36 06.71 | +62 12 20.5 | 24.21 | 41.67 | 9.36 | 10.31 | 1 | ||||||
| 80 | 12 36 07.68 | +62 15 03.3 | 24.34 | 43.24 | 10.06 | 10.68 | 1 | ||||||
| 83 | 12 36 08.22 | +62 15 53.1 | 21.51 | 41.07 | 10.13 | 9.45 | 3 | ||||||
| 94 | 12 36 12.03 | +62 09 00.4 | 25.08 | 42.59 | 12.40 | 10.96 | 1 | ||||||
| 101 | 12 36 14.42 | +62 13 19.0 | 20.59 | 40.83 | 10.40 | 10.52 | |||||||
| 103 | 12 36 14.51 | +62 07 18.4 | 22.07 | 41.96 | 11.63 | 10.48 | |||||||
| 111 | 12 36 16.81 | +62 14 36.0 | 21.33 | 40.65 | 9.64 | 10.72 | 3 | ||||||
| 113 | 12 36 17.06 | +62 10 11.6 | 22.59 | 42.75 | 10.96 | 10.67 | 1 | ||||||
| 115 | 12 36 18.00 | +62 16 35.0 | 21.02 | 42.99 | 11.49 | 10.59 | 1 | ||||||
| 117 | 12 36 19.15 | +62 14 41.6 | 26.01 | 42.49 | 10.05 | 10.21 | 1 | ||||||
| 119 | 12 36 19.45 | +62 12 52.4 | 20.58 | 40.85 | 11.20 | 10.69 | |||||||
| 124 | 12 36 20.99 | +62 14 12.2 | 24.51 | 41.95 | 9.65 | 10.09 | 1 | ||||||
| 126 | 12 36 21.09 | +62 12 08.2 | 22.44 | 41.01 | 11.34 | 10.48 | |||||||
| 132 | 12 36 22.53 | +62 15 45.2 | 20.74 | 41.08 | 11.68 | 10.50 | |||||||
| 134 | 12 36 22.65 | +62 10 28.5 | 25.58 | 42.23 | 10.18 | 9.82 | 1 | ||||||
| 136 | 12 36 22.76 | +62 12 59.7 | 20.91 | 40.67 | 10.08 | 10.41 | 3 | ||||||
| 138 | 12 36 23.00 | +62 13 46.9 | 21.21 | 40.82 | 10.91 | 10.11 | |||||||
| 139 | 12 36 23.64 | +62 18 36.9 | 23.30 | 42.61 | 11.06 | 10.94 | 1 | ||||||
| 149 | 12 36 27.31 | +62 12 57.7 | 22.70 | 41.63 | 11.58 | 10.39 | |||||||
| 166 | 12 36 31.24 | +62 12 36.7 | 21.89 | 40.53 | 10.11 | 9.34 | |||||||
| 174 | 12 36 33.23 | +62 08 34.8 | 21.92 | 43.03 | 12.04 | 11.04 | 1 | ||||||
| 177 | 12 36 33.67 | +62 10 05.7 | 22.60 | 42.14 | 12.08 | 10.96 | 1 | ||||||
| 180 | 12 36 34.46 | +62 12 13.0 | 19.37 | 41.25 | 11.29 | 10.92 | |||||||
| 182 | 12 36 34.50 | +62 12 41.2 | 23.32 | 41.92 | 12.25 | 11.09 | |||||||
| 194 | 12 36 36.75 | +62 11 56.0 | 22.32 | 42.31 | 10.08 | 10.08 | 1 | ||||||
| 197 | 12 36 37.18 | +62 11 35.0 | 18.12 | 38.90 | 9.34 | 8.79 | |||||||
| 205 | 12 36 39.09 | +62 09 43.9 | 24.07 | 42.96 | 11.57 | 10.96 | 1 | ||||||
| 209 | 12 36 39.70 | +62 10 09.6 | 22.02 | 41.38 | 10.56 | 10.11 | 1 | ||||||
| 211 | 12 36 39.92 | +62 12 49.9 | 22.17 | 41.36 | 11.58 | 10.55 | |||||||
| 222 | 12 36 42.20 | +62 15 45.5 | 22.23 | 42.33 | 11.94 | 11.14 | 1 | ||||||
| 225 | 12 36 43.10 | +62 11 08.0 | 22.86 | 42.81 | 12.51 | 10.61 | 1 | ||||||
| 227 | 12 36 44.00 | +62 12 50.1 | 21.36 | 40.66 | 11.01 | 10.23 | |||||||
| 230 | 12 36 44.40 | +62 11 33.3 | 22.51 | 41.63 | 12.41 | 11.19 | |||||||
| 234 | 12 36 45.42 | +62 19 00.9 | 20.97 | 40.87 | 10.83 | 9.99 | |||||||
| 235 | 12 36 45.46 | +62 18 49.4 | 25.81 | 43.45 | 12.12 | 11.03 | 1 | ||||||
| 236 | 12 36 45.68 | +62 14 48.4 | 25.53 | 41.50 | 12.97 | 10.64 | 1 | ||||||
| 241 | 12 36 46.39 | +62 15 29.1 | 23.84 | 41.83 | 11.79 | 11.06 | |||||||
| 244 | 12 36 46.73 | +62 08 33.6 | 21.86 | 41.37 | 11.57 | 11.01 | |||||||
| 245 | 12 36 47.04 | +62 12 38.2 | 21.11 | 39.92 | 9.27 | 9.29 | 3 | ||||||
| 251 | 12 36 48.37 | +62 14 26.4 | 19.15 | 39.62 | 9.91 | 9.25 | |||||||
| 258 | 12 36 49.51 | +62 14 06.9 | 22.55 | 40.97 | 11.05 | 10.12 |
| 260 | 12 36 49.71 | +62 13 13.2 | 21.99 | 40.73 | 10.95 | 10.22 | |||||||
| 262 | 12 36 50.30 | +62 20 04.5 | 24.50 | 42.32 | 9.77 | 10.56 | 1 | ||||||
| 264 | 12 36 51.03 | +62 17 31.8 | 22.33 | 40.28 | 8.53 | 8.86 | 3 | ||||||
| 265 | 12 36 51.15 | +62 10 30.4 | 20.73 | 40.76 | 11.66 | 10.46 | |||||||
| 269 | 12 36 52.10 | +62 14 57.2 | 22.10 | 40.38 | 9.52 | 8.92 | 3 | ||||||
| 272 | 12 36 52.76 | +62 13 54.1 | 22.21 | 41.57 | 11.31 | 9.99 | |||||||
| 273 | 12 36 52.88 | +62 16 37.1 | 24.59 | 42.18 | 11.83 | 9.59 | 1 | ||||||
| 277 | 12 36 53.37 | +62 11 39.6 | 22.93 | 42.02 | 12.17 | 10.70 | |||||||
| 282 | 12 36 54.26 | +62 07 45.3 | 19.23 | 39.05 | 9.43 | 9.28 | |||||||
| 286 | 12 36 55.45 | +62 13 11.2 | 23.45 | 42.28 | 11.30 | 10.90 | 1 | ||||||
| 287 | 12 36 55.79 | +62 12 00.9 | 24.71 | 42.58 | 12.36 | 10.87 | 1 | ||||||
| 288 | 12 36 55.89 | +62 08 07.6 | 22.54 | 41.51 | 11.74 | 11.25 | |||||||
| 294 | 12 36 56.92 | +62 13 01.6 | 24.02 | 41.43 | 9.46 | 10.43 | 1 | ||||||
| 300 | 12 36 58.33 | +62 09 58.5 | 17.92 | 39.59 | 9.90 | 10.04 | |||||||
| 305 | 12 36 58.85 | +62 16 37.9 | 20.00 | 40.19 | 10.27 | 10.08 | |||||||
| 309 | 12 36 59.80 | +62 19 33.9 | 24.02 | 42.69 | 11.11 | 10.63 | 1 | ||||||
| 310 | 12 36 59.92 | +62 14 49.8 | 22.18 | 40.92 | 11.37 | 10.64 | |||||||
| 311 | 12 37 00.38 | +62 16 16.6 | 22.91 | 41.34 | 11.65 | 10.27 | |||||||
| 314 | 12 37 01.17 | +62 10 16.0 | 25.52 | 42.00 | 12.74 | 10.46 | |||||||
| 320 | 12 37 01.99 | +62 11 22.1 | 19.18 | 39.45 | 9.64 | 9.32 | |||||||
| 322 | 12 37 02.62 | +62 12 43.9 | 25.42 | 42.96 | 9.39 | 10.53 | 1 | ||||||
| 327 | 12 37 03.65 | +62 11 22.8 | 23.46 | 41.17 | 11.27 | 9.65 | |||||||
| 333 | 12 37 04.64 | +62 16 51.9 | 20.60 | 41.62 | 10.37 | 9.81 | 1 | ||||||
| 339 | 12 37 06.12 | +62 17 11.9 | 18.73 | 39.99 | 10.27 | 10.35 | |||||||
| 345 | 12 37 06.96 | +62 08 30.1 | 25.05 | 42.33 | 11.34 | 10.77 | 1 | ||||||
| 346 | 12 37 07.18 | +62 16 42.6 | 24.28 | 40.98 | 9.82 | 10.42 | 1 | ||||||
| 349 | 12 37 07.56 | +62 19 56.1 | 25.94 | 42.68 | 11.17 | 10.71 | 1 | ||||||
| 351 | 12 37 07.70 | +62 16 16.0 | 22.79 | 41.60 | 11.37 | 10.98 | 1 | ||||||
| 353 | 12 37 08.33 | +62 10 55.9 | 20.39 | 40.83 | 11.46 | 9.83 | |||||||
| 359 | 12 37 09.68 | +62 08 41.1 | 22.74 | 41.65 | 12.15 | 11.11 | |||||||
| 370 | 12 37 12.12 | +62 17 53.9 | 24.02 | 42.77 | 11.27 | 10.78 | 1 | ||||||
| 378 | 12 37 14.33 | +62 12 21.2 | 24.47 | 41.39 | 10.77 | 10.52 | 1 | ||||||
| 381 | 12 37 14.77 | +62 16 17.0 | 24.02 | 43.07 | 13.00 | 10.80 | 1 | ||||||
| 383 | 12 37 15.94 | +62 11 58.3 | 18.36 | 39.29 | 9.05 | 10.05 | |||||||
| 387 | 12 37 16.19 | +62 11 30.5 | 24.80 | 41.64 | 9.77 | 10.68 | 1 | ||||||
| 388 | 12 37 16.35 | +62 15 12.6 | 21.04 | 40.19 | 9.44 | 10.46 | 3 | ||||||
| 392 | 12 37 16.82 | +62 10 07.9 | 20.77 | 40.54 | 10.91 | 10.45 | |||||||
| 418 | 12 37 25.57 | +62 19 42.9 | 18.49 | 40.39 | 11.23 | 10.18 | |||||||
| 425 | 12 37 27.71 | +62 10 34.3 | 18.20 | 38.65 | 9.42 | 9.13 | |||||||
| 432 | 12 37 31.73 | +62 17 03.7 | 24.05 | 42.70 | 11.14 | 9.54 | 1 | ||||||
| 433 | 12 37 32.28 | +62 12 46.7 | 22.95 | 41.65 | 11.45 | 11.15 | |||||||
| 435 | 12 37 34.10 | +62 11 39.6 | 19.60 | 40.03 | 10.59 | 9.48 | |||||||
| 437 | 12 37 34.55 | +62 13 56.3 | 21.69 | 42.46 | 11.32 | 10.79 | 1 | ||||||
| 446 | 12 37 37.14 | +62 12 05.3 | 19.42 | 40.59 | 10.91 | 10.40 | |||||||
| 453 | 12 37 39.74 | +62 13 38.0 | 22.43 | 42.11 | 11.01 | 10.96 | 1 | ||||||
| 454 | 12 37 39.82 | +62 17 02.3 | 21.02 | 41.49 | 9.75 | 10.25 | 3 | ||||||
| 455 | 12 37 40.96 | +62 12 00.7 | 22.36 | 43.72 | 11.53 | 11.23 | 1 | ||||||
| 476 | 12 37 54.62 | +62 18 40.9 | 23.66 | 40.97 | 9.61 | 9.60 | 1 | ||||||
| 493 | 12 38 17.48 | +62 16 10.4 | 23.52 | 42.96 | 12.52 | 10.81 | 1 |
-
The columns are: 1: identification number in the Alexander et al. (2003) catalogue; 2: right ascension of the X-ray source; 3: declination of the X-ray source; 4: optical -band magnitude; 5: flux in micro-Jy; 6: flux in micro-Jy; 7: flux in micro-Jy; 8: flux in micro-Jy; 9: flux in micro-Jy; 10: 0.5-2 keV luminosity; 11: total IR luminosity in units of solar luminosity ; 12: stellar mass in solar units; 13: redshift, the superscripts mark soources with photometric redshifts; 14: X-ray source type from Bauer et al. (2004), “1” is for “optimistic” sample and “3” corresponds to the “secure” sample. The indicates sources in the “normal galaxy” samples, i.e. they scatter from the X-ray/infrared luminosity relation of local star-forming galaxies. dominated by star-formation.
8 Acknowledgments
We thank the anonymous referee for helpful comments that improved this manuscript. AG acknowledges financial support from PPARC and the Marie-Curie Fellowship grant MEIF-CT-2005-025108. This work is based on observations made with the Spitzer Space Telescope, which is operated by the Jet Propulsion Laboratory, California Institute of Technology under a contract with NASA. We acknowledge use of the Team Keck Treasury Redshift Survey (TKRS; http://www2.keck.hawaii.edu/science/tksurvey/).
References
- [1] Alexander D. M. et al., 2003, AJ, 126, 539
- [2] Alexander D. M., Aussel H., Bauer F. E., Brandt W. N., Hornschemeier A. E., Vignali C., Garmire G. P., Schneider D. P., 2002, ApJ, 568, 85L
- [3] Babbedge T. S. R., et al., 2006, MNRAS, 370, 1154
- [4] Babbedge, T. S. R, et al., 2004, MNRAS, 353, 654
- [5] Barger A. J., Cowie L. L., Wang W.-H., 2007, ApJ, 654, 764
- [6] Barger, A. J. et al. 2003, AJ, 126, 632
- [7] Bauer, F.E., Alexander, D.M., Brandt, W.N., Schneider, D.P., Treister, E., Hornschemeier, A.E., Garmire, G.P., 2004, AJ, 128, 2048
- [8] Bauer F. E., Alexander D. M., Brandt W. N., Hornschemeier A. E., Vignali C., Garmire G. P., Schneider D. P., 2002, AJ, 124, 2351
- [9] Belczynski K., Kalogera V., Rasio F. A., Taam R. E., Zezas A., Bulik T., Maccarone T. J., Ivanova N., 2007, ApJS, submitted, astro-ph/0511811
- [10] Belczynski K., Kalogera V., & Bulik T., 2002, ApJ, 572, 407
- [11] Brandt W. N., Hornschemeier A. E., Schneider D. P., Alexander D. M., Bauer F. E., Garmire G. P., Vignali C., 2001, ApJ, 558L, 5
- [12] Bruzual G., Charlot S., 2003, MNRAS, 344, 1000
- [13] Bundy K., Ellis R. S., Conselice C. J., 2005, ApJ, 625, 621
- [14] Capak P., et al., 2004, AJ, 127, 180
- [15] Chabrier G., 2003, ApJ, 586, 133L
- [16] Dressler A., & Gunn J. E., 1992, ApJS, 78, 1
- [17] Dickinson, M., Giavalisco, M., and the GOODS Team, 2003, in ”The Mass of Galaxies at Low and High Redshift,” Proceedings of the ESO Workshop, Venice, Italy, 24-26 October 2001, eds. R. Bender & A. Renzini, p. 324, astro-ph/0204213.
- [18] Efstathiou A., Rowan-Robinson M., Siebenmorgen R., 2000, MNRAS, 313, 734
- [19] Efstathiou A., Rowan-Robinson M., 1995, MNRAS, 273, 649
- [20] Ellis & O’Sullivan, 2006, MNRAS, 367, 627
- [21] Fabbiano, G. 1995, American Astronomical Society, 186th AAS Meeting, Bulletin of the American Astronomical Society, Vol. 27, p.877
- [22] Georgakakis A. E., Chavushyan V., Plionis M., Georgantopoulos I., Koulouridis E., Leonidaki I., Mercado A., 2006a, MNRAS, 367, 1017
- [23] Georgakakis A., Georgantopoulos I., Akylas A., Zezas A., Tzanavaris P., 2006b, ApJ, 641L, 101
- [24] Georgakakis A., Georgantopoulos I., Stewart G. C., Shanks T., Boyle B. J., 2003, MNRAS, 344, 161
- [25] Georgantopoulos I., Zezas A., Ward M. J., 2003, ApJ, 584, 129
- [26] Georgantopoulos I., Georgakakis A., Koulouridis E., 2005, ApJ, 624, 135
- [27] Ghosh P. & White N. E., 2001, ApJ, 559, 97L
- [28] Gilfanov M., 2004, MNRAS, 349, 146
- [29] Grimm H.-J., Gilfanov M., Sunyaev R., 2003, MNRAS, 339, 793
- [30] Gordon K. D., Clayton G. C., Misselt K. A., Landolt A. U., Wolff M. J., 2003, ApJ, 594, 279
- [31] Goto T., 2006, MNRAS, 369, 1765
- [32] Helou G., Khan I. R., Malek L., Boehmer L., 1988, ApJS, 68, 151
- [33] Hopkins, A., 2004, ApJ, 615, 209
- [34] Hornschemeier A. E., Heckman T. M., Ptak A. F., Tremonti C. A., Colbert E. J. M., 2005, AJ, 129, 86
- [35] Hornschemeier A. E. et al., 2003, AJ, 126, 575
- [36] Hornschemeier A. E., Brandt W. N., Alexander D. M., Bauer F. E., Garmire G. P., Schneider D. P., Bautz M. W., Chartas G., 2002, ApJ, 568, 82
- [37] Hornschemeier A. E., et al., 2000, ApJ, 541, 49
- [38] Kim D. W., et al., 2006, ApJ, 644, 829
- [39] Laird E. S., Nandra K., Adelberger K. L., Steidel C. C., Reddy N. A., MNRAS, 2005, 359, 47
- [40] Laird E. S., Nandra K., Hobbs A., Steidel C. C., MNRAS, 2006, 373, 217
- [41] Lilly S. J., Le Fevre O., Hammer F., Crampton D., 1996, ApJ, 460 ,1L
- [42] Moran E. C., Lehnert M. D., Helfand D. J. 1999, ApJ, 526, 649
- [43] Moran E., Filippenko A. V., Chornock R., 2002, ApJ, 579L, 71
- [44] Nandra K., et al., 2002, ApJ, 576, 625
- [45] Norman C., et al., 2004, ApJ, 607, 721
- [46] O’Sullivan E., Forbes Duncan A., Ponman Trevor J., 2001, MNRAS, 324, 420
- [47] Persic M., Rephaeli Y., Braito V., Cappi M., Della Ceca R., Franceschini A., Gruber D. E., 2004, A&A, 419, 849
- [48] Peterson K. C., Gallagher S. C., Hornschemeier A. E., Muno M. P., Bullard, E. C., 2006, AJ, 131, 133
- [49] Ranalli P., Comastri A., Setti G., 2005, A&A, 440, 23
- [50] Ranalli, P., Comastri, A. Setti, G., 2003, A&A, 399, 39
- [51] Read A. M., Ponman T. J., 2001, MNRAS, 328, 127
- [52] Rowan-Robinson M., et al., 2005, AJ, 129, 1183
- [53] Rowan-Robinson M., 2003, MNRAS, 345, 819
- [54] Rowan-Robinson M., 1995, MNRAS, 272, 737
- [55] Rowan-Robinson M., Benn C. R., Lawrence A., McMahon R. G., Broadhurst T. J., 1993, MNRAS, 263, 123
- [56] Sipior, M. S. 2003, PhD Thesis, The Pennsylvania State University
- [57] Takeuchi T. T., Buat V., Iglesias-Páramo J., Boselli A., Burgarella D., 2005, A&A, 432, 423
- [58] Takeuchi T. T., Yoshikawa K., Ishii T. T., 2003, ApJ, 587L, 89
- [59] Tzanavaris P., Georgantopoulos I., Georgakakis A., 2006, A&A, 454, 447
- [60] Zezas A. L., Georgantopoulos I., Ward M. J., 1998, MNRAS, 301, 915
- [61] Yan R., Newman J. A., Faber S. M., Konidaris N., Koo D., Davis M., 2006, ApJ, 648, 281
- [62] Van Bever J., Vanbeveren D., 2000, A&A, 358, 462
- [63] Verbunt F. & Nelemans G. 2001, Class. Quantum Grav., 18, 4005
- [64] Wilson G., Cowie L. L., Barger A. J., Burke D. J., 2002, AJ, 124, 1258