Photometry of VS0329+1250:
A New, Short-Period SU Ursae Majoris Star
Abstract
Time-resolved CCD photometry is presented of the recently-discovered ( at maximum light) eruptive variable star in Taurus, which we dub VS0329+1250. A total of 20 hr of data obtained over six nights reveals superhumps in the light curves, confirming the star as a member of the SU UMa class of dwarf novae. The superhumps recur with a mean period of 0.053394(7) days (76.89 min), which represents the shortest superhump period known in a classical SU UMa star. A quadratic fit to the timings of superhump maxima reveals that the superhump period was increasing at a rate given by over the course of our observations. An empirical relation between orbital period and the absolute visual magnitude of dwarf novae at maximum light, suggests that VS0329+1250 lies at a distance of kpc.
1 Introduction
The SU UMa stars are a subclass of the dwarf novae that are observed at orbital periods, hr (for reviews see Warner 1995, Osaki 1996). These systems usually display two types of outburst: normal dwarf nova outbursts, and “superoutbursts”, which are the defining characteristic of the SU UMa stars. Superoutbursts are usually brighter (by mag), and always last longer (weeks vs. days), compared to normal outbursts. During superoutbursts, the SU UMa stars always display mag modulations in their light curves called “superhumps”, which have been attributed to the prograde precession of an eccentric accretion disk in these systems (Whitehurst 1988). The shortest period SU UMa systems that display particularly large superoutburst amplitudes ( mag), long intervals between eruptions ( yrs), and light curve modulations near the orbital period early in the outburst (so called “early superhumps”) are sometimes referred to as the WZ Sge stars (Bailey 1979, Kato et al. 2001).
VS0329+1250 was discovered as an optical transient on 26 October 2006 as part of a comet and asteroid search program (PIKA) conducted with the Crni Vrh 0.6-m Cichocki telescope (Skvarc 2006). Follow-up observations reported in Skvarc (2006) revealed a 0.2 mag modulation with a period of days, which led to the suggestion that the variations were superhumps, and that the object was likely a previously unknown SU UMa dwarf nova.
In this paper we present time-resolved V-band photometry of VS0329+1250 originally reported in Shafter et al. (2006) that has enabled us to confirm the object as an SU UMa dwarf nova, to estimate its distance, and to establish a revised superhump period, which is the shortest currently known among the classical SU UMa stars.
2 Observations
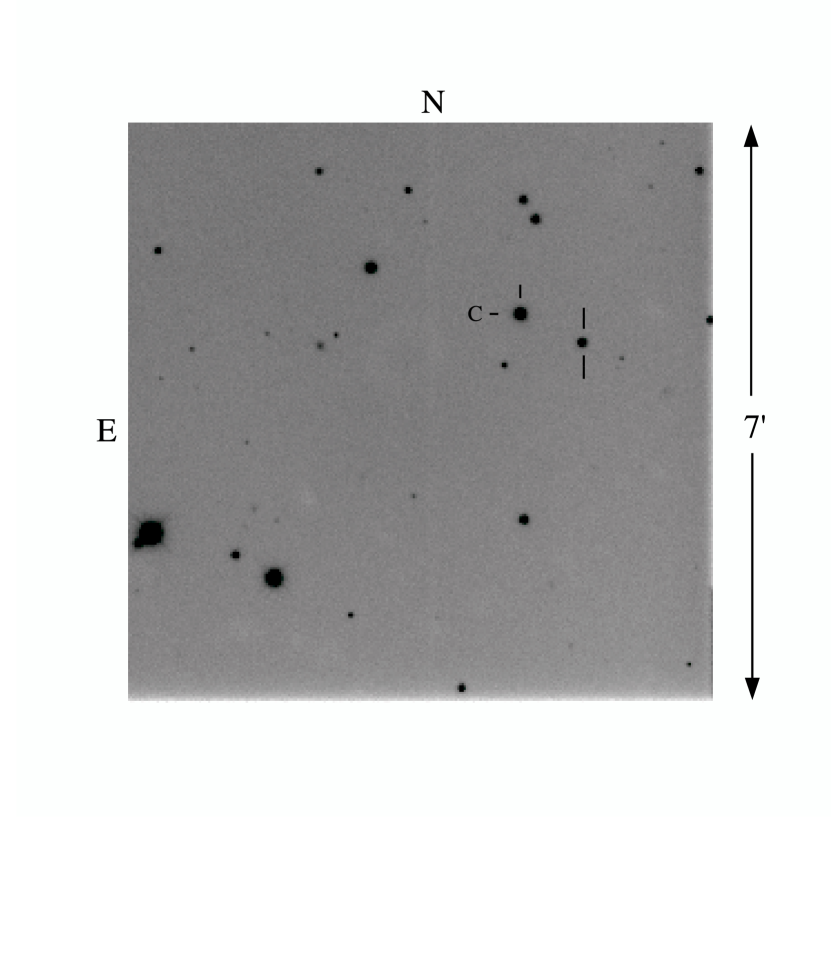
A finding chart for VS0329+1250 (in outburst) is shown in Figure 1, with the coordinates taken from Skvarc (2006). Observations were carried out during six nights in 2006 October and November using the Mount Laguna Observatory 1 m reflector. On each night a series of exposures (typically 60 s) were taken through a Johnson-Cousins filter (see Bessel 1990), and imaged on a Loral CCD. To increase the time-sampling efficiency, only an subsection of the full array was read out. The subsection was chosen to include VS0329+1250 and several relatively bright nearby stars to be used as comparison objects for differential photometry. A summary of observations is presented in Table 1.
The data were processed in a standard fashion (bias subtraction and flat-fielding) using IRAF.111 IRAF (Image Reduction and Analysis Facility) is distributed by the National Optical Astronomy Observatories, which are operated by AURA, Inc., under cooperative agreement with the National Science Foundation. The individual images were subsequently aligned to a common coordinate system and instrumental magnitudes for VS0329+1250 and two nearby comparison stars were then determined using the IRAF APPHOT package. Variations in atmospheric transparency were removed to first order by dividing the flux of VS0329+1250 by a nearby comparison star located approximately E and N of the variable (star “C” in Fig. 1). The -band differential light curves were then placed on an absolute scale by calibration of the comparison star against the standard stars in Landolt (1992). The magnitude of the comparison star is characterized by and . The calibrated light curves of VS0329+1250 are displayed in Figure 2. In addition to the -band data, a few measurements were obtained through a filter at the end of our sequence on 29-Oct-06 UT in order to estimate the color of VS0329+1250. We find at the time of superhump minimum.
3 The Superhump Period
During the six nights of observation, we observed a total of 16 superhump maxima. The timings of maximum light were obtained from the point of intersection of straight line segments fitted by eye to the ascending and descending portions of the hump profile. The accuracy of our timings degraded over time as the hump morphology changed from a symmetrical “sawtooth” shape early on to a more asymmetrical and less defined profile, as the hump amplitude diminished. We estimate the timings of maximum, given in Table 2, to be generally accurate to better than min, with the timings for the last night of observation somewhat more uncertain.
A linear least-squares fit of the superhump maxima from Table 2 yields the following ephemeris for superhump maximum in VS0329+1250:
| (1) |
Residuals of the individual timings with respect to eqn (1) are included in Table 2, and are plotted as a function of cycle number in Figure 3. Despite the considerable scatter, a trend with cycle number is evident, which suggests that the superhump period increased during the course of our observations. A quadratic fit to the residuals, shown by the solid line in Figure 3, gives . The mean superhump period of 0.053394 d (76.89 min) is slightly shorter than that of TSS J022216.4+412259.9 (Imada et al. 2006), which had previously held the record as the SU UMa system with the shortest known superhump period222The unusual dwarf novae V485 Cen (Olech 1997) and EI Psc (Oemura et al. 2002a) have shorter periods, but it is not yet clear how they are related to the classical SU UMa stars (e.g. Oemura 2002b).
For many years it was thought that the superhumps in SU UMa stars were characterized by , with the superhump period drifting lower as the outburst evolved (Warner 1985, Patterson et al. 1993). However, the situation changed about a decade ago with the discovery of an apparently stable superhump period during an outburst of AL Com (Howell et al. 1996, Patterson et al. 1996), and a period increase during an outburst of SW UMa (Semeniuk et al. 1997; Nogami et al. 1998). With the discovery of several new SU UMa stars in recent years, it has now been clearly established that among the shortest period systems, such as VS0329+1250, increases in the superhump period are usually observed (e.g. Imada et al. 2005, Uemura et al. 2005, and references therein). It has been proposed that the period increases seen in the shortest period SU UMa stars with extreme mass ratios may result from a tidal resonance radius well inside the primary’s Roche lobe that enables the eccentric disk wave to propagate outwards (Baba et al. 2000).
The superhump periods in SU UMa stars are usually longer than the orbital periods, with the “period excess”, defined as , generally increasing linearly with (Stolz & Schoembs 1984, Patterson 1998). The relationship becomes less well defined at the shortest orbital periods, where typically lies in the range . At present, the period excess for VS0329+1250 cannot be computed precisely because the orbital period of the system has not yet been directly measured. Nevertheless, if VS0329+1250 has a period excess typical of SU UMa stars with similar superhump periods, we estimate that the orbital period, min. Once the orbital period is measured, and a precise value of determined, it will become possible to begin to explore the structure and evolutionary state of the VS0329+1250 system using existing empirical and theoretical relationships between the period excess and mass ratio (e.g. Patterson 2001, Patterson et al. 2005, Pearson 2006).
4 The Distance to VS0329+1250
We can make a rough estimate of the distance to VS0329+1250 by appealing to the empirical relation between the orbital period and absolute magnitude of dwarf novae at maximum light given by Warner (1987). For normal dwarf nova eruptions Warner finds . Given a period of 1.27 hr, we estimate , where the assumed uncertainty reflects the effect of the unknown orbital inclination on the absolute magnitude of the system. Since the outburst of VS0329+1250 presented here is the only recorded outburst of the system, the peak magnitude of a normal outburst (assuming VS0329+1250 exhibits normal outbursts) is not known. For our purposes, we will assume a normal outburst magnitude that is 0.5 mag fainter than the superoutburst maximum, which is typical of SU UMa stars. Thus, we adopt for VS0329+1250 based upon the observed superoutburst maximum of (Skvarc 2006). The high Galactic latitude of VS0329+1250 () suggests that the interstellar extinction to the object is likely to be negligible. Thus, we estimate that VS0329+1250 lies at a distance, kpc. The fact that VS0329+1250 is not visible on the POSS or the DSS reveals that the eruption amplitude, mag, which is typical of the shortest period SU UMa stars (WZ Sge stars), and suggests that .
5 Conclusions
We have presented six nights of time-resolved V-band CCD photometry of the eruptive variable star, VS0329+1250, recently discovered by Skvarc (2006). Our principal conclusions are as follows:
1) Superhumps are seen in the light curves of VS0329+1250 that recur with a period d, clearly establishing the system as a member of the SU UMa class of dwarf novae. The superhump period is the shortest of any known SU UMa system, with the possible exception of the dwarf novae V385 Cen and EI Psc, whose relationship to the classical SU UMa systems is unclear.
2) VS0329+1250 faded by about 0.08 mag per day from a mean magnitude of on our first night of observation (2 days post discovery) to six nights later, at which time the superhumps had nearly disappeared.
3) The superhump timings are consistent with an increasing period over the week spanned by our observations, with .
4) Using Warner’s (1987) empirical relation between the absolute visual magnitude of dwarf novae at maximum light and orbital period, we estimate a distance to VS0329+1250 of kpc.
Future observations will be required to firmly establish the nature of VS0329+1250, and to determine if it should be included as a member of the WZ Sge stars. Specifically, the system should be monitored for subsequent outbursts that will establish the outburst recurrence time. More extensive photometry during future superoutbursts should help to better characterize the stability of the superhump period. Finally, a single deep image of the field should be attempted to measure the quiescent magnitude of VS0329+1250, and thereby establish its outburst amplitude.
References
- (1)
- (2) Baba, H., et al. 2000, PASJ, 52, 429.
- (3)
- (4) Bailey, J. 1979, MNRAS, 189, 41P.
- (5)
- (6) Bessel, M. S. 1990, PASP, 102, 1181.
- (7)
- (8) Howell, S. B., et al. 1996, AJ, 111, 2367.
- (9)
- (10) Imada, A., et al. 2005, PASJ, 57, 193.
- (11)
- (12) Imada, A., et al. 2006, PASJ, 58, L23.
- (13)
- (14) Kato, T., Sekine, Y., and Hirata, R. 2001, PASJ, 53, 1191.
- (15)
- (16) Landolt, A. U. 1992, AJ, 104, 340.
- (17)
- (18) Nogami, D., et al. 1998, PASJ, 50, 405.
- (19)
- (20) Olech, A. 1997, AcA, 47, 281.
- (21)
- (22) Osaki, Y. 1996, PASP, 108, 390.
- (23)
- (24) Patterson, J. 1998, PASP, 110, 1132.
- (25)
- (26) Patterson, J. 2001, PASP, 113, 736.
- (27)
- (28) Patterson, J., et al. 1996, PASP, 108, 748.
- (29)
- (30) Patterson, J., Bond, H. E., Grauer, A. D., Shafter, A. W., & Mattei, J. A. 1993, PASP, 105, 69.
- (31)
- (32) Patterson, J., et al. 2005, PASP, 117, 1204.
- (33)
- (34) Pearson, K. J. 2006, MNRAS, 371, 235.
- (35)
- (36) Semeniuk, I, Olech, A., Kwast, T., & Należyty, M. 1997, AcA, 47, 201.
- (37)
- (38) Shafter, A. W., Coelho, E. A., & Reed, J. K. 2006, ATel #938.
- (39)
- (40) Skvarc, J. 2006, CBET, #701.
- (41)
- (42) Stolz, B., & Schoembs, R. 1984, A&A, 132, 187.
- (43)
- (44) Uemura, M., et al. 2002a, PASJ, 54, L15.
- (45)
- (46) Uemura, M., et al. 2002b, PASJ, 54, 599.
- (47)
- (48) Uemura, M., et al. 2005, A&A, 432, 261.
- (49)
- (50) Warner, B. 1985, in Interacting Binaries, ed. P. P. Eggleton & J. E. Pringle (Dordrecht: D. Reidel Publishing Company), 367.
- (51)
- (52) Warner, B. 1995, Cataclysmic Variable Stars, Cambridge Univ. Press.
- (53)
- (54) Warner, B. 1987, MNRAS, 227, 23.
- (55)
- (56) Whitehurst, R. 1988, MNRAS, 232, 35.
- (57)
| UT Time | Time ResolutionaaMean time interval between exposures (integration time plus readout time) | Number of | ||
|---|---|---|---|---|
| UT Date | (start of observations) | (sec) | Exposures | Filter |
| 2006 Oct 28 | 06:30:02.5 | 38.32 | 100 | V |
| 2006 Oct 29 | 05:33:00.0 | 65.43 | 372 | V |
| 2006 Oct 29 | 12:20:00.0 | 65.43 | 3 | B |
| 2006 Oct 30 | 04:45:08.4 | 65.43 | 330 | V |
| 2006 Nov 01 | 05:12:00.0 | 65.43 | 92 | V |
| 2006 Nov 02 | 07:45:00.0 | 65.43 | 130 | V |
| 2006 Nov 03 | 06:21:00.0 | 65.43 | 130 | V |
| HJD (peak) | Cycle Number | |
|---|---|---|
| (2,450,000+) | ( day) | |
| 4036.8146… | 0 | |
| 4037.7749… | 18 | |
| 4037.8272… | 19 | |
| 4037.8809… | 20 | |
| 4037.9355… | 21 | |
| 4037.9885… | 22 | |
| 4038.7357… | 36 | |
| 4038.7894… | 37 | |
| 4038.8432… | 38 | |
| 4038.8947… | 39 | |
| 4038.9492… | 40 | |
| 4040.7634… | 74 | |
| 4041.8311… | 94 | |
| 4041.8856… | 95 | |
| 4042.7940… | 112 | |
| 4042.8493… | 113 |