Vol. 7 (2007), No. 2, 000–000
11institutetext: Department of Physics, Tianjin Normal University, Tianjin 300074
22institutetext: National Astronomical Observatories, Chinese Academy of Sciences, Beijing
100012;
hwu@bao.ac.cn
\vs\noReceived 2006 April 18; accepted 2006
June 7
Mid-to-Far Infrared Spectral Energy Distribution of Galaxies in Spitzer First Look Survey Field ∗ 00footnotetext: Supported by the National Natural Science Foundation of China.
Abstract
We made model fitting to the mid-to-far infrared spectral energy distributions (SEDs) for different categories of galaxies in the main extragalactic field of the Spitzer First Look Survey with the aid of spectroscopic information from the Sloan Digital Sky Survey. We find that the mid-to-far infrared SEDs of HII galaxies, mixture type galaxies and LINERs can be well fitted by the one-parameter () dust model of Dale et al. plus the 13 Gyr dust-free elliptical galaxy model. The statistics of values indicates that all these galaxies tend to be quiescent, although the HII galaxies are relatively more active than the LINERs. The mid-infrared SEDs of absorption galaxies are well fitted simply by the 13 Gyr dust-free elliptical galaxy template, and the near-to-mid infrared SEDs of QSOs can be represented by AGN NGC 5506.
keywords:
galaxies: general – infrared: galaxies – galaxies: active – galaxies: statistics1 Introduction
To understand the star formation process, it is essential to investigate the infrared spectral energy distributions (SEDs) of galaxies (Sajina et al. 2006). The mid-to-far infrared emission powered by either stars or AGNs is generated by dust reprocessing and contributes from a few percent to more than 95 percent of the total energy output (Xilouris et al. 2004; Soifer et al. 1984; Dale et al. 2005). Infrared emission is much important at higher redshift where star formation is more frequent. The infrared SEDs can help to understand the cosmic infrared background (Dale et al. 2001) and provide information about the galaxy evolution as well. However, the detection limit in infrared bands prevents us from exploiting the infrared SEDs of normal galaxies at higher redshifts, hence the infrared SEDs of normal galaxies can only be obtained for the local Universe.
Rowan-Robinson et al. (2004) presented three to four bands rest-frame infrared SEDs of several tens of galaxies from the final band-merged European Large-Area ISO Survey (ELAIS) catalog at 6.7, 15, 90 and 175 m. All the infrared SEDs can be fitted by cirrus, starburst (M82), ultraluminous infrared galaxy (Arp220) and active galactic nuclei (AGN) dust torus models. Dennefeld et al. (2005) identified 28 170 m sources from FIRBACK N1 ISO survey and obtained the SEDs from the mid-infrared to submilimeter bands. They found that the M82 template failed to fit FIRBACK sources, instead, most FIRBACK sources could be well fitted by the normal galaxy template (cold galaxies) from Lagache et al. (2003). Some of sources can be well fitted by the one parameter dust model (Dale et al. 2001) with 1.6, indicating dominance of the quiescent component. They concluded that most of the identified FIRBACK sources are quiescent star-forming galaxies, rather than starbursters.
The Infrared Array Camera (IRAC: Fazio et al. 2004) and the Multiband Imaging Photometer of Spitzer (MIPS: Rieke et al. 2004) instruments are designed for covering the range from the mid-infrared to far-infrared bands and can provide the highest sensitivity and resolution in mid-infrared (about 2 in IRAC images and 6 in MIPS 24 m image). The successful launch of Spitzer Space Telescope (Werner et al. 2004) provides a new opportunity to explore the mid-to-far infrared SEDs of a larger number of galaxies. With the new data from Spitzer Legacy Program SWIRE (Lonsdale et al. 2003), Rowan-Robinson et al. (2005) modeled the SEDs of selected ELAIS sources in N1 field with cirrus, M82, Arp220 and AGN dust torus models. Dale et al. (2005) provided 1–850 m SEDs of 75 galaxies from the Spitzer Infrared Nearby Galaxies Survey (SINGS, Kennicutt et al. 2003), from the data of Spitzer, 2MASS, ISO, IRAS and SCUBA. They successfully fitted the SEDs with the one parameter dust model (Dale et al. 2001).
Although the infrared SEDs of many galaxies can be well fitted by Rowan-Robinson et al. (2004,2005) and Lagache et al. (2003), their models are based on the SEDs of representative objects such as M82 and Arp 220. Thus, these models could not provide further quantitative analysis. Therefore, it is necessary to construct a more quantitative model. Dale et al. (2001) introduced a one-parameter dust model which can describe the infrared SEDs in a simple and a quantitative way. Dale & Helou (2002) extended the empirical calibration to long wavelength by new far-infrared and submilimeter data. In this model, a parameter , representing the activity of the galaxy, characterizes the shape of the infrared SEDs. To quantitatively explore the infrared properties of galaxies with different optical spectral types, we adopt the dust radiation model of Dale et al. (2001) in this work.
The structure of present work is as follows. In Section 2 we describe the sample, data reduction and optical spectral classification. The mid-to-far infrared SEDs of sample galaxies and corresponding fitting are given in Section 3. Results and discussion are presented in Section 4 and conclusions are drawn in Section 5. Throughout this paper we adopt a cosmology with a matter density parameter =0.3, a cosmological constant =0.7 and a Hubble constant of =70 km s-1Mpc-1.
2 The Sample and Spectral Classification
2.1 The Sample
The galaxy sample was taken from the extragalactic component of the main field of the Spitzer Space Telescope (Werner et al. 2004) First Look Survey (xFLS). Observations covering the survey areas were made with both IRAC (Lacy et al. 2005) and MIPS (Frayer et al. 2006). The overlap area of xFLS imaged by both IRAC and MIPS is about 3.7 degree2. The BCD (Basic Calibrated Data) images of IRAC four bands were obtained from Spitzer Sciences Center, which include flat-field corrections, dark subtraction, linearity and flux calibrations (Fazio et al. 2004). The IRAC images (in all four IRAC bands: 3.6, 4.5, 5.8 and 8.0 m) were mosaicked from the BCD images after pointing refinement, distortion correction and cosmic-ray removal with the final pixel scale of 0.6 as described by Huang et al. (2004) and Wu et al. (2005); whilst the MIPS 24 m images were mosaicked in a similar way with the final pixel scale of 1.22′′. Matching the sources detected by SExtractor (Bertin & Arnouts 1996) in five bands (IRAC four bands and MIPS 24 m band ) with the 2MASS sources, we derived an astrometric uncertainty of 0.1.
As this area has also been covered by the Sloan Digital Sky Survey (SDSS: Stoughton et al. 2002), the xFLS sources were then matched with all the galaxies with SDSS spectroscopic observations with a radius of 2 . Finally, a sample of 315 sources were obtained, which includes 270 galaxies and 45 QSOs (including Seyfert 1s). The ”AUTO” magnitudes (from SExtractor) were adopted to represent the total magnitudes of all the sample galaxies in IRAC four bands and MIPS 24 m band. The IRAC and MIPS 24 m bands have flux calibration accuracies better than 10% (Fazio et al. 2004; Rieke et al. 2004). The matched MIPS 70 m and 160 m fluxes (with a radius of 5) of all these sources were taken from Frayer et al.’s (2006) catalog and have a signal-to-noise ratio better than 7. Here, 79 of 270 galaxies and 8 of 45 QSOs have obtained 70 m fluxes; whilst 40 galaxies and only one QSOs have obtained 160 m fluxes. The absolute flux uncertainties of these two bands are 15% and 25%, respectively.
2.2 Spectral Classification
Before the spectral classification we carried out the extinction correction, including the foreground extinction of the Milky Way and the intrinsic extinction of the galaxy itself. The Milky Way extinction is corrected by the parameterized curve of Calzetti et al. (2000) and the intrinsic extinction is derived from the Balmer decrement (Calzetti 2001). Here, we adopted intrinsic ratios for HII galaxies and for AGNs (Veilleux & Osterbrock 1987; Wu et al. 1998). The optical spectra were obtained with 3\arcsecaperture fibers (Stoughton et al. 2002) and the corresponding fluxes of the emission lines were taken from the SDSS catalog of measured line fluxes (Tremonti et al. 2004, version 5.0 4).
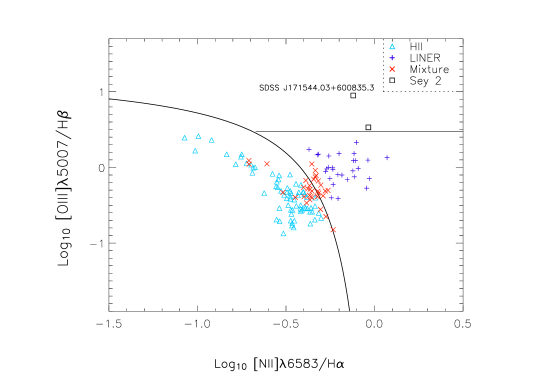
The spectral classification of galaxies is based on the traditional line-diagnostic diagram [NII]/H versus [OIII]/H (Veilleux & Osterbrock 1987), which is parameterized by Kauffmann et al. (2003). To derive a reliable spectral classification, we only dealt with galaxies with relative strong H emission (EQW(H, here, the negative value represents the emission line) and enough signal-to-noise (). If a source position is close to the boundary between HII galaxies and LINERs on the diagnostic diagram with the separation less than one sigma, we classified it as a mixture type galaxy (see Wu et al. 1998). The diagnostic diagram of the sample galaxies is shown in Figure 1. The galaxies with H absorption line were treated as absorption galaxies. Most of them are early type galaxies. Finally we obtained 69 HII galaxies, 28 LINERs, 2 Seyfert 2s, 33 mixture types, 27 absorption galaxies and 45 QSOs. There are 111 unclassified galaxies, because of their relatively weak H emission or lower signal-to-noise ratio. It should be noted that the Seyfert 2 galaxy SDSS J171544.03+600835.3 marked in Figure 1 is a spectral double-peak galaxy with a velocity separation of about 300 km s-1. Since its fluxes are not given in Tremonti et al.’s (2004) catalog, we measured the emission lines needed by Splot task in IRAF. During the measurement, we treat the double peak lines as one. In Table 1 we give the number of sources detected by either IRAC or MIPS bands for different spectral types of sources in xFLS.
2.3 The Mid-Infrared Color-Color Diagram
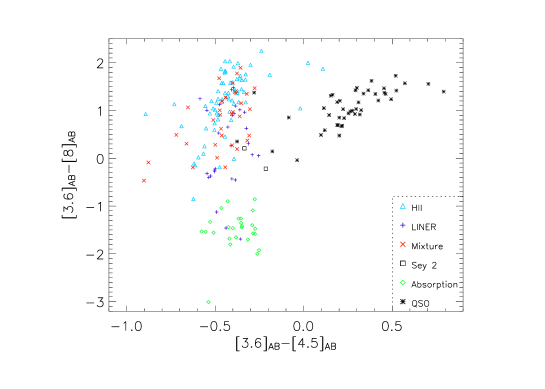
Figure 2 shows the mid-infrared color-color diagram ([3.6]–[4.5] vs. [3.6]–[8.0]) for all the classified galaxies. The magnitudes used here are in the AB magnitude system (Oke & Gunn 1983). It is clear from Figure 2 that all the QSOs are well separated from the other galaxies. This can be explained by the emission of QSOs at 3.6 m and 4.5 m being dominated by the power-law continuum from the dust torus of AGN, and the emission of normal galaxies at these two bands being dominated by the decreasing stellar continuum after the peak in near-infrared. Thus, the [3.6]–[4.5] colors of QSOs are much redder than those of normal galaxies. In fact, [3.6]–[4.5] color is one of the best parameters to select QSOs from galaxies (Hatziminaoglou et al. 2005). On the other hand, as the 8 m band covers the strongest 7.7 m PAH (polycyclic aromatic hydrocarbons) emission, the [3.6]–[8.0] color can roughly characterize the ratio of PAH emission to old stellar continuum. The stronger the PAH emission, the redder the [3.6]–[8.0] color. It is obvious from Figure 2 that the absorption galaxies are separated from all other galaxies in being located at the lower-left part of Figure 2. In contrast, all the other galaxies, such as HII galaxies, LINERs, mixture type galaxies and Seyfert 2s, are spread over a larger range of [3.6]-[8.0] color in upper part of Figure 2, indicating that they could have contribution from PAH emission more or less contrary to the early type galaxies.
Detailed properties of all the sample galaxies are analyzed from their SEDs in the following sections.
3 Spectral Energy Distribution
3.1 SED Templates
To understand the SEDs of the different types of galaxies in this sample, several model templates based on different radiation mechanisms are used. (1) Template of NGC 5506 is adopted as the template of QSOs. (2) The SED of 13 Gyr dust-free elliptical galaxy, which is obtained from GRASIL code (Silva et al. 1998), is adopted as the template of the absorption galaxies. (3) To describe the emission line galaxies, such as HII galaxies, LINERs, mixture types galaxies and even Seyfert 2s, a pure dust model plus an underlying stellar component are needed. Since the old stellar population dominates the mid-infrared stellar continuum emission in most normal galaxies, an SED of 13 Gyr dust-free elliptical galaxy is also adopted as the stellar component of emission line galaxy. Meanwhile, the one-parameter dust model (Dale et al. 2001) is used, with the one parameter defined essentially by the far-infrared color. One can construct a sequence of dust model templates with different power index . The parameter characterizes the shape of mid-to-far infrared SEDs and relates with the activity of the galaxy (Dale et al. 2001).
3.2 Fitting
We performed the model fitting to the observed mid-to-far infrared SED for each galaxy. To quantitatively analyze the contributions of various radiation components, we assumed that radiations of galaxies in these bands come from either one or a combination of these radiations. With the aid of well built SED template for each radiation component, a standard minimum can be carried out to obtain the best fitting. That is,
where and are the observed and model template fluxes at i-th band, c is a scale parameter related with the observed flux, p is the model parameter, which is the parameter in Dale et al.’s dust model, is the number of bands used, and is the observed error, which includes both random error and calibration error. The minimum of of a set of models was taken as the best fit of an observed SED.
3.3 Modeling the SEDs of Galaxies
The model templates described above cover the main components of radiations in mid-to-far infrared bands, i.e., radiations from old stellar population, dust (including PAH) or dust torus of AGN. Because our sample includes different types of galaxies, we will describe their SEDs, fitting processes and results of each type of galaxies, separately.
| HII | 69 | 69 | 61 | 46 | 20 |
|---|---|---|---|---|---|
| LINER | 28 | 28 | 24 | 13 | 5 |
| Mixture | 33 | 33 | 30 | 16 | 9 |
| Seyfert 2 | 2 | 2 | 2 | 1 | 0 |
| Absorption | 27 | 27 | 3 | 0 | 0 |
| Unclassified | 111 | 111 | 43 | 3 | 6 |
| QSO | 45 | 45 | 43 | 8 | 1 |
Almost all of the HII galaxies, LINERs, mixture type galaxies and Seyfert 2s have been detected in 24 m band (see Table 1). In contrast, because of the 7 limit of the MIPS catalog (Frayer et al. 2006), only about half of the target galaxies have 70 m fluxes (46 of 69 HII galaxies, 13 of 28 LINERs, 16 of 33 mixture types and 1 of 2 Seyfert 2s) and only a few galaxies have 160 m fluxes (20 HII galaxies, 5 LINERs, 9 mixture types). These detection statistics are shown in Table 1. We obtained the individual rest-frame SEDs and show some exemplar HII galaxies, LINERs, mixture types and Seyfert 2 galaxies in Figure 3.

During the model fitting we simply assumed that all the 3.6 m and 4.5 m fluxes come from the underlying stellar component. The first step was to obtain the model underlying stellar component based on the fitting to 3.6 m and 4.5 m fluxes. Then the method was used again to find the best dust model to the fluxes with the stellar component subtracted in the other bands. Note that we only did the fitting to galaxies with at least one far-infrared flux (either MIPS 70 m or 160 m band), because is used to characterize the shape of mid-to-far infrared SEDs, rather than that of only mid-infrared SEDs. The best fitting models are plotted as solid lines and the model stellar components are plotted as dotted lines, in Figure 3.
We can see from Figure 3 that the model generally represents well the mid-infrared PAH features and far-infrared dust continuum for the HII galaxies, LINERs and mixture types, except some deviation appearing at the long wavelength (160 m) in a few galaxies. This deviation can be explained by the lower weight (the larger error) of 160 m during the fitting. The SED of spectral double-peak Seyfert 2 galaxy, SDSS J171544.03+600835.3, can also be roughly fitted but with some deviation in the 70 m band. The low value of 1.38 indicates that this galaxy is very active, and possibly could be explained by its active nuclei.
Almost all of the absorption galaxies escaped detection by MIPS: only three of them were detected in the 24 m band (see Table 1). The rest-frame SEDs of all the absorption galaxies are plotted in Figure 4 and scaled by the rest-frame 3.6 m flux. Generally, their mid-infrared SEDs present small scatter and can be well fitted by a 13 Gyr dust-free elliptical galaxy (solid line in Fig. 4) synthesized from GRASIL (Silva et al. 1998). This indicates that these galaxies are dominated by the old stellar population in mid-infrared band with little dust contribution. The absorption galaxies present a much larger scatter in the longer wavelength ( 3 m) than in the short wavelength ( 3 m). This could be the result of weak dust emission, such as diffuse PAH emission.

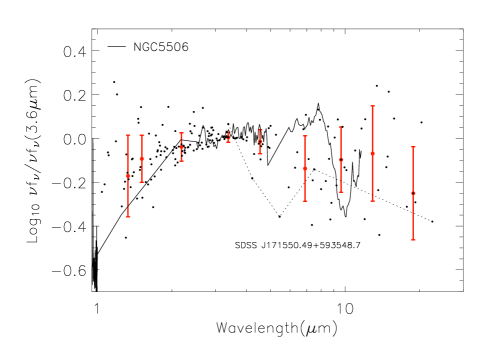
All except two QSOs were detected in the 24 m band, while only eight were detected at the 70 m band and one (SDSS J171550.49+593548.7) at the 160 m band. The low detection rate of QSOs in far-infrared bands may be because: (1) all QSOs except one (SDSS J171550.49+593548.7 with redshift 0.066) are far from us, with redshifts from 0.2 to 2.5; (2) QSOs are quite warm compared to normal galaxies; (3) the 7 limits of MIPS catalog (Frayer et al. 2006). The near-to-mid infrared SEDs of QSOs are plotted in Figure 5 scaled by rest-frame 3.6 m flux. The large dots with error bars in Figure 5 are the median values at the corresponding wavelength bins. At wavelengths longer than 1 m, the SEDs of QSOs are very flat except SDSS J171550.49+593548.7. In fact, SDSS J171550.49+593548.7 (dotted line) is a nearby Seyfert 1 galaxy with strong stellar continuum and PAH emission in mid-infrared. Since we do not have any representative infrared SEDs of QSOs, we only plot an AGN template of NGC 5506 (solid line in Fig. 5) as comparison.
4 Results and Discussion
4.1 Comparison with the Stellar Population Model with Different Age and Fitting Method
In the SED fitting, we adopted a 13 Gyr underlying stellar component model from GRASIL (Silva et al. 1998). However, our sample includes many disk galaxies, which are composed of both a young population with age about 1 Gyr and an old population. To investigate how the age of the stellar population model affects the fitting results, we compared our 13 Gyr stellar component model with a 900 Myr model from Vazquez & Leitherer (2005). We refitted the SEDs with the dust model plus a 900 Myr stellar component model, and derived an values that differed insignificantly from the previous ones. The mean difference of values of two age models is about 0.04 with a scatter of 0.04. Therefore, apparently, the model age does not affect our fitting.
We have assumed that both the IRAC 3.6 m and 4.5 m emissions were from the stellar component. As there may exist 3.3 m PAH emission in the IRAC 3.6 m band, it is necessary to explore the effect of such PAH emission on the fitting. We changed the fitting by only using 4.5 m flux to determine the stellar component, instead of using both 3.6 m and 4.5 m fluxes simultaneously, then refitted the dust model for all the emission line galaxies. The mean difference of best fitted values between the two methods for sample galaxies is 0.01 with a scatter of 0.03, which is negligible. It indicates that the 3.3 m PAH emission does not significantly affect our fitting, either.
4.2 The and Mid-To-Far Infrared Properties
Although Dale et al. (2001) introduced the one parameter dust model characterized by , they essentially defined the model by the far-infrared color. The index characterizes the distribution of dust mass as a power-law function of local heating intensity (Dale et al. 2005). It should relate with the mid-to-far infrared properties of galaxies.
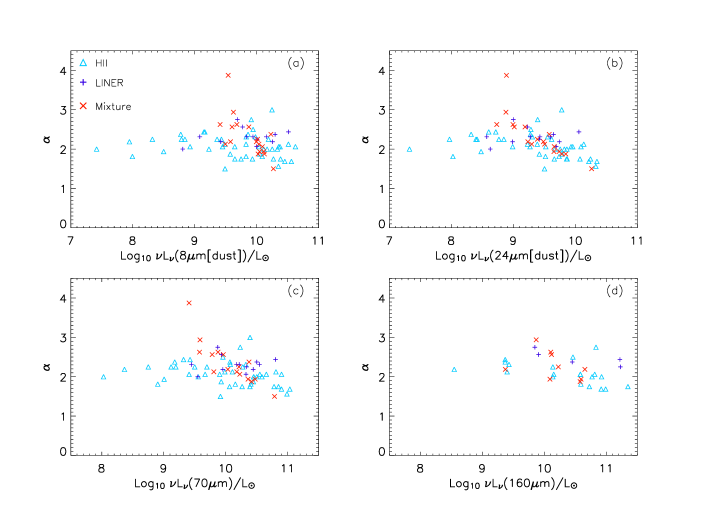
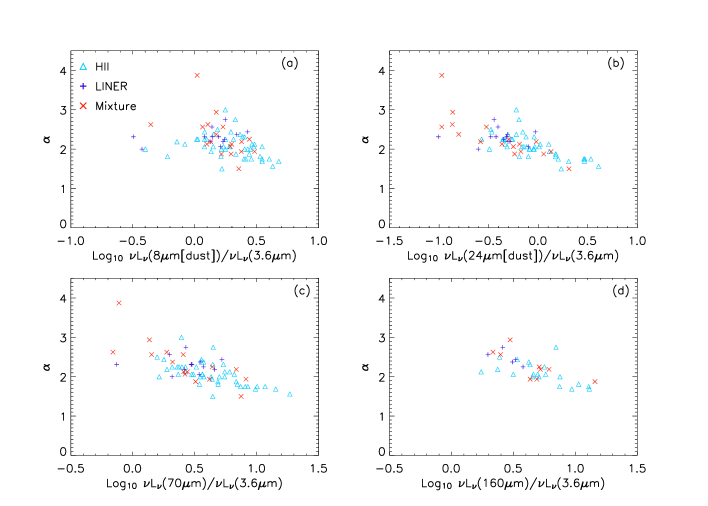
Figure 6 shows the values of different spectral types as a function of either mid-infrared or far-infrared dust emission luminosity. It is clear from all four panels of Figure 6 that there is no correlation, or just a weak one between and the mid- or far-infrared luminosities, for each category of sample galaxies. However, we can see from Figure 7 that there exist obvious correlations between and the ratios of mid- or far-infrared luminosities to the 3.6 m luminosities.
To quantitatively analyze all these correlations, we applied Spearman correlation analysis separately to the HII galaxies, LINERs, mixture types and the whole sample. The results are listed in Table 2. It is clear from Table 2 that the mid- and far-infrared luminosities are weakly correlated with for the HII galaxies (the null probability being less than 0.06) but the correlations between and the ratios of the infrared luminosities to the 3.6 m luminosity are much stronger. The probability of no-correlation is less than 0.004 or even smaller. Furthermore, the correlations are more tight for either the warm or cold dust continuum at 24 m, 70 m and 160 m than for the dust emission (dominated by PAH) at 8 m . It indicates that the parameter can describe well the shape of mid-to-far infrared SED. The K band luminosity, is dominated by old stellar population and has less reddening, we can also adopt the 3.6 m luminosity as a rough tracer of the stellar mass. Thus the ratios of mid-to-far infrared luminosities to the 3.6 m luminosity can be regarded as the dust emission intensity per unit mass. Therefore, the above strong correlations imply that the value is strongly related with the dust emission intensity rather than the total dust emission within the whole galaxy. One can also see from Table 2 there are no correlations for the LINERs (all the null probabilities except one are greater than 0.1). For the LINERs, the value does not depend on either the absolute or relative mid-to-far infrared dust emission, this implies that LINERs are different from HII galaxies in the mid-to-far infrared range. As to the mixture types, the correlation analysis shows that their degrees of correlation are intermediate between those of HII galaxies and LINERs. Taken as a whole, the sample galaxies show the same degrees of correlation as the HII galaxies.
| HII | LINER | Mixture | Whole | |||||
|---|---|---|---|---|---|---|---|---|
| Prob (null) | Prob (null) | Prob (null) | Prob(null) | |||||
| –0.280 | 5.7e–02 | 0.204 | 5.0e–01 | –0.658 | 4.1e–03 | –0.228 | 4.6e–02 | |
| –0.457 | 1.3e–03 | 0.053 | 8.6e–01 | –0.935 | 3.9e–08 | –0.507 | 2.6e–06 | |
| –0.389 | 7.6e–03 | 0.075 | 8.1e–01 | –0.832 | 1.2e–04 | –0.343 | 2.7e–03 | |
| –0.639 | 2.4e–03 | -0.900 | 3.7e–02 | –0.412 | 2.7e–01 | –0.463 | 5.9e–03 | |
| –0.416 | 3.7e–03 | 0.390 | 1.9e–01 | –0.557 | 2.0e–02 | –0.411 | 2.0e–04 | |
| –0.682 | 1.3e–07 | –0.100 | 7.4e–01 | –0.856 | 2.3e–05 | –0.702 | 1.5e–12 | |
| –0.657 | 7.1e–07 | –0.045 | 8.8e–01 | –0.817 | 2.0e–04 | –0.640 | 8.5e–10 | |
| –0.689 | 7.8e–04 | –0.800 | 1.0e–01 | –0.689 | 4.0e–02 | –0.692 | 5.9e–06 |
Note: is the correlation coefficient and Prob(null) is the probability that the correlation does not exist.
4.3 The Distributions of Different Spectral Types
As discussed above, is a parameter that determines the shape of the SED in mid-to-far infrared. The different shapes represent relative contributions of active and quiescent regions within the galaxy. The coldest galaxies are fitted by =2.5 as estimated for the cirrus-like region, and the warmest galaxies, by =1 as estimated for photodissociation regions in star-forming regions (Dale et al. 2001). The value can be used to roughly estimate the activity of the galaxy.
Figure 8(a) shows the distribution of values of our sample galaxies (solid line) compared with SINGS galaxies (dotted line) from Dale et al. (2005). The derived values of our sample range from 1.5 to 3.0 except one. Most of the galaxies have values above 2 and few galaxies have that less than 1.5. All these indicate that most of our sample galaxies tend to be quiescent, similar to the FIRBACK 170 m sources (Dennefeld et al. 2005), which are moderate starbursters with a dominating cold dust component. Compared to SINGS galaxies, our sample shows a lack of the most quiescent galaxies with above 3. The distribution of SINGS galaxies present two distinct populations: the first peaks at about 2.2 and is similar to our sample, the second peaks at about 3.7 and has values even as high as 4, which belongs to the most quiescent state. The difference could be that the SEDs of our sample have fewer points in the far-infrared, and with larger errors, so our weighted fitting leans to the mid-infrared, which have more points and lower errors, and this would underestimate the value of some galaxies, (such a case can be seen in some individual SEDs with 160 m fluxes above the model values). Another possible reason is that the redshifts of our sample are larger than those of SINGS’s. With the high limits (7) of MIPS catalog of xFLS (Frayer et al. 2006), the most quiescent galaxies with larger redshifts are probably not detected in the far-infrared bands and this will bias our sample to the more active one.
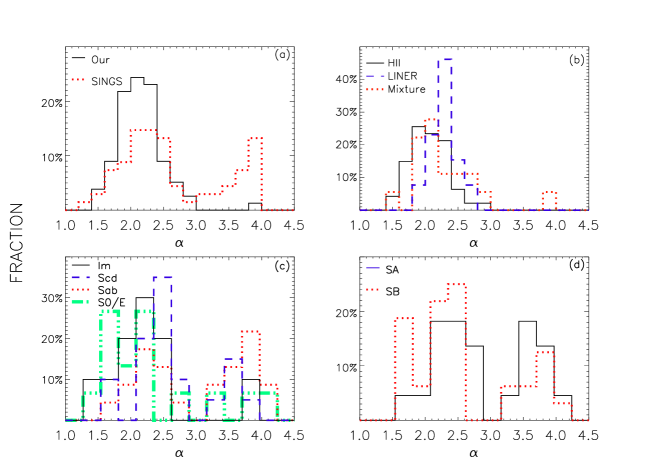
Figure 8(b) shows the distributions of HII galaxies (solid line), LINERs (dashed line) and mixture types (dotted line). All three types have a similar range of values, but differ a little in the mean value: the mean and dispersion are () for the HII galaxies, () for the LINERs and () for the mixture types. One mixture type galaxy (SDSS J172403.46+593804.0) has the largest value of 3.88. A K-S test on the distributions of LINERs and mixture types show that the probability of these two distributions coming from same parent distribution is 0.473. Similar test for the HII galaxies and LINERs gives a probability of 0.0065. The test shows that the HII galaxies and LINERs have quite different distributions, which indicates different shapes in their mid-to-far infrared SEDs. Based on the distributions in Figure 8(b) and the mean values of the three spectral types, we find HII galaxies on average are a little more active than either the mixture types or the LINERs; and the LINERs are the most quiescent one of the three, and this can also be supported by the fact that there are very few LINERs with value smaller than 2 in our sample, and that the mixture type as the transition type from HII galaxy to LINER has properties intermediate between the two. However, though there exist some differences of different spectral types in mid-to-far infrared region, we can not firmly distinguish the three types simply based on the mid-to-far infrared SED in individual cases.
4.4 The Distributions of Different Morphological Types
Since the amount of dust is strongly related to the galaxy’s morphology, the value would be also expected to relate with the galaxy morphology. In this section, we explore the distributions of galaxies of different morphological types. Because we lack the morphological information, we can not do the analysis based on our sample. Fortunately, the SINGS sample (Dale et al. 2005) provide the morphological data. Figure 8(c) shows the distributions of the different morphological types. All these types exhibit the two populations. According to the distributions, the irregular galaxies, on the whole, are more active (because of their larger star formation density) than the disk galaxies, and among the latter, the late types are more active than the early types. In the early type disk galaxies, the two populations are even comparable in number. We should explain that the largest value would relate to cold cirrus from the oldest stellar disk. All these results show that the star formation activity varies along the Hubble sequence. Few of the early type galaxies (E/S0) show values greater than 3. This could be explained by a smaller contribution from cold cirrus because of the smaller fraction of the disk component in early type galaxies, but a large, unbiased sample and a quantitative morphological classification are needed to check these points.
We also explored the influence of bars on the distributions (Fig. 8(d)). We found that bar galaxies tend to have smaller values and are a little more active than the non-bar galaxies. It indicates that bars could trigger off star formation in galaxies.
5 Conclusions
We present mid-to-far infrared SEDs of a large sample of galaxies, selected from the Spitzer xFLS field and SDSS spectroscopic survey. With the help of model fitting, we analyze the dust properties of galaxies in different spectral types statistically.
The QSOs present a power-law continuum at near-to-mid infrared, which differs from SEDs of other galaxies and is well consistent with an AGN template of NGC 5506.
The mid-infrared SEDs of absorption galaxies are dominated by an old stellar population with little dust emission, and can be well fitted by the spectrum of the 13 Gyr dust-free elliptical galaxy.
The mid-to-far infrared SEDs of HII galaxies, mixture type galaxies, and LINERs can be well fitted by the one-parameter dust model of Dale et al. (2001) plus the 13 Gyr dust-free elliptical galaxy model. The statistics shows that the HII galaxies are more active than the other two types, though most of these galaxies should be classified as quiescent galaxies.
The distributions of different morphologies of SINGS galaxies show that the activity of galaxies depends on the Hubble morphological type and the presence of bars.
Acknowledgements.
The authors thank for the help from Cai-Na Hao, Jian-Ling Wang and Feng-Shan Liu. Many thanks go to D.A. Dale for kindly providing the dust model. Also many thanks go to the referee, who gives suggestions to improve the paper. This project was supported by the NSFC through Grants 10273012, 10333060 and 10473013. This work is based in part on observations made with the Spitzer Space Telescope, which is operated by the Jet Propulsion Laboratory, California Institute of Technology under NASA contract 1407. The SDSS Web site is http://www.sdss.org/. SDSS is managed by the Astrophysical Research Consortium (ARC) for the Participating Institutions.References
- [] Bertin E., Arnouts S., 1996, A&AS, 117, 393
- [] Calzetti D., Armus L., Bohlin R. C. et al., 2000, ApJ, 533, 682
- [] Calzetti D., 2001, PASP, 113, 1449
- [] Dale D. A., Helou G., Contursi A. et al., 2001, ApJ, 549, 215
- [] Dale D. A., Helou G., 2002, ApJ, 576, 159
- [] Dale D. A., Bendo G. J., Engelbracht C. W. et al., 2005, ApJ, 633, 857
- [] Dennefeld M., Lagache G., Mei S. et al., 2005, A&A, 440, 5
- [] Fazio G. G., Hora J. L., Allen L. E. et al., 2004, ApJS, 154, 10
- [] Frayer D. T., Fadda D., Yan L. et al., 2006, AJ, 131, 250
- [] Hatziminaoglou E., Pérez-Fournon I., Polletta M. et al., 2005, AJ, 129, 1198
- [] Huang J. S., Barmby P., Fazio G. G. et al., 2004, ApJS, 154, 44
- [] Kauffmann G., Heckman T. M., Tremonti C. et al., 2003, MNRAS, 346, 1055
- [] Kennicutt R. C. J., Armus L., Bendo G. et al., 2003, PASP, 115, 928
- [] Lacy M., Wilson G., Masci F. et al., 2005, ApJS, 161, 41
- [] Lagache G., Dole H., Puget J. L., 2003, MNRAS, 338, 555
- [] Lonsdale C. J., Smith H. E., Rowan-Robinson M. et al., 2003, PASP, 115, 897
- [] Oke J. B., Gunn J. E., 1983, ApJ, 266, 713
- [] Rieke G. H., Young E. T., Engelbracht C. W. et al., 2004, ApJS, 154, 25
- [] Rowan-Robinson M., Babbedge T., Surace J. et al., 2005, AJ, 129, 1183
- [] Rowan-Robinson M., Lari C., Perez-Fournon I. et al., 2004, MNRAS, 351, 1290
- [] Sajina A., Scott D., Dennefeld M. et al., 2006, MNRAS, 369, 939
- [] Silva L., Granato G. L., Bressan A. et al., 1998, ApJ, 509, 103
- [] Soifer B. T., Neugebauer G., Helou G. et al., 1984, ApJ, 283, L1
- [] Stoughton C., Lupton R. H., Bernardi M. et al., 2002, AJ, 123, 485
- [] Tremonti C. A., Heckman T. M., Kauffmann G. et al., 2004, ApJ, 613, 898
- [] Vazquez G. A., Leitherer C., 2005, ApJ, 621, 695
- [] Veilleux S., Osterbrock D. E., 1987, ApJS, 63, 295
- [] Werner M. W., Roellig T. L., Low F. J. et al., 2004, ApJS, 154, 1
- [] Wu H., Cao C., Hao C. N., et al., 2005, ApJ, 632, L79
- [] Wu H., Zou Z. L., Xia X. Y. et al., 1998, A&AS, 132, 181
- [] Xilouris E. M., Madden S. C., Galliano F. et al., 2004, A&A, 416, 41