Scaling relations in fossil galaxy groups
Abstract
Using Chandra X-ray observations and optical imaging and spectroscopy of a flux-limited sample of 5 fossil groups, supplemented by additional systems from the literature, we provide the first detailed study of the scaling properties of fossils compared to normal groups and clusters. Fossil groups are dominated by a single giant elliptical galaxy at the centre of an extended bright X-ray halo. In general, all the fossils we study show regular and symmetric X-ray emission, indicating an absence of recent major group mergers. We study the scaling relations involving total gravitational mass, X-ray temperature, X-ray luminosity, group velocity dispersion and the optical luminosity of the fossil groups.
We confirm that, for a given optical luminosity of the group, fossils are more X-ray luminous than non-fossil groups. Fossils, however, fall comfortably on the conventional relation of galaxy groups and clusters, suggesting that their X-ray luminosity and their gas temperature are both boosted, arguably, as a result of their early formation. This is supported by other scaling relations including the and relations in which fossils show higher X-ray luminosity and temperature for a given group velocity dispersion. We find that mass concentration in fossils is higher than in non-fossil groups and clusters. In addition, the relation suggests that fossils are hotter, for a given total gravitational mass, both consistent with an early formation epoch for fossils. We show that the mass-to-light ratio in fossils is rather high but not exceptional, compared to galaxy groups and clusters. The entropy of the gas in low mass fossils appears to be systematically lower than that in normal groups, which may explain why the properties of fossils are more consistent with an extension of cluster properties. We discuss possible reasons for this difference in fossil properties and conclude that the cuspy potential raises the luminosity and temperature of the IGM in fossils. However, this works in conjunction with lower gas entropy, which may arise from less effective preheating of the gas.
keywords:
galaxies: clusters: general - galaxies: elliptical - galaxies: haloes - intergalactic medium - X-ray: galaxies - X-rays: galaxies: clusters1 Introduction
Galaxy groups are key systems in advancing our understanding of structure formation and evolution. They contain the majority of galaxies in the universe, and are precursors to the most massive structures, i.e. clusters, giving them cosmological importance. However, they show departures from the scaling relations obeyed by galaxy clusters indicating that they are not simply scaled-down versions of clusters.
Theoretical or computational models (e.g. Navarro, Frenk & White (1995)) based on simple gravitational collapse and shock heating would lead to self-similar structure of the inter-galactic medium (IGM) in clusters and groups. This in turn implies scaling relations between the global properties of clusters: , and , where is the total X-ray luminosity, the gas temperature, the velocity dispersion of cluster galaxies and is the total gravitational mass of the cluster. While some studies find that the observed properties of the most massive clusters are close to the above relations (Allen & Fabian, 1998; Xue, Jin & Wu, 2001), the self-similar model clearly breaks down in smaller systems, with observations indicating lower than expected luminosities for a given temperature or velocity dispersion. White, Jones & Forman (1997) found for clusters observed with the Einstein X-ray Observatory. For galaxy groups, Mulchaey & Zabludoff (1998) found , consistent with clusters, while Helsdon & Ponman (2000) and Xue & Wu (2000) found much steeper relations, .
Galaxy groups are rapidly evolving and diverse systems, and many are not virialised (eg. Rasmussen et al. (2006)). Thus studying a sample of well-characterised galaxy groups, in terms of their stellar properties and IGM, might help us to understand some of the observed diversity in group properties.
Jones et al. (2003) studied a flux-limited sample of old galaxy groups known as “fossil groups” and found significant differences in their intergalactic hot gas properties in comparison to other galaxy groups. By estimating the space density of fossil groups, they showed that fossils are as numerous as galaxy clusters. Fossil groups are particularly important systems to study, in the context of scaling relations, as they are not subject to recent major group mergers, and should represent archetypal old undisturbed systems.
Recent studies of fossil groups show interesting features which distinguish them from normal galaxy groups. Chandra observations of the nearest fossil galaxy group, NGC 6482, showed a very high gravitational mass concentration and the absence of a cool core (Khosroshahi et al., 2004), despite the short central cooling time. The Chandra and XMM-Newton study of the fossil cluster,, RX J1416.4+2315 showed similar features (Khosroshahi et al., 2006). There has been only one statistical study of fossil groups (Jones et al., 2003), based on ROSAT pointed observations, which demonstrated some of the differences in fossils compared to normal galaxy groups and clusters.
The present study uses high resolution, short to moderate exposure, Chandra observations of fossil groups drawn from this flux-limited sample combined with previously studied fossils. Together, this provides the largest sample of fossil galaxy groups studied using the high resolution of Chandra . Section 2 briefly reviews fossil groups and describes the observations. The results from imaging and spectral X-ray analysis and comments of individual systems are presented in Section 3. The scaling relations involving X-ray and optical properties of fossils are presented in Section 4. Section 5 studies the mass distribution, relation and mass-to-light ratio. A discussion and concluding remarks can be found in section 6.
We adopt a cosmology with km s-1 Mpc-1 and with cosmological constant throughout this paper.

| Group | R.A. | Dec. | z | tobs | tuseful | kpc/arcsec | Reference/Obs ID |
| (J2000) | (J2000) | ksec | ksec | ||||
| RX J1256.0+2556 | 12:56:03.4 | +25:56:48 | 0.232 | 27.7 | 24.7 | 3.73 | 3212 |
| RX J1331.5+1108 | 13:31:30.2 | +11:08:04 | 0.081 | 30.7 | 27.6 | 1.53 | 3213 |
| RX J1340.5+4017 | 13:40:33.4 | +40:17:48 | 0.171 | 47.0 | 45.9 | 2.92 | 3223 |
| RX J1416.4+2315 | 14:16:26.9 | +23:15:32 | 0.137 | 14.6 | 14.4 | 2.44 | Khosroshahi et al. (2006) |
| RX J1552.2+2013 | 15:52:12.5 | +20:13:32 | 0.135 | 14.9 | 14.9 | 2.40 | 3214 |
| NGC 6482 | 17:51:48.8 | +23:04:19 | 0.013 | 19.6 | 18.0 | 0.27 | Khosroshahi et al. (2004) |
| ESO 3060170 | 05:40:06.7 | -40:50:11 | 0.036 | 28.5 | 27.6 | 0.71 | Sun et al. (2004) |
2 Fossil groups, the sample and observations
Fossil galaxy groups are identified as galaxy groups dominated, optically, by a single giant elliptical galaxy surrounded by an extended X-ray emission with X-ray luminosity of erg s-1. There is at least a 2 magnitude difference between the luminosity of the first and the second ranked galaxies, measured in the R-band, within the half virial radius. Jones et al. (2003) give the rationale for the above choices. The lower limit to guarantees the existence of a collapsed galaxy system, while the optical criterion ensures that the M galaxies have merged into a single luminous galaxy as a result of dynamical friction (Binney & Tremaine, 1987). No upper limit is placed on the X-ray luminosity or temperature, but as dynamical friction is the main player in the formation of fossil groups, the mass and physical size of the system cannot be arbitrarily large as the time scale for dynamical friction to lead to orbital decay, and hence to galaxy merging, should not exceed the age of the universe (Khosroshahi et al., 2006; Milos et al., 2006).
The central galaxy in fossils can be as luminous as the brightest cluster galaxies (BCGs). However, despite apparent similarities, the isophotes of the central galaxy in fossil groups are found to be non-boxy in contrast to the isophotes of BCGs which are predominantly boxy (Khosroshahi, Ponman & Jones, 2006).
2.1 The X-ray sample
Since the discovery of the first fossil (Ponman et al., 1994), similar structures have been identified, sometimes branded as “over luminous elliptical galaxies”, or OLEGs (Vikhlinin et al., 1999; Yoshioka et al., 2004), which meet the fossil selection criteria (Jones et al., 2003). Over a dozen such system have been identified in different surveys, or pointed observations, and observed with a variety of X-ray instruments.
The volume-limited sample of spatially extended X-ray sources compiled by the WARPS project (Wide Angle ROSAT Pointed Survey; Scharf et al. (1997); Jones et al. (1998); Perlman et al. (2002)) forms the core of the sample on which the present study is based. Details of the search, initial sample selection and subsequent observations leading to this flux limited sample can be found in Jones et al. (2003). In order to improve our statistics, we have added the results recent high quality observations of fossils from the literature. This includes the nearest known fossil group, NGC 6482 (Khosroshahi et al., 2004), and the massive fossil ESO 3607010 (Sun et al., 2004). In addition, results from the study of isolated OLEGs by Yoshioka et al. (2004), for which a mass analysis is available, are also used in comparisons. We treat the latter sample as “fossil candidates” excluding RX J0419.6+0225 (NGC 1550) which, according to Sun et al. (2003), does not satisfy the fossil optical selection criterion.
2.2 Chandra observations
Chandra observations of the fossil groups in our sample were performed in 2003 using Chandra ACIS-S. One major justification for the Chandra observations of these systems was to obtain an accurate position for any point sources, and hence to eliminate any ambiguities regarding the point source contribution to the X-ray luminosity of the fossils in the earlier study of Jones et al. (2003). Also, the earlier ROSAT observations were not of sufficient quality to give a reliable estimate of the gas temperature, which is important for the study of various scaling relations. The basic properties of our observed sample are summarised in Table 1 (top). This includes 4 systems from the WARPS statistical sample (Jones et al., 2003) plus the original fossil (Jones et al., 2000), RX J1340.6+4018. Due to the limited statistics, we do not insist on limiting this study to the original flux-limited sample. Table 1 also includes the basic information about two other fossils with existing Chandra data used in this study.
2.3 Optical photometry and spectroscopy
The imaging and spectroscopic observations of the sample were performed using the observational facilities of Issac-Newton Group of Telescopes (ING), Kitt-peak National Observatory (KPNO). The R-band image was obtained using the INT 2.5m wide field imager, with 20 min exposures taken in service time. Unfortunately the conditions were not photometric, and so further R-band imaging was obtained, in photometric conditions, to calibrate the original images. For two systems (RX J1416.4+2315 and RX J1552.2+2013) this further imaging was obtained with the 8k mosaic camera at the University of Hawaii 2.2-m telescope. For the other systems, the calibration images were obtained in additional INT wide-field camera service time. The photometric accuracy for all systems is 0.05 mag. Absolute magnitudes of the central galaxies were corrected for Galactic absorption. No K-corrections were applied in deriving , since the corrections are small (0.1 mag) at the redshifts sampled, and in any case all of the brightest galaxies, and most of the second-brightest galaxies, are of an early type and would have identical K-corrections.
The spectroscopic observations were performed during a run to study several fossil groups using a multi-slit spectrograph on the KPNO-4m telescope in March 2000. The Ritchey-Cretien spectrograph and KPC-10A grating gave a dispersion of 2.75 Å/pixel over the range 3800-8500 Å, and with 1.8 arcsec slitlets a resolution of 6 (FWHM) was achieved. Risley prisms compensated for atmospheric dispersion. Spectra were obtained through up to three slitmasks, with typically an hour exposure on each. The spectroscopic data were reduced and analysed in the standard way using IRAF.
3 X-ray analysis and results
3.1 Spatial distribution
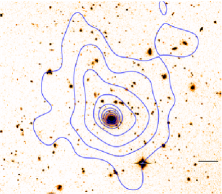
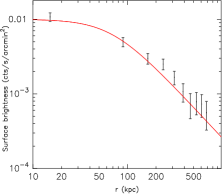
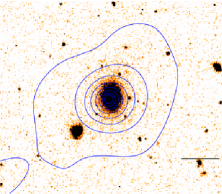
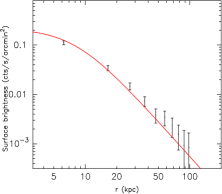
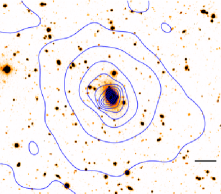
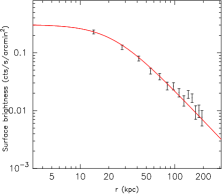
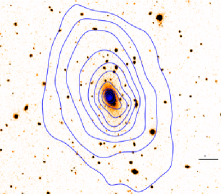
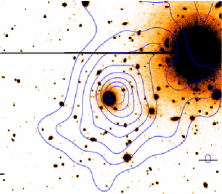
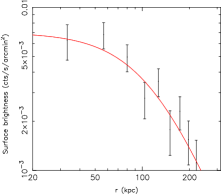
The Chandra data were first checked for bad pixels and flares using the latest version of the standard analysis tools (CIAO 3.2 and CALDB 3.1). To examine the diffuse X-ray emission, point sources were detected using the CIAO “wavedetect” software, and removed. Their locations were then filled with surrounding background values using a linear interpolation. Figure 1 shows the contours of soft (0.3-2.0 keV) diffuse X-ray emission overlaid on R-band images. In general, the X-ray emission is relaxed, indicating an absence of any recent merger. X-ray radial surface brightness profiles were extracted from the the ACIS-S3 images in a soft energy range (0.3-2.0 keV) and fitted with a single -model profile (see the Appendix) except for RX J1416.4+2315 where a double -model was used (Khosroshahi et al., 2006). The data quality varies due to the distance and luminosity of the targets and the exposure time. The binning is linear and each bin has a minimum of 50 net counts, except RX J1552.2+2013, where this is reduced to 20 net counts per bin. The results of the spatial analysis is given in Table 2. In all cases the centroid of the X-ray emission matches the centre of the giant elliptical galaxy, except for RX J1552.2+2013 where an offset of 5 arcsec is seen (see section 3.3.5).
3.2 Spectral analysis
We adopt the same analysis procedure as for NGC6482 (Khosroshahi et al., 2004)) and RX J1416.4+2315 (Khosroshahi et al., 2006)) for the targets in Table 1, except that we use the latest version of the analysis tools (CIAO 3.2 and CALDB 3.1).
With the high spatial resolution of Chandra , we were able to exclude the point sources and examine the intra-group hot gas spectrum without the presence of contaminating sources. Due to limited counts we extract a global ACIS spectrum in all cases from a circular region within which the X-ray was detected. We fit an absorbed APEC (Smith et al., 2001) model with a hydrogen column density fixed to the galactic value at the coordinates of each system. The background was chosen for each system from the same region on the re-projected blank sky observations to account for local variations within the chip.
The results of the spectral analysis are given in Table 2. This table also lists the properties of other known fossils used in this study to achieve better statistics. Additional information on individual systems can be found in the appendix.
| Group | Abundances | L | M500 | ||||||
| Name | yr | ||||||||
| RX J1256.0+2556 | 0.64 | 50 | 86 | 214 | 11 | ||||
| RX J1331.5+1108 | 0.44 | 2.1 | 9.5 | 79 | 9.2 | ||||
| RX J1340.5+4017 | 0.61 | 5.2 | 19 | 81 | 11 | ||||
| RX J1416.4+2315d | 0.97 | 170 | 179 | 280 | 9.6 | ||||
| RX J1552.2+2013 | 0.3 fixed | 0.22 | 60 | 110 | 211 | 29 | |||
| NGC 6482d | 0.16 | 1.1 | 3.5 | 55 | 10 | ||||
| ESO 3060170d | 0.89 | 66 | 200 | 20 | |||||
| NGC 1132e | - | - | 0.88 | 2.1 | - | - | |||
| RXJ0454.8-1806e | - | - | 0.73 | 13 | - | - |
.
4 X-ray scaling relations
4.1 relation
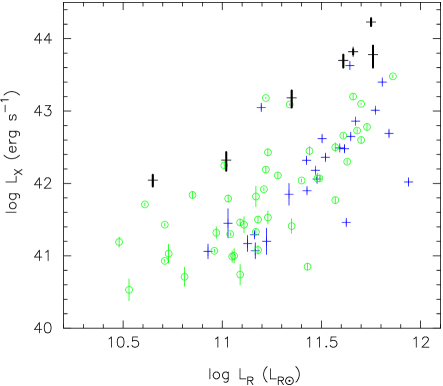
One of the interesting properties of fossils is the excess of about one order of magnitude in the X-ray luminosity of fossils compared to non-fossil groups for a given total optical luminosity (Jones et al., 2003). In the absence of spectroscopic data, the optical luminosity of the central galaxy was used for the comparison by Jones et al. (2003).
Since then we have obtained the redshifts for a number of galaxies in each group, and are now able to explore the relation with better accuracy. To obtain the total optical luminosity (R-band) of fossils we accumulate the luminosity of the spectroscopically confirmed member galaxies within . The limiting magnitude of our spectroscopic observations is . Deeper galaxy luminosity functions (to ) are available for RX J1416.4+2315 (Cypriano, Mendes de Oliveira, & Sodré, 2006) and RX J1552.2+2013 (, 2006). We find that only 2-3% of the total R-band luminosity of these groups lies in galaxies within the above two magnitude interval. This small correction is applied to RX J1416.4+2315, RX J1552.2+2013, RX J1256.0+2556 and RX J1331.5+1108. The contribution of the non-brightest group members to the total luminosity (in R-band) of our fossil groups is estimated to be % of the luminosity of the brightest galaxy. This same ratio is % the in B-band, within for RX J1416.4+2315 and RX J1552.2+2013, (Cypriano, Mendes de Oliveira, & Sodré, 2006; , 2006).
For the galaxy groups with very few members known – RX J1340.5+4017 and NGC 6482 – we estimate the fraction of the missing light by comparing them to one of the above four systems, for which more data are available, according to the luminosity of their dominant galaxy. We adopted this approach, instead of estimating the total R-band luminosity of the faint end using statistical background galaxy subtraction, because R-band data for RX J1340.5+4017 covers only out to radius , which limits the effectiveness of the statistical background subtraction. In addition, the statistical subtraction is less efficient in the absence of multi-colour data. The bolometric X-ray luminosities of the groups within were measured directly from their extracted spectrum. Given this, together with the -model parameters for each system (Table 2), we can estimate the bolometric luminosities within any radius. We choose for the comparisons under this subsection. The error in the X-ray luminosity is obtained from the Poisson error in the X-ray count rate.
Jones et al. (2003) used a sample of X-ray bright groups from Helsdon & Ponman (2003) to make a comparison between fossils and non-fossils in the plane. A larger and more representative sample of galaxy groups is now available from Osmond & Ponman (2004). We use the latter sample of groups, known as GEMS sample, for our comparisons through out this study.
Figure 2 confirms that fossils are more X-ray luminous than non-fossil groups, for a given total R-band group luminosity. The fossil systems lie at the extreme upper envelope of the distribution for groups in general.
4.2 relation
One possible explanation for the difference in the distribution of fossil and non-fossil groups in the above scaling relation (Fig 2) is that fossils might be under-luminous in the optical, due to inefficient star formation. If this were a strong effect then there be nothing unusual about their X-ray luminosity. However, Fig 3 shows that any such effect is weak in clusters, and non-existent in the group regime, where fossils fall on the relation of non-fossil galaxy groups. We will discuss these features in Section 6 in the light of other scaling relations.
Group velocity dispersions are based on our spectroscopic observations of the sample in Table 1 and NED for the rest of the systems. They are calculated using the following relation, also used in the comparison sample of Osmond & Ponman (2004):
| (1) |
This estimator corrects for a statistical bias, which results if one uses the normal unbiased estimator for and then takes the square root to obtain (which is then not unbiased). This correction is the origin of the term 3/2 (rather than 1) in the denominator of the above equation.
4.3 relation
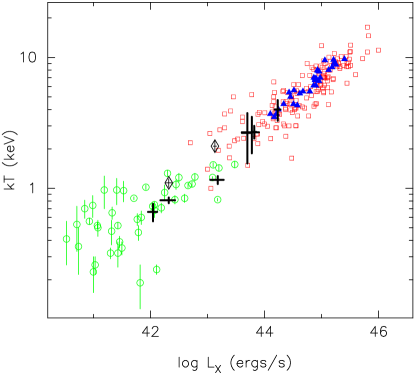
If excess X-ray luminosity in fossils were the only difference between the X-ray properties of fossils and non-fossil groups, then they would be expected to deviate from the relation known for non-fossil groups and clusters. This appeared to be the case from an earlier ROSAT study (Jones et al., 2003) based on very limited statistics. Two fossil groups, for which Jones et al. (2003) could measure the temperature, were found to have high X-ray luminosity for their gas temperature. Based on this finding, it was argued that fossils are low-entropy systems due to their higher gas density, in comparison to non-fossils. However we have shown in Khosroshahi et al. (2006) that the X-ray temperature of the RX J1416.4+2315 was underestimated in the ROSAT analysis. The present wider study shows that the above system is not an exception and, as it is seen in Fig 4, fossils fall on the conventional relation of non-fossil groups and clusters. Hence, if from our earlier arguments we assert that is enhanced in fossils, then it follows that they must also have elevated mean temperature values, such that they remain on the standard group relation.
4.4 relation
Mahdavi & Geller (2001); Xue & Wu (2000) have presented relations for clusters and groups. Osmond & Ponman (2004) found a slope of 2.31 0.61 in for their sample of galaxy groups with intergalactic X-ray emission, flatter than the value of found by Helsdon & Ponman (2000). There is a good deal of scatter in the relation, which may in part account for the disagreement between various studies. While Ponman et al. (1996), Mulchaey & Zabludoff (1998); Helsdon & Ponman (2000) and Mahdavi & Geller (2001) find that groups are consistent with the cluster-relation slope of , Mahdavi et al. (1997,2000) and Xue & Wu (2000) find significantly flatter relations in groups with a slope similar to the finding of Osmond & Ponman (2004).
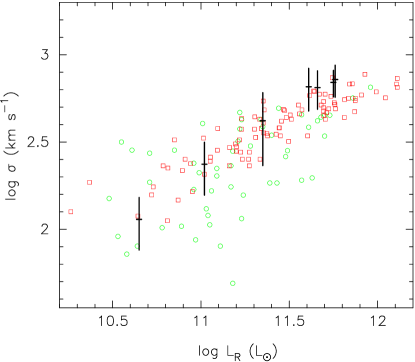
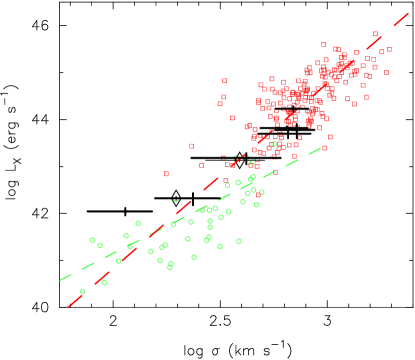
Figure 5 shows the distribution of fossil groups in the plane of along with the non-fossil groups and clusters. Fossils appear more X-ray luminous than non-fossil groups for a given group velocity dispersion. The slope of the relation for fossils is , consistent with the slope of the relation for the groups in the GEMS sample. The flattening at erg s-1 is due to the fossil X-ray selection criterion. We note that the statistics are limited and therefore it is not clear whether fossils are simply X-ray boosted version of galaxy groups (with a similar slope) or whether they follow the trend seen in galaxy clusters.
4.5 relation
Studies of the relation in clusters show that the relationship between velocity dispersion and gas temperature departs slightly from the virial theorem expectation () (Girardi et al., 1998; Wu, Xue & Fang, 1999). In the group regime, some studies have concluded that groups follow almost a similar trend to clusters (e.g. Mulchaey 2000; Xue & Wu 2000), whilst others have found that the relation steepens further at (Helsdon & Ponman 2000). Osmond & Ponman (2004) show that there is a great deal of non-statistical scatter in the groups, in addition to the large statistical errors in both and especially , in the poorest systems. This appears to be the origin of the controversy over whether the relation does or does not steepen in the group regime.
Figure 6 shows that fossil systems tend to be hotter than non-fossils in the group regime, as expected from the and relations, and therefore consistent with a scenario in which the temperature and X-ray luminosity of fossils are both boosted relative to non-fossil systems.
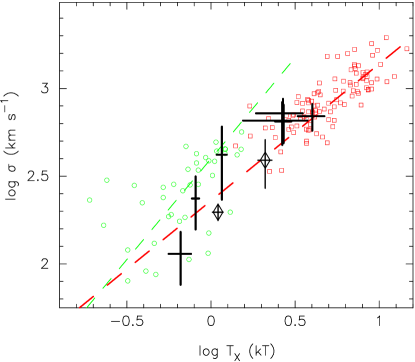
The above two scaling relations linking the hot gas and galaxy dynamics show significant departures of fossil groups from the scaling laws of non-fossil groups. The fossil groups seem to scatter around an extrapolation of the scaling laws derived for galaxy clusters, resulting in an offset from the relations followed by normal galaxy groups.
4.6 relation
The gas entropy is defined here as , where is the electron number density. At a given redshift, this quantity should scale linearly with temperature, owing to the self-similarity of the gas density profiles.
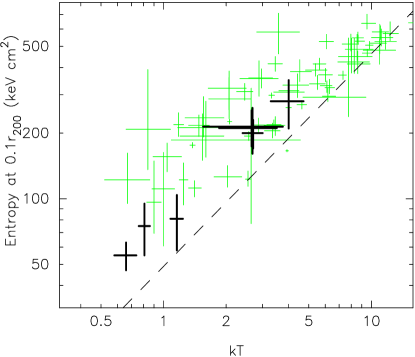
Estimating the gas entropy at we compare in Fig 7 the scaling for fossils and non-fossils in Ponman et al. (2003). While there is still a significant overlap between fossils and non-fossils in this scaling relation, fossils lie along the lower envelope of the distribution. The effect is strongest in low mass fossils, which fall much closer to the scaling expected from self-similarity than do the bulk of normal groups. The entropy and its error was calculated using the method described in Khosroshahi et al. (2004, 2006).
The slope of the relation for the fossil systems in Fig 7 is , consistent with slope of 1.0 expected from self-similarity. As in Ponman et al. (2003), we did not attempt to correct individual entropy values to the redshift of the system. Applying such a correction is only appropriate if the system is observed at its redshift of formation, which seems most unlikely in the case of fossils. For reference, at , such a correction (based on the evolving critical density on the Universe) would change the entropy by about 35%.
5 Mass distribution, concentration and the M-T relation
The scaling relations involving the mass of groups and clusters are amongst the most important ones. The mass distribution is also required for a precise measurement of overdensity radius.
5.1 X-ray derived mass
The total gravitational mass at a given radius can be derived from the gas density and the temperature profiles, assuming that the gas is in hydrostatic equilibrium and is distributed with spherical symmetry.
The total gravitational mass is given by:
| (2) |
where G and are the gravitational constant and proton mass, and the mean particle mass is .
We have already reported the detailed mass profiles of groups with sufficient counts to derive radial temperature profiles (Khosroshahi et al., 2004, 2006). Two other studies also give detailed mass analysis of fossils (Yoshioka et al., 2004; Sun et al., 2004). For the rest of the systems in Table 1 one could assume an isothermal temperature and derive the mass using the above equation with a mean global temperature. Table 3 gives an estimate for the X-ray derived mass assuming such an isothermal model.
5.2 Dynamical mass
Having the group line-of-sight velocity dispersion, (Table 3) we can estimate the dynamical mass, which gives an independent measure of the underlying total mass of the group. We calculate a virial mass using the standard equation given by Ramella, Geller & Huchra (1989), , where is the estimated or measured (see below) virial radius of the system. The virial dynamical masses, , are given in table 3.
5.3 Overdensity radius
Measuring the overdensity radius requires a detailed knowledge of mass distribution. In the absence of high quality data for some of the groups in this study we have to rely on an estimate. Some of the well known estimators of and are derived from simulations, for instance (Evrard, Metzler & Navarro, 1996):
| (3) |
Using the definition of , the above can be rewritten in terms of
| (4) |
Alternatively, one could use the virial theorem, directly, to estimate the virial radius (), and any overdensity radius for a given mass profile. Girardi et al. (1998) derives an approximation for the virial radius of a spherical system:
| (5) |
can then be calculated using the definition of the density contrast and by assuming a simple mass profile. This results in and , assuming . This means that values of calculated using the latter indicator (eq. 6) are expected to be about 25% higher in comparison to those from equation (4), for a system with .
Recently Willis et al. (2005) compared values of derived from an isothermal model to corresponding values obtained using the observed relationship between cluster mass and temperature. Employing the data presented by Finoguenov et al. (2001) they obtain the following relation for a wide range of temperatures (0.75-14 keV),
| (6) |
Table 3 compares the values for our systems using the various estimates described above. Table 3 shows that measured values of , for RX J1416.4+2315, NGC 6482 and ESO 3060170, are systematically smaller than the values derived from an isothermal hydrostatic model, but are in reasonable agreement with values estimated using equation (6), within 5% to 20%.
| Group | ||||||||
|---|---|---|---|---|---|---|---|---|
| Name | km s-1 | Mpc | Mpc () | Mpc () | Mpc () | |||
| RX J1256.0+2556 | 8 | 773214 | 1.42 | - | 0.72 | 0.58 | 0.91 | 710 |
| RX J1331.5+1108 | 6 | 236 | 0.57 | - | 0.36 | 0.26 | 0.44 | 24 |
| RX J1340.5+4017 | 4 | 419187 | 0.94 | - | 0.44 | 0.36 | 0.61 | 130 |
| RX J1416.4+2315 | 18 | 694120 | 0.75 | 0.77 | 0.88 | 0.82 | 1.12 | 656 |
| RX J1552.2+2013 | 13 | 721150 | 1.13 | - | 0.76 | 0.67 | 0.95 | 640 |
| NGC 6482 | 5 | 11538 | 0.13 | 0.25 | 0.34 | 0.30 | 0.45 | 6 |
| ESO 3060170 | 15 | 648160 | 1.01 | 0.62 | 0.74 | 0.67 | 0.90 | 469 |
5.4 M-T relation
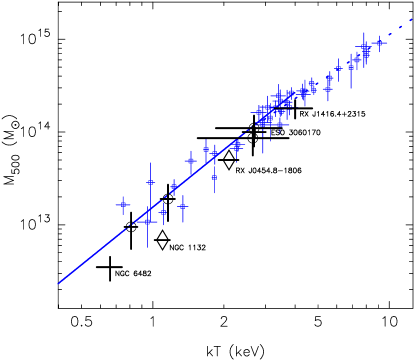
Three of the systems, RX J1416.4+2315, NGC 6482 and ESO 3060170, had their mass profiles (and their associated errors) measured previously, therefore we use their measured total mass within in Fig 8. The NFW fit parameters given in Yoshioka et al. (2004) were used to estimate the for OLEGs, which are shown with diamonds in Fig 8. For the rest of the groups in the sample (Table 2) we use the , and corresponding value of , derived from equation (6) above. For comparison to non-fossil groups we use the best orthogonal fit, from Willis et al. (2005) to the galaxy systems with keV studied by Finoguenov et al. (2001). As the figure shows, fossils with resolved temperature profiles show a tendency toward higher gas temperature for a given system mass – an effect which is more noticeable in low mass systems. All the fossils with resolved temperature profiles lie below the best fit M-T relation, while isothermality assumption for the rest of the fossils allow them to be consistent with non-fossils best fit relation. Given that isothermality assumption results in relatively higher masses (Sanderson et al., 2003), therefore we argue that fossils are, in general, hotter than non-fossils for a given mass. The error in the mass of fossils with unresolved temperature profile was obtained from the relative error in the mass, using equation 2, based on the errors in the surface brightness profiles and the global temperature.
A comparison to the relation for clusters derived by Arnaud, Pointecouteau & Pratt (2005) also shows that fossils are hotter for given mass. In a more recent study Vikhlinin et al. (2006) find a higher normalisation for the relation which they argue to be the consequence of the density profile steepening at large radii, which leads to their masses being larger than would be obtained from a -model representation of the density profile. Their results are not strictly comparable to our sample, as they deal with hotter systems. We discuss the effects of cool core correction, and the size of the area from which the global spectrum was extracted, on the scaling relations in the discussion. We discuss the effects of cool core correction, and the size of the area from which the global spectrum was extracted, on the scaling relations in the discussion.
The fossils in this study cover a wide range of redshift, however, the effect of evolution in the relation (i.e. the term in Maughan et al. (2006)) is smaller than the errors associated with the estimate of the mass for each system. A typical decrease in the mass for a system at is only 7%, relative to the best-fit relation for the non-fossil systems, which lie at . The effect will be negligible in the lowest temperature fossils, which lie within .
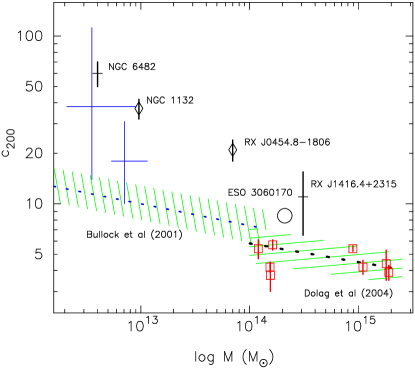
5.5 Mass concentration
Dark matter halos with an early formation epoch tend to be more concentrated (Navarro, Frenk & White, 1995). Recent numerical studies also predict some mass dependency for the halo concentration, resulting from the fact that lower mass halos generally form earlier (Bullock et al., 2001; Dolag et al., 2004). Observational results seem to agree well with the numerical predictions (Pratt & Arnaud, 2005; Pointecouteau et al., 2005; Vikhlinin et al., 2006).
We have previously reported a very high mass concentration, , in the low mass fossil group NGC 6482 (Khosroshahi et al., 2004). A recent study by Humphrey et al. (2006) finds high values of mass concentration for a sample of early type galaxies, after accounting for the baryons, however only NGC 6482 qualifies as a fossil, all the other low mass systems in this sample being too X-ray dim.
More recently we found a mass concentration of in the fossil cluster, RX J1416.4+2315(Khosroshahi et al., 2006), which is also high for a cluster. In the case of this massive fossil, our study showed that the stellar mass is not a major contributor, and the mass concentration reduces only slightly, to when the stellar contribution accounted for. Fitting an NFW profile to the total mass distribution, Sun et al. (2004) found a concentration of for the fossil system ESO 3060170. While its possible that the NFW profile is not the best model to describe the dark matter distribution in fossils, all the existing data seem to indicate that the total mass concentration in fossils is higher than that observed in non-fossil systems of similar mass (Pratt & Arnaud, 2005).
Fig 9 shows the variation of the mass concentration, , for fossils and non-fossils (Pratt & Arnaud, 2005) with the total halo mass. It also shows the expected mass concentration of dark matter halos from numerical models (Bullock et al., 2001; Dolag et al., 2004). In general the mass concentration of fossil lie above the expectations. In their recent study of relaxed clusters Vikhlinin et al. (2006) find slightly higher values of mass concentration, when fitting and NFW profile to the total density excluding the region associated with the central brightest cluster galaxy 0.05, but the difference is not as pronounced as in fossils. They argue this to be due to the selection effect as they focus on relaxed clusters and/or the radiative cooling of baryons and the associated galaxy formation. They estimate the effect to be in clusters which is equivalent of . It appears that the excess concentration seen in fossil systems is generally more than it can be explained by the Vikhlinin et al. (2006) arguments.
Distinction has to be made between the mass concentration and the dark matter concentration. As we see in Fig 9 in the more massive systems the difference between the two is reduced due to relatively small contribution from the stellar mass. The fossils in this figure are directly comparable to the non-fossil values of Pratt & Arnaud (2005), for a given mass, as they both refer to mass concentration. Given the good overlap between the values of Pratt & Arnaud (2005) and the predicted dark matter concentration (Dolag et al., 2004), we argue that the offset is mainly due to higher dark matter concentration in fossils.
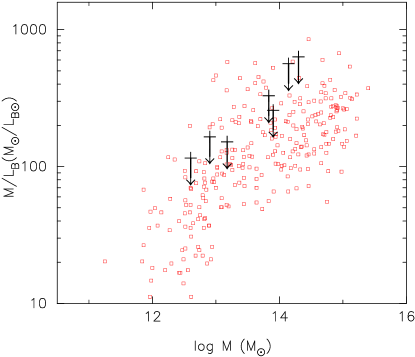
5.6 Mass-to-light ratio
There have been conflicting findings on the mass-to-light ratio of fossil groups. While Vikhlinin et al. (1999) report a high mass to light ratio for OLEGs, we found a normal ratio for the low mass fossil NGC 6482 (Khosroshahi et al., 2004). The value reported for ESO 3060170 is not high either. The M/L values reported for two of the systems in Yoshioka et al. (2004) are very high, but this is not surprising considering that these authors added only 10-20% to the luminosity of the central galaxy to account for the luminosity of the rest of the galaxies in the group. Recent studies of the galaxy luminosity function in fossils (Khosroshahi et al., 2006; , 2006) show that non-brightest galaxies contribute at least as much as the brightest galaxy to the total luminosity of the group. This can lower the value of the mass-to-light ratio by a significant factor.
The method used here to estimate the total R-band luminosity of fossils is described in section 4.1. To estimate the B-band luminosity we can assume B-R=1.5 for the member galaxies, which would be appropriate if all were early-type galaxies. In practice, this assumption results in an underestimation of the total B-band luminosity, and hence give an upper limit for the B-band mass-to-light ratio of fossils.
Lower and higher values of M/L are also reported for galaxy clusters and groups. There are relatively large errors in the estimation of M/L because of uncertainties in the total masses, and the difficulties in obtaining a precise estimate of the optical luminosity of groups. For example, there is a factor of 2 difference between the aperture luminosities quoted in Girardi et al. (2002), based on APM and COSMOS data. Sanderson and Ponman (2003) evaluated a logarithmic mean value for M/LB, of , substantially lower than the ordinary, arithmetic mean value of .
Fig 10 shows the M/LB for galaxy clusters, rich and poor, from the study by Girardi et al. (2002) and the same for fossil galaxy groups in our sample within the virial radius. We give two estimates for the fossils. Firstly assuming that all the groups members are early-type galaxies with (B-R=1.5), and secondly assuming that all the groups members, except the dominant galaxy, are late-types (B-R=0.8). This gives a lower limit for M/L in the B-band. Based on our estimate of the contribution from the non-central galaxy to the total luminosity of the group (section 4.1) and the above argument, the mass-to-light of OLEGs studied by Yoshioka et al. (2004) should also be reduced typically by half and would therefore overlap with the range of the M/L presented for fossils in this study.
6 Discussion and Conclusions
We have presented various X-ray related scaling relations for the largest sample of fossil groups with high resolution X-ray data from Chandra observations. The main results are as follows:
-
•
Fossils are more X-ray luminous for a given total optical luminosity of the group across the full mass range.
-
•
No noticeable difference is found in the relation of fossils compared to non-fossil groups and clusters.
-
•
There is no systematic difference in the plane of between fossils and non-fossil groups and clusters.
-
•
For a given group velocity dispersion, fossils are hotter and more X-ray luminous than non-fossil groups in the group regime. However, they tend to follow galaxy clusters in the and planes.
-
•
The scaling of the gas entropy with the temperature in fossils resembles a self-similar scaling – the cooler fossils show much less excess entropy than normal galaxy groups.
-
•
Total gravitational mass is more centrally concentrated in fossil groups and clusters compared to non-fossil systems.
-
•
The relation suggests that fossil groups are somewhat hotter than non-fossil systems, for a given total mass of the group.
-
•
The mass-to-light ratio of fossils falls in the upper envelope of the values seen in normal groups and clusters.
The first four of these results indicate that although fossil groups fall on the same relation as normal groups and clusters, this results from enhancement in both and , compared to normal groups, for systems of a given mass or optical luminosity. This difference in properties could in principle arise in two different ways. It could be driven by differences in the gravitational potential of fossils, or from a distinction in the properties of the hot gas (within a similar potential). Or, of course, both factors could contribute.
In favour of the first option, we have the observed evidence that the potential is more cuspy (i.e. has higher concentration parameter) in fossils (Fig.9). This will lead to greater compression of gas in the inner regions of the system, and hence to both higher and enhanced X-ray emissivity. However, such a situation might be expected to lead to enhanced cooling, which would in turn raise the entropy of the gas in the inner regions, as a result either of the removal of low entropy gas, or due to triggering of feedback from AGN or star formation (Voit & Bryan, 2001). Given the observation (Fig.7) that the entropy in fossil groups is actually lower than that in other groups, it seems unlikely that the difference in gravitational potential can be the whole story.
A second option, suggested by the result that the entropy in fossils is close to a self-similar extrapolation from high mass clusters, with much less sign of excess entropy than is seen in typical groups, is that the mechanisms which raise the entropy of the intergalactic medium (IGM) have functioned much less effectively within fossil systems. Ponman et al. (2003) pointed out that the large excess entropy seen outside the core of groups was unlikely to be achieved by feedback operating after virialisation, and Voit et al. (2003) and Ponman et al. (2003) suggested that instead, most feedback operates within the IGM before it falls into groups, reducing density contrasts in the pre-collapse gas and leading to higher post-shock entropy once the gas crosses the accretion shock during group formation. Within this scenario, the lower entropy seen in fossil groups could be a natural consequence of their very early formation, since feedback from supernovae or AGN within galaxies would have less time to operate before the gas is incorporated into the virialising group. Subsequent cooling could still lead to a rise in entropy, but is now believed (Voit & Donahue, 2005; Peterson et al., 2003) to be limited by feedback from central AGN within groups and clusters.
Table 2 shows that for most of the systems the regions used for the spectral analysis cover a reasonable fraction of . There are however two cases where the spectral extraction regions are small. NGC 6482 is probably the most critical one because of its low mass. The detailed study of the target (Khosroshahi et al., 2004) shows no sign of a cool core in this fossil. Therefore no correction for the cool core was needed. In fact the other fossils with resolved temperature profiles show no sign of a cool core either. ESO 3060170 has a cool core of about 10 kpc (Sun et al., 2004) much less than the typical assumed for the cool core exclusion. Similarly RX J1416.4+2315 gives no indication of the cool core presence (Khosroshahi et al., 2006). This could be one reason why the mean temperature of fossils appears boosted. It is not clear if this is the work of AGNs, as they are present in almost all central cluster galaxies regardless of their status as fossils or non-fossils.
In summary, then, we suggest that the difference in the gas properties of fossil systems, especially in the group regime, results in two ways from their early formation epoch. Firstly the cuspy potential tends to raise the luminosity and temperature of the IGM, however this works in conjunction with the lower gas entropy (especially in lower mass systems) compared to normal groups, which may arise from less effective preheating of the gas in these early-forming systems. The rather high mass-to-light ratios seen in fossils (Fig.10) also suggests that galaxy formation efficiency may be rather low in these systems, another likely result of the early shock heating of their IGM.
7 Acknowledgements
We would like to thank the Issac Newton Group of telescopes for the INT service observations, John Mulchaey for his involvement in the spectroscopic observations and the anonymous referee for constructive comments which helped to improve the content and the presentation of the paper. We would like to thank Arif Babul, Ben Maughan and Ewan O’Sullivan for useful discussions and comments. Alastair Sanderson has kindly provided the entropy and total mass estimates for comparison. This research has made use of the NASA/IPAC Extragalactic Database (NED) which is operated by the Jet Propulsion Laboratory, California Institute of Technology, under contract with the National Aeronautics and Space Administration.
References
- Allen & Fabian (1998) Allen, S. W., and Fabian, A. C. 1998, MNRAS, 297, L57
- Arnaud, Pointecouteau & Pratt (2005) Arnaud M., Pointecouteau E., Pratt G. W., 2005, A&A, 441, 893
- Binney & Tremaine (1987) Binney J. and Tremaine S., 1987, Galactic Dynamics. Princeton Univ. Press, Princeton, NJ
- Bullock et al. (2001) Bullock J. S. et al. , 2001, 321, 559
- Cypriano, Mendes de Oliveira, & Sodré (2006) Cypriano E. S., Mendes de Oliveira C., Sodré Jr. L., 2006, AJ, …
- Dolag et al. (2004) Dolag et al. 2004,
- Dubinski (1998) Dubinski, J. 1998, ApJ, 502, 141
- Evrard, Metzler & Navarro (1996) Evrard A. E., Metzler C. A., Navarro J. F., 1996, ApJ, 469, 494
- Finoguenov et al. (2001) Finoguenov A., Reiprich T. H., Bohringer, H., 2001, A&A, 368, 749
- Girardi et al. (1998) Girardi M., Giuricin G., Mardirossian F., Mezzetti M., Boschin W., 1998, ApJ, 505, 74
- Girardi et al. (2002) Girardi M., Manzato P., Mezzetti M., Giuricin G., Limboz F., 2002, ApJ, 569, 720
- Helsdon & Ponman (2000) Helsdon S. F., Ponman T. J., 2000a, 315, 356
- Helsdon & Ponman (2003) Helsdon S. F., Ponman T. J., 2003, MNRAS, 340, 485
- Humphrey et al. (2006) Humphrey P. J. et al. , 2006, ApJ, in press (astro-ph/0601301)
- Jones et al. (2003) Jones L. R., Ponman T. J., Horton A., Babul A., Ebeling H., Burke D. J., 2003, MNRAS, 343, 627
- Jones et al. (2000) Jones L. R., Ponman T. J., Forbes D.A., 2000, MNRAS, 312, 139
- Jones et al. (1998) Jones L. R., Scharf C., Ebeling H., Perlman E., Wegner G., Malkan M., Horner D., 1998, ApJ, 495, 100
- Khosroshahi et al. (2004) Khosroshahi H. G., Jones L. R. and Ponman T. J., 2004, MNRAS, 349, 1240
- Khosroshahi et al. (2006) Khosroshahi H. G., Maughan B. J, Ponman T. J. & Jones L. R., 2006, MNRAS, 369, 1211
- Khosroshahi, Ponman & Jones (2006) Khosroshahi H. G., Ponman T. J. and Jones L. R., 2006, MNRAS Letters,
- Mahdavi et al. (1997) Mahdavi A., Boehringer H., Geller M. J., Ramella M., 1997, ApJ, 483, 68
- Mahdavi et al. (2000) Mahdavi A., Bohringer H., Geller M. J., Ramella M., 2000, ApJ, 534, 114
- Mahdavi & Geller (2001) Mahdavi A. and Geller M. J., 2001, ApJ, 554, 129
- Markevitch (1998) Markevitch M., 1998, ApJ, 504, 27
- Matsushita (2001) Matsushita K., 2001, ApJ, 547, 693
- Maughan et al. (2006) Maughan B. J., Jones L. R, Ebeling H., Scharf C., 2006 ,MNRAS, 365, 509
- (27) Mendes de Oliveira C., Cypriano E. S., Sodré Jr. L., 2006, AJ,
- Miles et al. (2004) Miles T. A.; Raychaudhury S., Forbes D. A., Goudfrooij P., Ponman T. J., Kozhurina-Platais V., 2004, MNRAS, 355, 785
- Milos et al. (2006) Milos M., Miller C., Furlanetto S., Cooray A., 2006, ApJ 637, L9
- Mulchaey & Zabludoff (1998) Mulchaey J. S., Zabludoff A. I., 1998, ApJ, 496, 73
- Mulchaey & Zabludoff (1999) Mulchaey J. S., Zabludoff A. I., 1999, ApJ, 514, 133
- Mulchaey et al. (2006) Mulchaey J. S., 2006, private communication
- Navarro, Frenk & White (1995) Navarro J. F., Frenk C. S., White S. D. M., 1995, MNRAS, 275, 720
- Neumann & Böhringer (1995) Neumann D. M., Böhringer H., 1995, A&A, 301, 865
- Osmond & Ponman (2004) Osmond & Ponman 2004, MNRAS, 350, 1511
- Perlman et al. (2002) Perlman E. S., Horner D. J., Jones L. R., Scharf C. A., Ebeling H., Wegner G., Malkan M.,2002, ApJS, 140, 265
- Peterson et al. (2003) Peterson J. R. et al. ., 2003, ApJ, 590, 207
- Pointecouteau et al. (2005) Pointecouteau E., Arnaud M., Pratt G. W., 2005, A&A, 435, 1
- Ponman et al. (1994) Ponman T. J., Allan D. J., Jones L. R., Merrifield M., MacHardy I. M., 1994, Nature, 369, 462
- Ponman et al. (1999) Ponman T. J., Cannon D. B., Navarro J. F., 1999, Nature, 397, 135
- Ponman et al. (2003) Ponman T. J., Sanderson A. J., Finoguenov A., 2003, MNRAS, 343, 331
- Ponman et al. (1996) Ponman T. J., Bourner P. D. J., Ebeling H., B hringer H., 1996, MNRAS, 283, 690
- Ponman et al. (2003) Ponman T. J., Sanderson A. J. R., Finoguenov A., 2003, MNRAS, 343, 331
- Pratt & Arnaud (2005) Pratt G. W., Arnaud M., 2005, A&A, 429, 791
- Rasmussen et al. (2006) J. Rasmussen, T. J. Ponman, J. S. Mulchaey, T. A. Miles, S. Raychaudhury 2006, MNRAS, MNRAS, 373, 653
- Ramella, Geller & Huchra (1989) Ramella M., Geller M. J., Huchra J. P., 1989, ApJ, 344, 57
- Romer et al. (2000) Romer A. K. et al. , 2000, ApJS, 126, 209
- Sanderson et al. (2003) Sanderson A. J., Ponman T. J., Finoguenov A., Lloyd-Davies E. J., Markevitch M., 2003, MNRAS, 340, 989
- Scharf et al. (1997) Scharf C. A., Jones L. R., Ebeling H., Perlman E., Malkan M., Wegner G., 1997, ApJ, 477, 79
- Smith et al. (2001) Smith R. K., Brickhouse N. S., Liedahl D. A., Raymond J. C., 2001, ApJ, 556, L91
- Sun et al. (2003) Sun M., Forman W., Vikhlinin A., Hornstrup A., Jones C., Murray S. S., 2003, ApJ, 598, 250
- Sun et al. (2004) Sun M., Forman W., Vikhlinin A., Hornstrup A., Jones C., Murray S. S., 2004, ApJ, 612, 805
- Vikhlinin et al. (1999) Vikhlinin A., McNamara B. R., Hornstrup A., Quintana H., Forman W., Jones C., Way M. 1999, ApJ, 520, 1
- Vikhlinin et al. (2006) Vikhlinin A., Kravtsov A., Forman W., Jones C., Markevitch M., Murray S. S., Van Speybroeck L., 2006, ApJ, 640, 691
- Voit & Bryan (2001) Voit G. M., Bryan G. L., 2001, Nature, 414, 425
- Voit et al. (2003) Voit G. M. Balogh M. L., Bower R. G., Lacey C. G., Bryan G. L., 2003, ApJ, 593, 272
- Voit & Donahue (2005) Voit G. M., and Donahue M., 2005, ApJ, 634, 955
- Wechsler et al. (2002) Wechsler R. H. et al. , 2002, ApJ, 568, 52
- White, Jones & Forman (1997) White D. A., Jones C., & Forman W. 1997, MNRAS, 292, 419
- Willis et al. (2005) Willis et al. 2005, MNRAS, 363, 675
- Wu, Xue & Fang (1999) Wu X.-P., Xue H., & Fang L.-Z. ,1999, ApJ, 524, 22
- Xue & Wu (2000) Xue Y. J., and Wu, X. P. 2000, ApJ, 538, 65
- Xue, Jin & Wu (2001) Xue, H., Jin, G., & Wu, X.-P. 2001, ApJ, 553, 78
- Yoshioka et al. (2004) Yoshioka T., Furuzawa A., Takahashi S., Tawara Y., Sato S., Yamashita K., Kumai Y., 2004, Adv. in Space Res, 34, 2525
- Zabludoff & Mulchaey (1998) Zabludoff A. I. & Mulchaey J. S., 1998, ApJ, 496, 39
8 Appendix - Notes on individual systems
8.1 RX J1256.0+2556
There has been an uncertainty in the formal classification of this system as a fossil (Jones et al., 2003) because of the uncertainties in the temperature, and hence in the virial radius. The Chandra observation still does not provide enough photon counts for a detailed analysis of this system, but the spectral fit gives a mean temperature within the central 100 arcsec. With the current estimate of the temperature, keV, the virial radius is the optical criterion mag is not met, as there exists one galaxy, spectroscopically confirmed, at a projected distance of 550 kpc from the central galaxies with . A recent XMM-Newton analysis of this system (Mulchaey et al., 2006) gives a hot gas temperature of keV. Given the large uncertainty in the temperature, the group could be a fossil. Thus we include it in our analysis and treat it as a fossil. We find no noticeable difference between this system and other confirmed fossils in its X-ray and optical properties.
8.2 RX J1331.5+1108
There was an uncertainty in the X-ray luminosity of diffuse, hot gas in this source in the earlier study (Jones et al., 2003) because of the possibility of point-source contamination. We measure the total X-ray luminosity within a 75 arcsec radius region, from which the spectrum was extracted, to be (0.3-8.0 keV). The bolometric luminosity from within (see section 5.3 for the estimation ), from extrapolation, is . We therefore confirm that this system meets the fossil criteria based on its X-ray properties. The spectroscopic membership observations show that the optical criteria is also met and therefore the system is a fossil group.
The central galaxy, at the X-ray peak, has narrow H and [SII] emission lines. An unresolved ( arcsec) mJy radio source at 1.4 GHz is coincident with the central galaxy (from the FIRST survey; White et al. 1997). This flux corresponds to a power of erg s-1 Hz-1 at 1.4 GHz, similar to that of the first fossil system found by Ponman et al. (1994) and Jones et al. (2000), and comparable to values found for radio-loud cD galaxies in cluster cores.
8.3 RX J1340.5+4017
This is the original fossil galaxy group studied by Jones et al. (2000) in detail. The optical properties, including deep R-band photometry and spectroscopy of the central galaxy, are discussed in Jones et al. (2000). We use a circular region of 75 arcsec radius for the global spectrum extraction. A more detailed analysis of this system, combining optical and X-ray observations is underway. The relatively longer observation of the target shows significant asymmetry in the X-ray emission of the group in the core. The X-ray emission is elongated and is aligned with the central galaxy.
8.4 RX J1416.4+2315
This is the most massive and hot fossil system known, and is effectively a fossilcluster. Details of its X-ray properties from combined Chandra and XMM-Newton observations, as well as optical photometry and spectroscopy of this galaxy cluster can be found in Khosroshahi et al. (2006). A galaxy luminosity function of the system has been derived by Cypriano, Mendes de Oliveira, & Sodré (2006).
8.5 RX J1552.2+2013
The X-ray observation of this target is relatively short, but the X-ray emission is clearly extended. The background, bright QSO point source 2.5 arcmin west of RX J1552.2+2013, at z= 0.25, was excluded. A 60 arcsec radius region was used for the global spectral analysis.
Three point X-ray sources were detected in the core of the system matching the position of the central giant elliptical galaxy and two other galaxies belonging to the group. This is a rare incident as the three seem to be perfectly aligned and are separated by an equal distance of about 22 arcsec from each other. There appears to be an offset of about 5 arcsec (see Fig 1) between the centroid of the X-ray emission and the the centre of the giant elliptical galaxy in this fossil. This offset is unlikely to be real. The optical astrometry should be good to 1 arcsec, but the determination of the X-ray centroid is significantly worse, due to the limited counts, and additional uncertainties arising from the removal of an X-ray point source associated with the central galaxy. A galaxy luminosity function for this fossil system is given in (2006).