Stellar Populations: High Spectral Resolution Libraries. Improved TP-AGB Treatment
Abstract
I present a short description of the STELIB, HNGSL, IndoUS, MILES, ELODIE, UVES-POP, and IRTF libraries of empirical stellar spectra and show some applications of their use in population synthesis models. When new calculations of the TP-AGB evolutionary phase for stars of different mass and metallicity are included in population synthesis models, the stellar mass in galaxies at z from 1 to 3 determined from spectro-photometric data can be up to 50% lower than the mass determined from the BC03 models. The ages inferred for these populations are considerably lower than the BC03 estimates.
CIDA, AP 264, Mérida, Venezuela
1. Introduction
In a series of conference papers appeared in the past two years, Bruzual (2004, 2005), I present evolutionary population synthesis models which are identical in all respects to the Bruzual & Charlot (2003) models, hereafter BC03, except in the stellar library used. BC03 use the STELIB library compiled by Le Borgne et al. (2003). In these papers I explore models built with libraries of higher spectral resolution and which improve upon STELIB on the coverage of the HRD by including at all metallicities a broader and more complete distribution of spectral types and luminosity classes. For reasons of space I present here only a summary of results. The reader is referred to the previous papers, available electronically, for details. The full implementation of the new libraries in the population synthesis models is in preparation by Charlot & Bruzual (2007).
STELIB includes observed spectra of 249 stars in a wide range of metallicities in the wavelength range from 3200 Å to 9500 Å at a resolution of 3 Å FWHM (corresponding to a median resolving power of ), with a sampling interval of 1 Å and a signal-to-noise ratio of typically 50 per pixel.
HNGSL, the Hubble’s New Generation Spectral Library (Heap & Lanz 2003) contains spectra for a few hundred stars whose fundamental parameters, including chemical abundance, are well known from careful analysis of the visual spectrum. The spectra cover fully the wavelength range from 1700 Å to 10,200 Å. The advantage of this library over the ones listed below is the excellent coverage of the near-UV and the range from 9000 Å to 10,200 Å, which is generally noisy or absent in the other data sets.
The IndoUS library (Valdes et al. 2004) contains complete spectra over the entire 3460 Å to 9464 Å wavelength region for 885 stars obtained with the 0.9m Coudé Feed telescope at KPNO. The spectral resolution is 1 Å and the dispersion 0.44 Å pixel-1. The library includes data for an additional 388 stars, but only with partial spectral coverage. See Bruzual (2005) for a discussion of the flux calibration problems in the IndoUS library.
MILES, the Medium resolution INT Library of Empirical Spectra (Sánchez-Blázquez et al. 2006), contains carefully calibrated and homogeneous quality spectra for 985 stars in the wavelength range 3525 Å to 7500 Å with 2.3 Å spectral resolution and 0.9 Å pixel-1 sampling. The stars included in this library were chosen aiming at sampling stellar atmospheric parameters as completely as possible.
The ELODIE library is a stellar database of 1959 spectra for 1503 stars, observed with the échelle spectrograph ELODIE on the 193 cm telescope at the Observatoire de Haute Provence. The resolution of this library is in the wavelength range from 4000 Å to 6800 Å (Prugniel & Soubiran 2001a, b). This library has been updated, extended, and used by Le Borgne et al. (2004) in the version 2 of the population synthesis code PEGASE.
The UVES Paranal Observatory Project (Bagnulo et al. 2004), has produced a library of high resolution () and high signal-to-noise ratio spectra for over 400 stars distributed throughout the HRD. For most of the spectra, the typical final SNR obtained in the V band is between 300 and 500. The UVES POP library is the richest available database of observed optical spectral lines.
Progress in compiling libraries at IR wavelengths has been slower than in the optical range. The IRTF Spectral Library, Rayner, Vacca, & Cushing (2007), provides high S/N spectra for stars covering most of the HR diagram: 333 stars with spectral types W-R through M, plus 14 L and T stars. The spectra cover the wavelength range from 0.8 to 4.2 (in some cases out to 5.0 ). R=2000 for the 0.8-2.5 range and R=2500 for the 2.5-5.0 range. The spectra are corrected for telluric absorption and then absolutely flux calibrated. In addition, the spectra have been tied to the 2MASS mags when possible. A good fraction of the data is available electronically and ready to be used in synthesis models. Preliminary descriptions of these data can be found in Rayner et al. (2003) and Cushing, Rayner, & Vacca (2005).
A parallel effort by Mármol-Queraltó & Cardiel (2007) will produce a library of stellar spectra in the K band for a subset of the stars in the MILES library, insuring an adequate coverage of stellar physical parameters and non-solar abundance ratios.
There are several on-going projects to improve the existing grids of theoretical model atmospheres including the computation of high resolution theoretical spectra for stars whose physical parameters are of interest for population synthesis. See, for example, Coelho et al. (2007) and references therein.
2. Use of Different Libraries in Population Synthesis Models
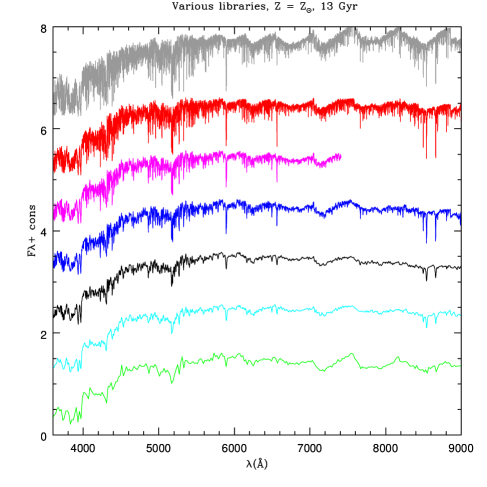
The ’standard’ BC03 reference model represents a simple stellar population (SSP) computed using the Padova 1994 evolutionary tracks, the Chabrier (2003) IMF truncated at 0.1 and 100 M⊙, and either the STELIB or the BaSeL 3.1, Westera et al. (2002), spectral libraries (see BC03 for details). For illustration purposes I show in Fig 1 the 13 Gyr spectral energy distribution (SED) in the optical range for the solar metallicity standard reference SSP model computed with the following spectral libraries (top to bottom in decreasing order of spectral resolution): Coelho et al. (2007), IndoUS, MILES, STELIB, HNGSL, Pickles (1998), and BaSeL 3.1.
The higher resolution models do not provide new information in what respects to color or color evolution, i.e., all the SEDs in Fig 1 have the same overall shape. The major advantage of using high spectral resolution models is to study absorption features. The behavior of line strength indices defined in lower resolution spectra can be explored in detail in the higher resolution SEDs. In some instances, e.g some of the Lick indices, the high resolution spectra show clear evidence that the wavelength intervals defining these indices should be revised because of contamination by other chemical elements. More important, the high resolution spectra provide the opportunity to define new line strength indices that measure the intensity of absorption lines that are unnoticeable in low resolution spectra.
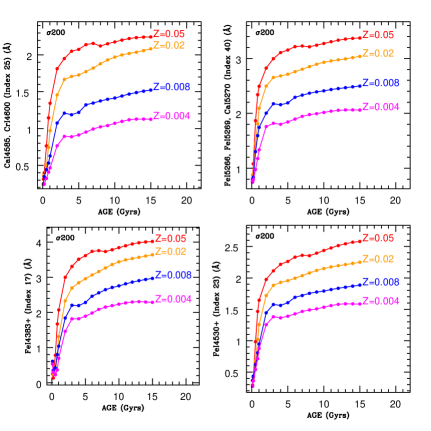
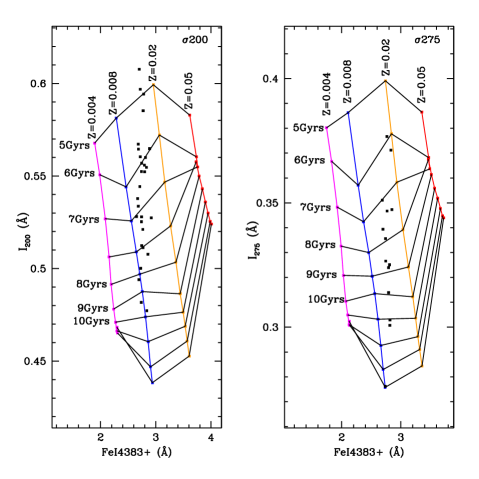
Fig 2 shows the behavior in time of several new spectral indices defined by Stock (2007) upon inspection of the IndoUS version of the BC03 models. For ages above 5 Gyr any of these indices is a good indicator of the metallicity of the stellar population. When combined with indices that are good age indicators, such as the I200 and I275 indices defined by Vazdekis & Arimoto (1999), we obtain close to orthogonal index-index diagrams in which the age-metallicity degeneracy is broken and can be used to establish approximate ages for the stellar populations in early-type galaxies, cf. Fig. 3. The data points in Fig. 3 represent the values of these indices measured in very high S/N coadded SDSS spectra of early-type galaxies (J. Brinchmann, private communication) with velocity dispersion close to the value indicated in each frame. A tendency is observed for most massive galaxies being older and more metal rich.
2.1. Improved TP-AGB treatment
It has been pointed out by several authors, e.g. Maraston et al. (2006), Kannappan & Gawiser (2007), that the estimates of the age and mass of the stellar population present in a galaxy depend critically on the ingredients of the stellar population model used to fit the galaxy spectrum. Maraston et al. (2006) have shown that the treatment of the thermally pulsing asymptotic giant branch (TP-AGB) phase of stellar evolution is a source of major discrepancy in the determination of the spectroscopic age and mass of high-z galaxies. The mid-UV spectra of these galaxies indicate ages in the range from 0.2-2 Gyr, at which the contribution of TP-AGB stars in the rest-frame near-IR sampled by Spitzer is expected to be at maximum. Maraston et al. (2006) find that in general the Maraston (2005) models (M05 hereafter) provide better fits than the BC03 and other models available in the literature, and indicate systematically lower ages and, on average, 60% lower masses for the stellar populations sampled in these galaxies. According to Maraston et al. (2006) the source of this discrepancy is primarily a consequence of the different treatment of the TP-AGB phase in the evolutionary models.
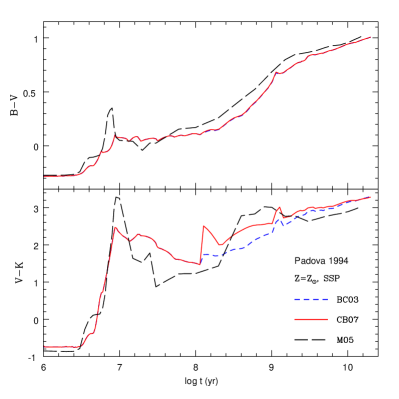
Marigo et al. (2007) have recently concluded new calculations of the TP-AGB evolutionary phase for stars of different mass and metallicity. The evolution of the stars is now computed accounting for the changes in the chemical composition of the envelopes. As a consequence of this prescription, the signature of TP-AGB stars around 1 Gyr, i.e the red color of the integrated stellar population, becomes more important. Fig. 4 compares the B-V and V-K color evolution of models computed using the Marigo et al. (2007) TP-AGB evolutionary tracks (Bruzual & Charlot 2007, CB07 hereafter) with the same for the BC03 and M05 models. In B-V the CB07 and BC03 models are identical at all ages. At early and late ages both sets of models have the same V-K color. At intermediate ages the CB07 models are considerably redder than the BC03 models. At late ages, the BC03 and CB07 models match very well the observations of nearby early-type galaxies, whereas the M05 models are too blue.
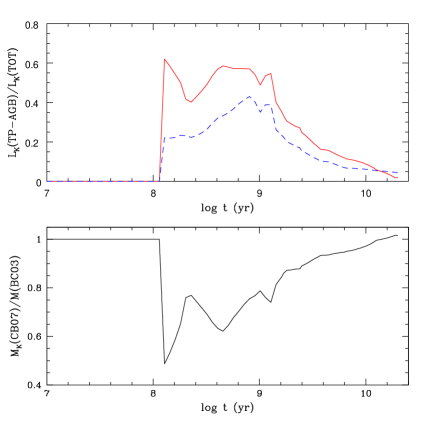
Fig. 5 compares the evolution of the fraction of the K-band luminosity emitted by TP-AGB stars in a solar metallicity SSP for the CB07 and the BC03 models. At maximum, the TP-AGB contributes 60% of the K-light in the CB07 model but only 40% in the BC03 model. The peak emission in the BC03 model occurs at around 1 Gyr whereas in the CB07 model it stays high and close to constant from 0.1 to 1 Gyr. The bottom frame of Fig. 5 shows that the stellar mass determined from the CB07 model can be up to 50% lower than the mass determined from the BC03 model. The lower CB07 values are in agreement with the masses determined by Maraston et al. (2006). See Bruzual (2006) and Charlot & Bruzual (2007) for details.
Acknowledgments.
I thank Cesare Chiosi for his contribution to making all of this possible, Paola Marigo and Leo Girardi for providing their calculations of the TP-AGB evolutionary phase ahead of publication, and Stéphane Charlot for allowing me to show results of a joint paper in preparation.
References
- Bagnulo et al. (2004) Bagnulo, S., Jehin, E., Ledoux, C., Cabanac, R., Melo, C., Gilmozzi, R. and the ESO Paranal Science Operations Team 2003, The Messenger, 114, 10
- Bertone et al. (2004) Bertone, E., Buzzoni, A., Rodríguez-Merino, L. H., & Chávez, M. 2004, MmSAI, 75, 158
- Bruzual (2004) Bruzual A., G. 2004, in Proceedings of the IAU Symposium No. 222 “The Interplay Among Black Holes, Stars, and ISM in Galactic Nuclei”, eds. T. Storchi-Bergmann, L.C. Ho, and H.R. Schmitt, Cambridge: Cambridge University Press, 121, astro-ph/0701922
- Bruzual (2005) Bruzual A., G. 2005, in Proceedings of the Meeting “Resolved Stellar Populations”, eds. D. Valls-Gabaud and M. Chávez, ASP Conf. Ser. (in press) astro-ph/0701907
- Bruzual (2006) Bruzual A., G. 2006, in Proceedings of the IAU Symposium No. 241 “Stellar populations as building blocks of galaxies”, eds. A. Vazdekis and R. Peletier, Cambridge: Cambridge University Press, in press
- Bruzual & Charlot (2003) Bruzual A., G. & Charlot, S. 2003, MNRAS, 344, 1000
- Chabrier (2003) Chabrier, G. 2003, PASP, 115, 763
- Charlot & Bruzual (2007) Charlot, S. & Bruzual A., G. 2007, MNRAS, in preparation
- Cid-Fernandes et al. (2005) Cid-Fernandes, R., Mateus, A., Laerte, S. Jr, Stasinska, G., & Gomes, J. M. 2005, MNRAS, 358, 363
- Coelho et al. (2007) Coelho, P., Bruzual A., G., Charlot, S., Weiss, A., Ferguson, J.W., & Barbuy, B. 2007, MNRAS (in press)
- Cushing, Rayner, & Vacca (2005) Cushing, M. C., Rayner, J. T., & Vacca, W. D. 2005 ApJ, 623, 1115
- Heap & Lanz (2003) Heap, S. R., & Lanz, T. 2003, in Proceedings of the ESO-USM-MPE “Workshop on Multiwavelength Mapping of Galaxy Formation and Evolution”, ESO Astrophysics Symposia, eds. R. Bender and A. Renzini
- Kannappan & Gawiser (2007) Kannappan, S.J., & Gawiser, E. 2007 ApJ Letters, in press, astro-ph/0701749
- Le Borgne et al. (2003) Le Borgne, J.-F., Bruzual A., G., Pelló, R., Lançon, A., Rocca-Volmerange, B., Sanahuja, B., Schaerer, D., Soubiran, C., & Vílchez-Gómez, R. 2003, A&A, 402, 433
- Le Borgne et al. (2004) Le Borgne, D., Rocca-Volmerange, B., Prugniel, P., Lançon, A., Fioc, M., & Soubiran, C. 2004, A&A, 425, 881
- Maraston (2005) Maraston C. 2005 MNRAS, 362, 799
- Maraston et al. (2006) Maraston C., Daddi E., Renzini A., Cimatti A., Dickinson M., Papovich C., Pasquali A., & Pirzkal, N. 2006, ApJ, 652, 85
- Marigo et al. (2007) Marigo et al. 2007, in preparation
- Mármol-Queraltó & Cardiel (2007) Mármol-Queraltó, E., & Cardiel, N. 2007, in preparation
- Pickles (1998) Pickles, A. J. 1998, PASP, 110, 863
- Prugniel & Soubiran (2001a) Prugniel, P., & Soubiran, C. 2001a, A&A, 369, 1048
- Prugniel & Soubiran (2001b) Prugniel, P., & Soubiran, C. 2001b, VizieR Online Data Catalog, 3218
- Rayner et al. (2003) Rayner, J.T., Toomey, D.W., Onaka, P.M., Denault, A.J., Stahlberger, W.E., Vacca, W.D., Cushing, M.C., & Wang, S. 2003 PASP, 115, 362
- Rayner, Vacca, & Cushing (2007) Rayner, J. T., Vacca, W. D., & Cushing, M. C., 2007, in preparation
- Sánchez-Blázquez et al. (2006) Sánchez-Blázquez, P., Peletier, R.F., Jiménez-Vicente, J., Cardiel, N., Cenarro, A. J., Falcón-Barroso, J., Gorgas, J., Selam, S. & Vazdekis, A. 2006, MNRAS, 371, 703
- Stock (2007) Stock, J. 2007, in preparation
- Valdes et al. (2004) Valdes, F., Gupta, R., Rose, J. A., Singh, H. P., & Bell, D. J. 2004, ApJS, 152, 251
- Vazdekis & Arimoto (1999) Vazdekis, A., & Arimoto, N. 1999, ApJ, 525, 144
- Westera et al. (2002) Westera, P., Lejeune, T., Buser, R., Cuisinier, F., & Bruzual A., G. 2002, A&A, 381, 524