On the Origin of Mass–Metallicity Relations, Blue Tilts, and Scaling Relations for Metal-poor Globular Cluster Systems
Abstract
We investigate formation processes and physical properties of globular cluster systems (GCSs) in galaxies based on high-resolution cosmological simulations with globular clusters. We focus on metal-poor clusters (MPCs) and correlations with their host galaxies by assuming that MPC formation is truncated at a high redshift (). We find that the correlation between mean metallicities () of MPCs and their host galaxy luminosities () flattens from to . We also find that the observed relation () in MPCs can be reproduced well in the models with at when , if mass-to-light-ratios are assumed to be constant at . A flatter at is found to be required to explain the observed relation for constant mass-to-light-ratio models with lower . However, better agreement with the observed relation is found for models with different mass-to-light-ratios between and . It is also found that the observed color-magnitude relation of luminous MPCs (i.e., “blue tilts”) may only have a small contribution from the stripped stellar nuclei of dwarf galaxies, which have nuclei masses that correlate with their total mass at . The simulated blue tilts are found to be seen more clearly in more massive galaxies, which reflects the fact that more massive galaxies at are formed from a larger number of dwarfs with stellar nuclei formed at . The half-number radii () of GCSs, velocity dispersions of GCSs (), and their host galaxy masses () are found to be correlated with one another such that and . Based on these results, we discuss the link between hierarchical merging histories of galaxies and the physical properties of MPCs, the origin of the relation, and non-homology of GCSs.
keywords:
globular clusters: general – galaxies: star clusters – galaxies:evolution – galaxies:stellar content1 Introduction
A growing number of observational studies of globular cluster systems (GCSs) have revealed interesting correlations between physical properties of GCSs and those of their host galaxies (see Brodie & Strader 2006 for a recent review). For example, Strader et al. (2004) found that mean colors of metal-poor globular clusters (GCs) correlate with luminosities of their host galaxies and accordingly suggested that mean GC metallicities () depend on luminosities () of their host galaxies such that . Similar results () were found using the Advanced Camera for Surveys on the Hubble Space Telescope (HST) by Peng et al. (2006; P06). Brodie & Strader (2006) have suggested that the relation was steeper in the past. They argue that more enriched metal-poor GCs form first in low mass objects (from early collapsing peaks at high redshift). These low-mass building blocks merge, ultimately forming the massive galaxies of high density regions today. Thus the slope, particularly at the high mass end, flattens over time.
Although such observed correlations between the physical properties of GCSs and their host galaxies have been suggested to contain fossil information of galaxy formation and evolution (e.g., Harris 1991; Forbes & Forte 2001; West et al. 2004; Brodie & Strader 2006), the details remain largely unclear owing to the lack of theoretical and numerical studies of GCSs. Based on dissipationless numerical simulations of major galaxy mergers with GCs, Bekki & Forbes (2006) first demonstrated that the GCS radial density profiles dependent on galaxy luminosity can be understood in terms of the number of major merger events experienced. The dependence of GC destruction on host galaxy mass has also been suggested to be important for understanding the inner radial density profiles (Baumgardt 1998; Vesperini et al. 2003; Capuzzo-Dolcetta 2006).
The formation of GCs in low-mass dark matter halos at high redshifts have been investigated by numerical and theoretical studies (e.g., Broom & Clarke 2002; Mashchenko & Sills 2005). Furthermore, the physical properties of GCSs have recently been discussed by several authors based on hierarchical galaxy formation scenarios where GC formation occurs at high redshifts (e.g., Beasley et al. 2002; Kravtsov & Gnedin 2005; Santos 2003; Bekki 2005; Rhode et al. 2005; Yahagi & Bekki 2005; Moore et al. 2006; Bekki et al. 2006; Bekki & Yahagi 2006). For example, Beasley et al. (2002) first demonstrated that the observed bimodal color distributions of GCSs in elliptical galaxies can be reproduced by a semi-analytic galaxy formation model. They also presented GC colour vs galaxy magnitude relations, however they did not fully reproduce the observed trend. Although these previous works discussed some physical properties of GCSs in galaxies, they did not explore in detail. The correlations between GCSs and those of their host galaxy. Thus it remains unclear how the physical properties of GCSs evolve in a hierarchical merging cosmology.
The properties of metal-poor GCs (MPCs) ([Fe/H] ) such as their very old ages, low metallicities and extended spatial distribution all suggest formation at early times, when the low mass building blocks of galaxies formed. The purpose of this current paper is to investigate the physical properties of MPCs and their scaling relations with their host galaxies based on high-resolution cosmological simulations that follow realistic merging and accretion histories of galaxies. We investigate the structural, kinematical, and chemical properties of MPCs. We also present several predictions for the expected correlations between properties of MPC systems (such as half-number radii, effective surface number densities, and velocity dispersions). Since the present model is based on dissipationless simulations of MPC formation within halos at high redshifts, the origin of metal-rich GCs (MRCs) ([Fe/H] ) formed somewhat later during dissipative merging will not be discussed. We plan to investigate MRCs in a future paper by combining the present high-resolution cosmological simulation with semi-analytic models similar to those used by Beasley et al. (2002).
The plan of this paper is as follows: In the next section, we describe our numerical models of MPC formation and their assumed initial properties. In §3, we present our numerical results on (i) relations, (ii) scaling relations between properties of MPCs, and (iii) metallicity-magnitude relations for luminous MPCs in massive galaxies (the so-called ‘blue-tilt’). In §4, we discuss our results. We summarize our conclusions in §5. Appendices explore scaling relation dependency on MS/L and ztrun. Throughout this paper, GCSs in our simulations are composed only of MPCs.
2 The Model
2.1 Identification of MPCs
We simulate the large scale structure of GCs in a CDM Universe with , , km , and by using the Adaptive Mesh Refinement body code developed by Yahagi (2005) and Yahagi et al. (2004), which is a vectorized and parallelized version of the code described in Yahagi & Yoshii (2001). We use collisionless dark matter (DM) particles in a simulation with the box size of Mpc and the total mass of . We start simulations at and follow it until in order to investigate physical properties of old GCs outside and inside virialized dark matter halos. We used COSMICS (Cosmological Initial Conditions and Microwave Anisotropy Codes), which is a package of fortran programs for generating Gaussian random initial conditions for nonlinear structure formation simulations (Bertschinger 1995, 2001).
Our method of investigating GC properties is described as follows. Firstly, we select virialized dark matter subhalos at a truncation redshift by using the friends-of-friends (FoF) algorithm (Davis et al. 1985) with a fixed linking length of 0.2 times the mean DM particle separation. The minimum particle number for halos is set to be 10. For each individual virialized subhalo with a half-mass radius of , particles within are labeled as “GC” particles and are considered to be old MPCs. This procedure for defining GC particles is based on the assumption that energy dissipation via radiative cooling allows baryons to fall into the deepest potential well of dark-matter halos and finally to be converted into GCs. The value of the truncation radius ( = ) is chosen, because the size of the old GCs in the Galactic GC system (i.e., the radius within which most Galactic old GCs are located) is similar to of the dark matter halo in a dynamical model of the Galaxy (Bekki et al. 2005). We assume that old MPC formation is truncated completely after and investigate the dependences of the results on . Physical motivation for the truncation of GC formation is described later.
Secondly, we follow GC particles formed before until and thereby derive locations and velocities of GCs at . We then identify virialized halos at with the FoF algorithm and investigate whether each GC is within a halo. If GCs are found to be within a halo, the mass of the host halo () and physical properties of the GCS are investigated. If a GC is not in any halo, it is regarded as an intergalactic GC. The number fraction of these depends on but is typically less than 1 % (e.g., 0.3 % for ). We don’t consider intergalactic GCs further in this current paper.
Thus, the present simulations enable us to investigate the physical properties only for old MPCs due to the adopted assumption of collisionless simulations. The physical properties of MRCs which may form later during dissipative merger events (e.g., Ashman & Zepf 1992) are not investigated.

2.2 Initial properties of MPCs in galaxy-scale halos
2.2.1 Radial density profiles
We assume that the initial radial profiles of GCSs () in subhalos at are the same as those described by the universal “NFW” profiles (Navarro, Frenk & White 1996) with in their outer parts. The mean mass of subhalos at in the present simulations is roughly similar to the total mass of dwarf galaxies today. Minniti et al. (1996) found that the projected () density profiles of GCSs in dwarfs is approximated as , which translates roughly to using a canonical conversion formula from into (Binney & Tremaine 1987). Therefore, the above dependency can be regarded as reasonable. Below we mainly show the fiducial model with similar to the NFW profiles and .
Although we base our GC models on observational results of GCSs at z=0, we can not confirm whether the above and values are reasonable for GCSs in low-mass subhalos at z 6 owing to the lack of observational data for GCSs at high redshifts. Although our present results on the relation and the blue tilt at do not depend strongly on the initial distributions of MPCs, structural properties of GCSs do depend on the spatial distribution. For example, if we choose smaller at , the final projected number distributions of GCSs becomes more compact.
2.2.2 The – relation
In order to investigate the mean metallicities of MPCs in galaxy-scale halos at , we need to allocate initial metallicities to all GCs formed before . We assume that GCs in a halo at have identical metallicities of and that the metallicities are a function of the total stellar mass (or luminosity) of the halo. Lotz et al. (2004) have found that , where for band luminosities in dEs and dE,Ns. This relation is similar to discovered by Strader et al. (2004). Dekel & Silk (1980) demonstrated that the stellar metallicities () of dwarf galaxies embedded in massive dark matter halos correlate with luminosities () of the dwarfs such that . This translates to if GCs follow field stars in dwarfs. Prompted by these theoretical and observational studies, we adopt the following relation at high redshift between [Fe/H] (or log ) of MPCs and :
| (1) |
where and are set to be 0.5 and -6.0 in the present study. We show the models with these values, because they are more consistent with the observed relation.
In order to derive for halos with masses at , we assume a mass-to-light-ratio () dependent on . Recent observational studies based on galaxy luminosity functions for luminous galaxies suggests that depends on as (Marinoni & Hudson 2002). Dekel & Silk (1986) proposed that for low-luminosity dwarf galaxies, which can be interpreted as . These studies suggest that the -dependences of are different between low- and high-luminosity galaxies (see also Zaritsky et al. 2006). We thus adopt two different -dependent ratios for galaxy-scale halos in the present study. For halos above a threshold halo mass of , we adopt the following:
| (2) |
where is a constant and the value of at . For halos below a threshold halo mass of , we adopt the following:
| (3) |
We assume that and are reasonable values. Since the threshold mass has not yet been so precisely determined by observational studies (e.g., Zaritsky et al. 2006), can be a free parameter in our simulations. We however confirm that this for a reasonable range is not so important as other parameters (e.g., dependences). We thus mainly show the results of the models with .
In calculating from at , we need to derive from at . It is, however, observationally unclear what a reasonable -dependent is for halos at . We accordingly investigate two extreme cases: One is that for all halos at and the other is that the -dependence of is the same between (equations 2 and 3) and . The total stellar mass () of a halo is estimated from by using the adopted -dependent and the following stellar-mass-to-light-ratio ().
It is highly likely that -dependences of are different between different redshifts, because of (i) evolution (e.g., aging) of stellar populations with different ages and metallicities and (ii) evolution of baryonic mass fraction. Although observational studies on the redshift evolution of the “Fundamental Plane” of early type galaxies (e.g., van de Ven et al. 2003) have provided some clues to stellar population evolution it remains observationally unclear whether evolution of baryonic mass fraction is seen in galaxies: kinematical data sets for precisely estimating total masses of galaxies are currently unavailable for very high- galaxies. The present models, which do not allow us to make explicit predictions on redshift evolution of , have difficulties to determine which of the above two is responsible for the possible redshift evolution in -dependences of . We therefore do not intend to discuss the origin of the redshift evolution in -dependences of in the present paper.
The stellar population synthesis models by Vazdekis et al. (1996) for a Salpeter IMF show that in the -band for stellar populations with [Fe/H] = (0.0) is 0.22 (0.39) for 0.5 Gyr and 2.03 (4.84) for 12.6 Gyr. Although depends strongly on age and metallicity of the stellar population, we use a constant of 1 for all halos because of the lack of information on stellar populations in the simulated galaxy-scale halos. A discussion on the dependences on is given in Appendix B.
Given the fact that most of the virialized halos at are of low-mass () then the low-metallicities used to derive should be reasonable. We adopt , which is the average value between 0.5 and 12.6 Gyrs in metal-poor stellar populations both for and for halos with different masses. Although this adoption is more idealized, it helps us to derive more clearly the evolution of the relation between and without having complicated dependences of on ages and metallicities of stars in halos (that can not be modeled directly in the present study). If we adopt a higher (e.g., ), the simulated relation at is shifted to lower metallicities for a given stellar mass but with the same relation slope.
2.2.3 GC Luminosity function
The luminosity function of GCs has been observationally suggested to be universal and have the following form (e.g., Harris 1991):
| (4) |
where is a constant, = , and mag (Harris 1991). We adopt this luminosity function and allocate luminosities to GC particles by generating random numbers for . We note that our results are not very sensitive to the choice of or .
2.3 Initial properties of galactic nuclei
Previous studies have suggested that stellar galactic nuclei (GN) in nucleated low-mass galaxies might be observed as very massive GCs after the host galaxy of the GN is destroyed during merging with, and accretion onto, more massive galaxies (e.g., Zinnecker et al. 1988; Freeman 1993; Bassino et al. 1994; Bekki & Freeman 2003; Bekki & Chiba 2004). The physical properties of very massive GCs in the Galaxy and M31 (e.g., Cen and G1) are observed to be different from those of “normal” GCs (e.g., Freeman 1993). We identify stellar galactic nuclei particles (referred to as GN particles) at and follow their evolution until .
The ACS Virgo Cluster Survey by Côte et al. (2006) recently found that the mass fraction of GN (stellar galactic nuclei) to their host galaxies is typically 0.3% in early-type galaxies. We thus adopt the following relation between the total masses of GN () and the total stellar masses of their hosts :
| (5) |
where is considered to be a free parameter in the present study. Recent observations of stellar populations of SGN in nearby galaxies suggest that GN have a significant contribution from young stellar populations and thus suggest that GN are growing with time (e.g., Walcher et al. 2006). Therefore it is reasonable to adopt an value significantly smaller than today’s 0.3%. We generally adopt but also discuss the dependence of our present results on .
Lotz et al. (2004) and Côte et al. (2006) found a correlation between (or GN luminosities) and colors of GN, which suggests a mass-metallicity relation for GN (i.e., more massive GN are more metal-rich). This correlation and the above - relation implies that more luminous galaxies have more metal-rich GN. Lotz et al. (2004) found that the metallicities of field stars of dE,Ns () correlates with galaxy luminosities () such that . Kravtsov & Gnedin (2005) showed that galaxies in their cosmological simulations exhibit a strong correlation between the stellar mass () and the average metallicity () of stars (described as ). Guided by these studies, we assume the following relation between GN metallicities (log ) and luminosities of their hosts () :
| (6) |
where and are set to be the same as those adopted for MPCs denoted as and (i.e., 0.5 and -6.0, respectively) in the present study for consistency. We discuss whether the adopted models can provide a physical explanations for the origin of mass-metallicity relation of luminous GCs around massive galaxies in §4.2.
2.4 Truncation of MPC formation
Semi-analytic galaxy formation models based on a hierarchical clustering scenario have shown that models with a truncation of GC formation at can better reproduce the observed color bimodality of GCs in early-type galaxies (Beasley et al. 2002). Recent cosmological simulations have demonstrated that truncation of GC formation by some physical mechanism (e.g., reionization) is necessary to explain the very high specific frequency () in cluster ellipticals, structural properties of the Galactic old stars and GCs, and the mass-dependent trend (Santos 2003; Bekki 2005; Bekki & Chiba 2005; Rhode et al. 2005; Moore et al. 2006; Bekki et al. 2006). Observational studies however have not yet found any strong evidence for the truncation of GC formation in GCSs of nearby galaxies.
If is closely associated with the completion of cosmic reionization, then may well range from 6 (Fan et al. 2003) to 20 (Kogut et al. 2003). Although we investigate models with different ( i.e. 6, 10, and 15), here we present the results of the model with . This is because the latest observations by Microwave Anisotropy Probe (WMAP) suggested that the epoch of reionization is (Page et al. 2006), and because numerical simulations suggest that models with higher () are more consistent with observations of MPCs (e.g., Bekki 2005; Moore et al. 2006).
2.5 Galaxy-scale halos
We simulate the structural, kinematical, and chemical properties of 114596 GCs formed in 25096 low-mass halos before = 10. The physical properties of GCSs in 2830 halos with masses at are analyzed and their correlations with host properties are investigated. Since we are interested in the GCS properties in galaxy-scale halos we only show the results for GCSs in halos with masses (and with ).
We investigate the relations between three properties of GCSs with , i.e. the half-number radii of projected GC distribution (), the surface number densities at (), and the line-of-sight velocity dispersion for all MPCs in each halo (). We derive these three properties, because they are observationally feasible to measure. Since is fixed at a constant value of 1 in the present study, the simulated relation is virtually the same as the relation that is often discussed. The dependences of the present results on is important, we show them in Appendices B and C.


3 Result
3.1 The relation
Fig. 1 shows the large-scale ( Mpc) distribution of MPCs at and MPCs within galaxy-scale halos with similar halo masses () in the model with . It it clear from Fig. 1 that the spatial distribution of MPCs in galaxy-scale halos are quite diverse. For example, the GCS distribution in the halo with appears to be more flattened than that in the halo with . The mean spatial density of MPCs within the central 50 kpc of the halo with is a factor of higher than that of the halo with . These diverse GCS structures are due to the differences of merging histories of halos (e.g., the number of low-mass subhalos that were virialized before which merged to formed a halo). The mean metallicities and metallicity distribution functions of GCSs in galaxies are also diverse depending on their merging histories.
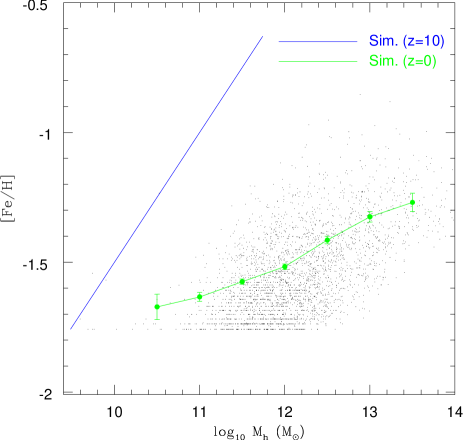
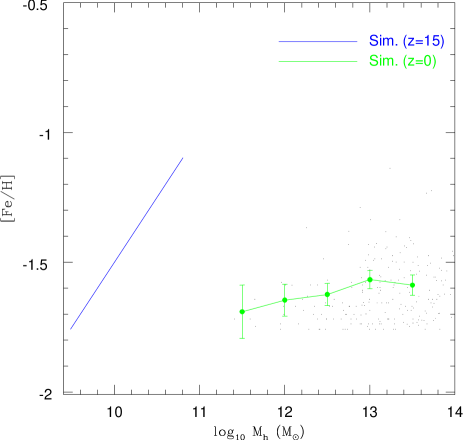
Fig. 2 shows how the initial relation evolves between and for the model with . Although the dispersion in [Fe/H] at is significantly large for a given metallicity bin, the relation at becomes flatter at . This result clearly indicates that the mean metallicities of MPCs in galaxies correlate with the total masses of their host galaxies and thus with those of dark matter halos. This also demonstrates that the simulated (discussed later) results from the relation rather than the adopted assumptions on . The dependences of this correlation on are given in Appendix A.
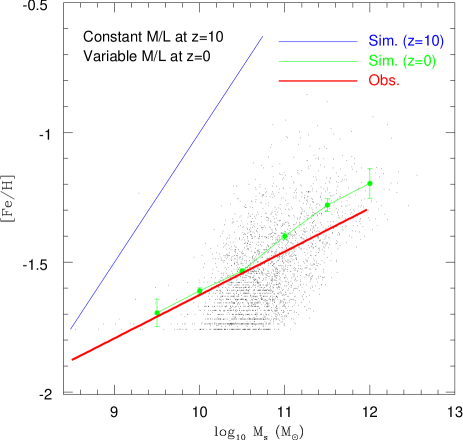
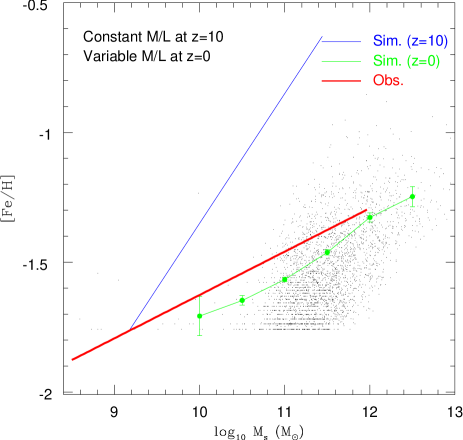
Fig. 3 shows that the initially steep relation at becomes significantly flatter at due to hierarchical merging of low-mass galaxies formed at high . Fig. 3 also shows that the dispersion in [Fe/H] for a given mass range of is quite large. Fig. 3 demonstrates that the observed relation (i.e., ) at can be reasonably well reproduced by the model with an initial relation of at . We find that such a steep initial relation at is indispensable for reproducing the very flat yet significant correlation between and at . The flattening of the initial relation can be seen also in models with different (see Appendix C)
Figs. 4 and 5 show why the initial steep relation becomes flatter during the hierarchical growth of galaxies. Fig. 4 shows that the final () mean metallicity of the MPCs in a galaxy with is lower () than the initial mean metallicity () of its progenitor low-mass halo with , which is the most massive halo among those forming this galaxy at . This galaxy grows via merging and accretion of 74 low-mass halos, all with GCSs of different metallicities between and . Since the MPCs in the accreted “building blocks” are metal-poor, the metallicity of the GCS in the final galaxy is lower than that of the GCS of its progenitor halo. There is thus a decrease in the mean metallicities of GCSs during galaxy evolution between and which is driven by merging and accretion of low-mass halos and their lower metallicity GCSs.
Fig. 5 shows the differences in mean metallicities () between GCSs in galaxies at and those in their progenitor low-mass halos at (i.e. ). Although the dispersion in is quite large in more massive galaxies, the absolute values of are significantly larger in more massive galaxies. This means that more massive galaxies at have experienced a larger number of merging and accretion events of lower-mass halos with lower , so that the final at is lower. Low-mass galaxies at , on the other hand, have not experienced so many mergers and accretion events that act to increase their masses and decrease their . Such galaxies are of low-mass because they have only grown slightly through merging/accretion since their virialization at . As a result of this and forming relatively many GCs in the progenitor halo, their does not change so much from their original values at . Thus the mass-dependence of is the main reason for the flattening of the relation between and .
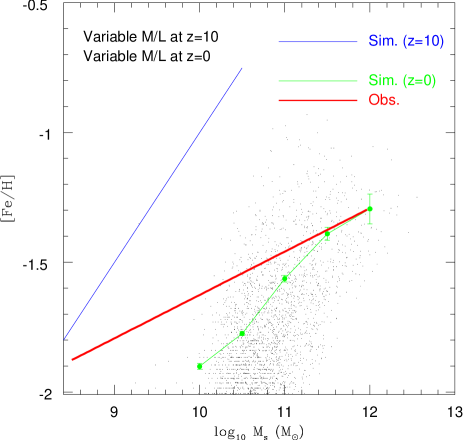
Fig. 6 shows that if the ratios in galaxies are variable at and , then the simulated relation is not a good fit to the observed one. These results, combined with those in Fig. 3, demonstrate that the model with a constant at can better reproduce the observed flat relation for a given initial relation. Given the fact that both the -dependence of and relation at are observationally unclear, there are two possible interpretations for the derived steeper relation at in the variable models. One possibility is that the variable is more reasonable, and thus the initial relation at should be much flatter than the adopted one of . The other possibility is that a constant is more reasonable and the observed -dependence of at is achieved during galaxy evolution between and .
An initial relation at is required to have to explain the observed relation in a variable model, because merging flattens the slope by a factor of 1.7 in this model. This relation at is flatter than the luminosity-metallicity relation of low-mass galaxies () predicted by Dekel & Silk (1980). Given the fact that there are no observational constraints on an initial relation at , we can not conclude whether constant models with initially steep relations are better than variable models with less steep relations at this stage.
The present simulations thus show two extreme cases of evolution depending on the assumed at . The present simulations however confirm that the initial relation of GCSs at becomes significantly flatter by , irrespective of different (yet reasonable) initial -dependences of and different . These results thus imply that the relation evolves with in such a way that the relation becomes flatter at lower .


3.2 Scaling relations
Fig. 7 shows the scaling relations between three projected properties of GCSs, (half-number radii), (surface number densities at ), and (line-of-sight velocity dispersion). Fig. 7 demonstrates that and strongly correlate with in such a way that and are both larger for larger . however correlates weakly with such that is smaller for larger . The least square fits to the simulation data show that , , and . These scaling relations appear to be different from those derived for dark matter halos (Kormendy & Freeman 2004), which suggests that GCSs in our models do not simply trace the distributions of dark matter halos. These scaling relations reflect the fact that MPCs in galaxy-scale halos at originate from the central regions of low-mass halos at and thus have different structures from those of dark matter halos at .
Fig. 8 shows how the properties of GCSs (, ) correlate with total stellar masses () in halos and confirm that these correlations are similar to those derived in Fig. 7. The least square fits to the simulation data show that , , and . The derived -dependences are steeper than the -dependences due to the adopted variation with in galaxies at . These results suggest that future observational studies of GCSs for a statistically significant number of GCSs can assess the validity of the present MPC formation model. The dependency of the GCS scaling relations on are given and their physical meaning discussed in Appendix D.
Fig. 9 shows that the properties of GCSs (i.e., , , and ) in our models do not follow a relation for dynamical systems in virial equilibrium (i.e., ). Given the fact that the simulated GCSs at are in dynamically equilibrium, this apparent deviation from the virial relation suggests structural and kinematical non-homology in GCSs, as observationally and theoretically suggested for elliptical galaxies (e.g., Djorgovski & Davis 1987; Capelato et al. 1995). and of GCSs are significantly different from the half-mass radii and central velocity dispersions of dark matter halos that host the GCSs. In the present simulations, MPCs within galaxy-scale halos at trace the particles initially within the central region of subhalos virialized before . On the other hand, dark matter halo particles at trace all the particle from subhalos virialized at every . Therefore, and of GCSs are quite different from the half-mass radii and central dispersions of dark matter halos that follow the virial relation.
Fig. 10 shows the best fit to the three properties of , , and for GCSs (i.e., ). By assuming that , the best values of and are chosen such that the dispersion along the assumed line (or plane) with and become the smallest. The derived relation of is quite different from the virial relation of , which suggests structural and kinematical non-homology in the simulated GCSs. The more significant deviation of from the virial relation suggests that the estimated line-of-sight velocity dispersions of GCSs can be quite different from (or significant smaller than) the central velocity dispersions of dark matter halos required for virial equilibrium. Since these three properties of GCSs are feasible to derive observationally, it is an interesting future study to compare these simulated scaling relations with the corresponding observational ones.


3.3 Blue Tilts
Next we describe the addition of accreted stellar galactic nuclei (GN) to our simulated GCSs. Fig. 11 shows that the GCS in a massive halo of for the model in which the fraction of the stellar galaxy mass in nuclei is . The figure shows a clear [Fe/H]- relation in the more luminous MPCs ( mag). The essential reason for the simulated blue tilt is that this halo was formed from a large number of subhalos () that were virialized before and thus had GN that followed a mass-metallicity relation. Whether or not the blue tilt in a halo at can be clearly seen is determined by how many subhalos with GN particles merged to form the halo in the present simulations. A least square fits to the simulation data show that (i.e., ), which means that the simulated blue tilt is significantly steeper than the observed one (e.g., ; Harris et al. 2006).
Fig. 12 shows that if , which is an order of magnitude smaller than the model in Fig. 11, the blue tilt is much less clearly seen, because low-luminosity GN particles can not be distinguished from GC particles in the GCS. The results in Figs. 11 and 12 imply that for a blue tilt to be clearly seen at , GN at should be as massive as % of their stellar components in their low-mass hosts. We confirm that if , a blue tilt can be clearly seen but there are too many very luminous ( mag) MPCs in galaxy-scale halos. The least square fits to the simulation data show that (i.e., ), which is steeper than the blue tilt in the model with (and thus less consistent with observations). These results suggest that the presence of blue tilts gives some constraints on the destruction of low-mass nucleated galaxies around galaxies between and . The dependences of the slopes of the simulated blue tilts on the initial GC luminosity function are given in Appendix E.
Fig. 13 shows that more massive halos will have a larger number of GN particles within their GCSs and thus massive galaxies at are more likely to have a contribution from disrupted nuclei to their observed blue tilts. The significantly smaller dispersion in for more massive halos with in Fig. 13 suggests that this effect is most pronounced for GCSs in the most luminous galaxies, i.e. those at the centers of groups and clusters.
The overall distribution of MPCs in the -[Fe/H] plane does not reproduce well the observations for GCSs with blue tilts (Harris et al. 2006; Strader et al. 2006; Spitler et al. 2006). The stripped nuclei, in this prescription, are therefore unlikely to be the sole origin of the observed blue tilts (although they may still make a small contribution).
4 Discussion
4.1 The origin of the relation
The present numerical simulations are the first to demonstrate that an initial steep relation at high can become significantly flatter due to hierarchical merging of galaxies with GCSs. The slope of the final relation GCSs at is similar to the observed one (Strader et al. 2004; P06) in models with and constant at . Côte et al. (1998) investigated correlations between metal-poor GCSs and their host galaxy luminosities () in their models of GCS formation via merging/accretion of MPCs from dwarfs with a power-law galaxy luminosity function (LF) of slope . They showed that there is a weaker correlation between the MPCs and in the models with a steep LF ( in their Figure 7). Recent high-resolution cosmological simulations on the mass function of low-mass halos have demonstrated that the slope of the mass function is significantly steeper at higher redshifts (e.g., Yahagi et al. 2004). We suggest that the steeper mass function of halos at high redshifts can also be an important factor for the origin of the observed slope of the relation.
The present study assumed that the initial relation at is similar to the relation observed in Local Group dSphs today (e.g., Dekel & Silk 1984; Lotz et al. 2004). Such a steep relation at is important for the present model, because the initial relation becomes significantly flatter between and . It is, however, observationally and theoretically unclear how low-mass galaxies at high achieve such a steep relation and what physical mechanisms are responsible. Kravtsov & Gnedin (2005) found that galaxies in their cosmological simulations exhibit a strong correlation between the stellar mass () and the average metallicity () of stars (described as ) similar to the observed one in dwarf galaxies (Dekel & Woo 2003). Their results imply that GCSs in low-mass galaxies at high could also have a steep relation similar to that of the field stars.
It should be stressed here that the models with an initially steep relation at better reproduce observations only for constant at : models with an initially flatter relation can also better explain observations for variable at , though the required relation was not predicted by previous theoretical studies. Owing to lack of observational data sets for the relation at , it is currently difficult to make a robust conclusion as to whether the constant models with a steep relation are better.
4.2 The origin of the blue tilt
Using the ACS on-board HST, Strader et al. (2006) and Harris et al. (2006) found that luminous blue GCs (i.e. MPCs) reveal a trend of having redder colors in giant ellipticals. This “blue tilt” was interpreted as MPCs having a metallicity-luminosity relation of . A possible exception was NGC 4472. Spitler et al. (2006) subsequently showed that this trend is also true in the Sombrero spiral galaxy and may extend to lower GC luminosities with a somewhat shallower slope than derived by Harris et al. (2006) and Strader et al. (2006). In each of these ACS studies the MRCs showed no corresponding trend. These observations require that any theoretical models of GC formation should explain the origin of the metallicity-luminosity relation for individual GCs, and also the apparent absence of a similar relation for MRCs (e.g., Mieske et al. 2006).
Here we have demonstrated that luminous MPCs in more massive galaxies show metallicity-luminosity relations in that brighter GCs have redder colors a trend qualitatively similar to the observed blue tilts. In our simulations the reason for the “simulated blue tilts” is that luminous MPCs originate from stellar galactic nuclei (GN) of the more massive nucleated galaxies with a luminosity-metallicity relation. The present study thus suggests that galaxies which experienced a larger number of accretion/merging events of nucleated low-mass galaxies are more likely to show a blue tilt. Since the frequency of accretion/merging events is generally higher in more massive galaxies, the blue tilts are more likely to be present in high luminosity than low luminosity galaxies. Thus not all galaxies are expected to have blue tilts. Since these simulated GCSs are composed both of stripped normal GCs (with no initial mass-metallicity relation) and of stripped GN with a mass-metallicity relation, their detection in observational data may depend on their relative numbers.
Although we find clear blue tilts in our simulations, it is not clear what role stripped galactic nuclei play in the observed blue tilts to date. For example, Spitler et al. (2006) find the blue tilt is not simply a feature of luminous MPCs but seems to extend down to luminosity function as far as is measurable. Furthermore the MPC luminosity function is well fit by a standard Gaussian, or t5 function, even at the luminous end. Thus the tilt does not appear to be due to an additional population but rather a ‘tilting’ of the existing MPC system. More deep data on a variety of systems are required to confirm these trends. A direct comparison between simulations and observational data needs to account for many factors, such as the number of GN vs bona fide GCs, contamination rates, the presence of dust and measurement errors (which tend to cause spreads in both magnitude and colour).
The observed colors and metallicities of GN in dwarfs (Lotz et al. 2004; Mieske et al 2006) appear to suggest most GN can not be metal-rich clusters as they have lower metallicities. The apparent absence of a MRC color-magnitude relation may therefore reflect the fact that most MRCs do not originate from GN. Our simulated blue tilt, due to the stripped nuclei of (defunct) low-mass galaxies, is one of many possible scenarios for the origin of the blue tilt. We plan to discuss the origin of the blue tilt in a wider context of galaxy and GC formation in a future paper.
4.3 The Fundamental Plane of metal-poor GCSs
The scaling relations between properties of elliptical galaxies, such as “the Fundamental Plane” (FP), have long been suggested provide valuable information on formation and evolution histories of elliptical galaxies (e.g., Djorgovski & Davis 1987). Theoretical studies based mostly on numerical simulations suggested that structural and kinematic non-homology inferred from the FP are closely associated with dynamics of galaxy merging, star formation histories dependent on galaxy masses, and collapse dynamics in elliptical galaxy formation (Capelato et al. 1995; Bekki 1998; Dantas et al. 2003). The present study has shown that the scaling relation () between (projected half-number radii), (surface number density at ), and (velocity dispersion) of MPCs in our models is significantly different from that expected from the virial theorem (). Although this is due partly to the way we estimate for a GCS in our models, the significant difference between the exponents of the terms between the virial and the simulated relations strongly suggests that the deviation has a physical meaning.
MPCs are assumed to form in the central regions of low-mass halos that are virialized before . The formation of MPCs is biased toward high density peaks of the primordial matter distribution in the adopted CDM model. As a natural result of this, MPCs in galaxies at show structural and kinematical properties different from those of the background dark matter halos, the scaling relation of which should be similar to the virial relation. Recent numerical simulations with truncation of GC formation have also demonstrated that the dynamical properties of MPCs can be significantly different from those of dark matter halos (Santos 2003; Bekki 2005; Moore et al. 2006). Although physical explanations for the origin of the slope of the FP in MPCs are yet to be provided, we suggest that the presence of the FP for MPCs can be one characteristic of biased formation of MPCs at high .
A growing number of spectroscopic observations have revealed kinematic properties of GCSs, such as radial profiles of velocity dispersions and rotational velocities, maximum , and kinematical differences between MPCs and MRCs, in early-type galaxies (e.g., Kissler-Patig & Gebhardt 1998; Cohen 2000; Zepf et al. 2001; Côte et al. 2001, 2003; Beasley et al. 2004; Peng et al. 2004; Richtler et al. 2004; Pierce et al. 2006; Romanowsky 2006). Recent photometric studies of GCSs by the HST and ground-based telescopes have also revealed structural properties of GCSs in galaxies with different Hubble types (e.g., Rhode & Zepf 2004; P06; Spitler et al. 2006). Accordingly it is worthwhile for future observational studies to investigate the FP of MPC systems. It is also an interesting observational study to investigate correlations between (or ) of MPCs and the total luminosity of their host galaxy, because such correlations are more feasible to derive observationally and thus can be compared more readily with the predicted ones.
5 Conclusions
We have investigated the physical properties of metal-poor GCSs in galaxies using high-resolution cosmological simulations based on a CDM model. We particularly investigated the relation, the relation, and MPC scaling relations in galaxies with different masses. We assumed that (i) MPC formation is truncated at , (ii) galaxies at contain MPCs and galactic nuclei (GN) with masses proportional to their host galaxies, (iii) galaxies initially have a steep relation at , (iv) galaxies have a certain at , and (v) MPCs have a luminosity function the same as that observed today. We also assumed that both MPCs and GNs can be identified as MPCs in galaxies at , if they are within virial radii of the dark matter halos. We summarize our principle results of the models as follows.
(1) The original at becomes significantly flatter by due to hierarchical merging of lower-mass galaxies. The original at in the model with a constant at becomes at , which is consistent with the latest observational results. The origin of the flattening of the relation reflects the fact that of GCSs in more massive galaxies at is lower than the progenitor halos at due to a large number of mergers and accretion of low-mass halos of GCSs with lower . A flatter relation at () is required to explain the observed relation at in the models with a variable .
(2) The final relation at depends on such that it is steeper for lower . Models with constant ratios (i.e., ) at can better explain the observed relation at for a given and the adopted initial relation of at , though most models show a flattening of the original relation. The essential reason for the positive correlation between and at is that the more massive galaxies at are formed from hierarchical merging of a larger number of more massive building blocks containing GCs with higher metallicities. Thus merging does not completely erase the original relation.
(3) MPC systems in these models clearly show scaling relations between galaxy mass (or halo mass ), , , and . We find , , in the models with . Thus we find a “Fundamental Plane” for MPCs, which can be described as in the models with . We note that such scalings are not consistent with the virial relation of . The relation depends on , which suggests that the scaling relation can give some constraints on . We also find that and .
(4) Luminous MPCs show a correlation between and [Fe/H] if these MPCs originate from nuclei of low-mass galaxies at high . The correlation, which is referred to as a “blue tilt”, can be more clearly seen in more massive galaxies with . This is mainly because more massive galaxies are formed from a larger number of nucleated galaxies virialized by . Observations of blue tilts only loosely resemble our simulated ones suggesting stripped nuclei make a small contribution at most.
Acknowledgments
We are grateful to the anonymous referee for valuable comments, which contribute to improve the present paper. We thank J. Strader and L. Spitler for useful discussions. K.B. and D.A.F. acknowledge the financial support of the Australian Research Council throughout the course of this work. H.Y. acknowledges the support of the research fellowships of the Japan Society for the Promotion of Science for Young Scientists (17-10511). The numerical simulations reported here were carried out on Fujitsu-made vector parallel processors VPP5000 kindly made available by the Astronomical Data Analysis Center (ADAC) at National Astronomical Observatory of Japan (NAOJ) for our research project why36b.
References
- [] Ashman, K. M., Zepf, S. E., 1992, ApJ, 384, 50
- [] Ashman, K. M., Zepf, S. E., 1998, in Globular cluster systems, Cambridge, U. K. ; New York : Cambridge University Press,
- [] Bassino, L. P., Muzzio, J. C., & Rabolli, M. 1994, ApJ, 431, 634
- [] Baumgardt, H. 1988, A&A, 330, 480
- [] Beasley, M. A., Baugh, C. M., Forbes, D. A., Sharples, R. M., Frenk, C. S. 2002, MNRAS, 333, 383
- [] Beasley, M. A., Forbes, D. A., Brodie, J. P., Kissler-Patig, M., 2004, MNRAS, 347, 1150
- [] Bekki, K., 1998, ApJ, 496, 713
- [] Bekki, K.; Freeman, K. C., 2003, MNRAS, 346L, 11
- [] Bekki, K., Chiba, M., 2004, A&A, 417, 437
- [] Bekki, K. 2005, ApJ, 626, L93
- [] Bekki, K., & Chiba, M. 2005, ApJ, 625, L107
- [] Bekki, K., Beasley, M. A., Brodie, J. P., & Forbes, D. A. 2005, MNRAS, 363, 1211
- [] Bekki, K., Forbes, D. A., 2006, A&A, 445, 485
- [] Bekki, K., Yahagi, H., Forbes, D. A., 2006, ApJL, 645, 29
- [] Bekki, K., & Yahagi, H. 2006, accepted in MNRAS
- [] Bertschinger, E. 1995, astro-ph/9506070
- [] Bertschinger, E. 2001, ApJS, 137, 1
- [] Binney, J., Tremaine, S., 1987 in Galactic Dynamics.
- [] Brodie, J. P., Strader, J., 2006, ARA&A in press (astro-ph/0602601)
- [] Bromm, V., Clarke, C. J., 2002, ApJL, 566, 1
- [] Capelato, H. V., de Carvalho, R. R., Carlberg, R. G., 1995, ApJ, 451, 525
- [] Capuzzo-Dolcetta, R., 2006, in the Globular Clusters to Guides to Galaxies (astro-ph/0605162)
- [] Cohen, J. G., 2000, AJ, 119, 162
- [] Cole, S., Lacey, C., Baugh, C., Frenk, C., 2000, MNRAS, 319, 168
- [] Côte, P., Marzke, R. O., West, M. J. 1998, ApJ, 501, 554
- [] Côte, P. et al. 2001, ApJ, 559, 828
- [] Côte, P. et al., 2006, accepted in ApJS (astro-ph/0603252)
- [] Côte, P. McLaughlin, D. E., Cohen, J. G., Blakeslee, J. P., 2002, ApJ, 591, 850
- [] Dantas, C. C., Capelato, H. V., Ribeiro, A. L. B., de Carvalho, R. R. 2003, MNRAS, 340, 398
- [] Davis, M., Efstathiou, G., Frenk, C. S., & White, S. D. M. 1985, ApJ, 292, 371
- [] Dekel, A., Silk, J., 1986, ApJ, 303, 39
- [] Dekel, A., Woo, J., 2003, MNRAS, 344, 1131
- [] Djorgovski, S., Davis, M. 1987, ApJ, 313, 59
- [] Fan, X. et al. 2003, AJ, 125, 1649
- [] Forbes, D. A., Forte, J. C., 2001, MNRAS, 322, 257
- [] Forbes, D. A., 2005, ApJL, 635, 137
- [] Freeman, K. C. 1993, in The globular clusters-galaxy connection, edited by Graeme H. Smith, and Jean P. Brodie, ASP conf. ser. 48, p608
- [] Gieles, M., Larsen, S. S., Bastian, N., Stein, I. T., 2006, A&A, 450, 129
- [] Harris, W. E., 1991, ARA&A, 29, 543
- [] Harris, W. E., Whitmore, B. C., Karakla, D., Okoń, W., Baum, W. A., Hanes, D. A., Kavelaars, J. J., 2006, ApJ, 636, 90
- [] Kissler-Patig, M., Gebhardt, K., 1998, AJ, 116, 2237
- [] Kogut, A. et al. 2003, ApJs, 148, 161
- [] Kormendy, J., Freeman, K. C., 2004, IAU Symposium no. 220, Edited by S. D. Ryder, D. J. Pisano, M. A. Walker, and K. C. Freeman. San Francisco: Astronomical Society of the Pacific., p.377
- [] Kravtsov, A. V., Gnedin, O. Y., 2005, ApJ, 623, 650
- [] Larsen, S. S., Richtler, T., 2001, A&A. 354, 836
- [] Larsen, S. S., Brodie, J. P., Huchra, J. P., Forbes, D. A., Grillmair, C. J., 2001, AJ, 121, 2974
- [] Lotz, J. M., Miller, B. W., Ferguson, H. C., 2004, ApJ, 613, 262
- [] Marinoni, C., Hudson, M. J., 2002, ApJ, 569, 101
- [] Mashchenko, S., Sills, A., 2005, 619, 258
- [] Mieske, S., Hilker, M., Infante, L., Jordán, A., 2006, AJ, 131, 2442
- [] Mieske, S., et al. 2006, accepted by ApJ (astro-ph/0609079)
- [] Minniti, D., Meylan, G., Kissler-Patig, M., 1996, A&A, 312, 49
- [] Moore, B., et al. 2006, astro-ph/0510370
- [] Navarro, J. F., Frenk, C. S., & White, S. D. M. 1996, ApJ, 462, 563 (NFW)
- [] Page, L. et al., 2006, submitted to ApJ (astro-ph/0603450)
- [] Peng, E. W., Ford, H. C., Freeman, K. C., 2004, ApJ, 602, 705
- [] Peng, E., et al. 2006, ApJ, 639, 95
- [] Pierce, M. et al, 2006, MNRAS, 366, 1253
- [] Rhode, K. L., Zepf, S. E., & Santos, M. R. 2005, ApJL, 630, 21
- [] Rhode, K. L., Zepf, S. E., 2004, AJ, 127, 302
- [] Richtler, T., 2003, Stellar Candles for the Extragalactic Distance Scale, Edited by D. Alloin and W. Gieren, vol. 635, p.281
- [] Richtler, T. et al. 2004, AJ, 127, 2094
- [] Romanowsky, A. J., 2006, in the Globular Clusters to Guides to Galaxies.
- [] Santos, M. R. 2003, in Extragalactic Globular Cluster Systems, Proceedings of the ESO Workshop, p. 348
- [] Spitler, L. R., Larsen, S. S., Strader, J., Brodie, J. P., Forbes, D. A., Beasley, M. A., 2006, accepted in AJ (astro-ph/0606337)
- [] Strader, J., Brodie, J. P., Forbes, D. A., 2004, AJ, 127, 3431
- [] Strader, J., Brodie, J. P., Spitler, L., Beasley, M. A., 2006, submitted to AJ (astro-ph/0508001).
- [] Susa, H., Umemura, M. 2004, ApJ, 600, 1
- [] van den Bergh, S. 1986, AJ, 91, 271
- [] van den Bergh, S. 2000, The Galaxies of the Local Group, Cambridge: Cambridge Univ. Press.
- [] Vazdekis, A., Casuso, E., Peletier, R. F., Beckman, J. E., 1996, ApJS, 106, 307
- [] van de Ven, G., van Dokkum, P. G., Franx, M., 2003, MNRAS, 344, 924
- [] Walcher, J. et al., 2006, submitted to ApJ (astro-ph/0604140)
- [] West, M. J., Côte, P., Marzke, R. O., Jordán, A., 2004, Nat, 427, 31
- [] Yahagi, H. 2005, PASJ, 57, 779
- [] Yahagi, H., & Yoshii, Y. 2001, ApJ, 558, 463
- [] Yahagi, H., Nagashima, M., & Yoshii, Y., 2004, ApJ, 605, 709
- [] Yahagi, H., Bekki, K., 2005, MNRAS, 364L, 86
- [] Zaritsky, D., Gonzalez, A., Zabludoff, A., 2006, ApJ, 642, 37
- [] Vesperini, E., Zepf, S. E., Kundu, A., Ashman, K. M., 2003, ApJ, 593, 760
- [] Zepf, S. E., Beasley, M. A., Bridges, T. J., Hanes, D. A., Sharples, R. M., Ashman, K. M., Geisler, D., 2000, AJ, 120, 2928
- [] Zinnecker, H., Keable, C. J., Dunlop, J. S., Cannon, R. D., Griffiths, W. K., 1988, in Grindlay, J. E., Davis Philip A. G., eds, Globular cluster systems in Galaxies, Dordrecht, Kluwer, p603
Appendix A Dependences of relations on .
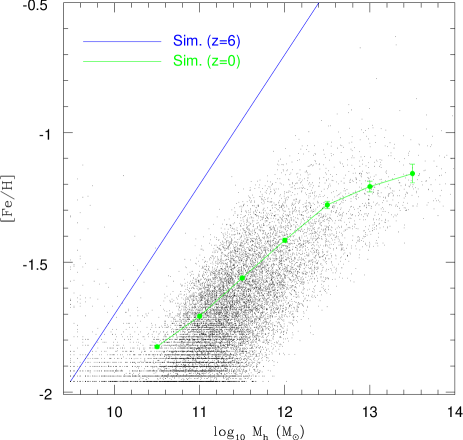
Fig. A1 shows that the initially steep relation at becomes flatter in the model with , though the degree of the flattening is less significant in this model than in the model with . This reflects the fact that galaxies experienced a smaller number of galaxy merging (which can flatten the relation) between and in this model. Fig. A2 shows that the relation is almost flat in the model with , which means that hierarchical merging of low-mass galaxies between and almost completely erases out the original steep relation: this simulated at is inconsistent with the observed one. These results shown in Figs. A1 and A2 thus suggest that the degree of the flattening in the relation depends on in the sense that models with earlier truncation of GC formation show the larger degree of the flattening. The absence of low-mass galaxies with GCs for () in the model with is inconsistent with observations.
Appendix B Dependences of relations on .
Fig. B1 shows that the original relation becomes significantly flatter between and in the model with . The locations of galaxies on the - plane are shifted to the righter directions owing to the larger stellar masses of galaxies in this model with higher . As a result of this, the simulated for a given is slightly smaller than the observed one. The change in however does not change the final slope in the relation in comparison with the model with . The flattening of the relation between and does not depend on , as long as we adopt assumptions of (i) a constant at and (ii) an initial relation of . This means that if we adopt a slightly higher value of for the higher model, the observed relation can be better reproduced under the above assumptions. Thus high values of are required in the models with higher and with the above assumptions for the observation to be well reproduced.
Appendix C Dependences of relations on .
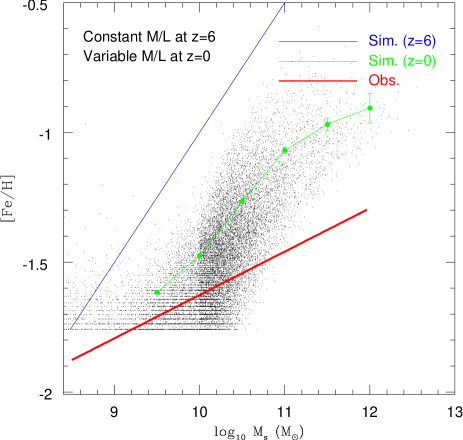
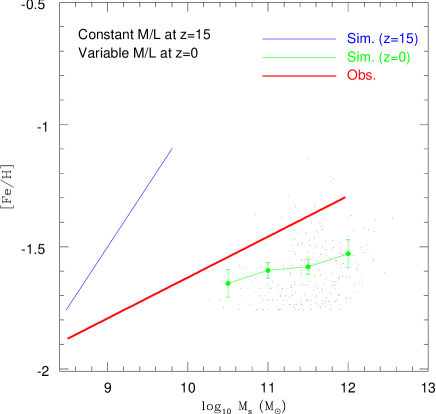
Figs. C1 and C2 show the simulated relations (thus relations for the fixed ratios) for the models with = 6 and 15, respectively. It is clear from these figures and Fig. 5 that the model with can better reproduce the observed flat relation (or one). The model with shows the relation flatter than the observed one whereas the model with shows the steeper one. In the model with (), a larger (smaller) number of merger events for a longer (shorter) time scale between and can flatten the original relation at to a larger (smaller) extent. This is the essential reason why the simulated relation depends on .
Thus the growth of galaxies via hierarchical merging/accretion of low-mass halos with and without MPCs between and can flatten the original at owing to merging/accretion of MPCs with different metallicities. If corresponds to the epoch of reionization () and it is determined from future observations, then the results of numerical simulations shown in Figs. 6, C1, and C2 imply that we can infer the original at by comparing the simulations with the observed at .
Appendix D Dependences of scaling relations on .
Fig. D1 shows that the dynamical correlations are different between different , in particular, for -dependences of . the -dependence of is steeper for higher whereas the -dependence of is not so different between different . The slope in the -dependence of is negative for and 15 and positive for . The derived differences in the -dependences of dynamical properties of GCSs between different suggest that future observational studies on the -dependences can provide some constraints on .
Structural properties of GCSs have been suggested to provide constraints on (Santos 2003; Bekki 2005; Moore et al. 2006). The present study suggested that if (i) the adopted relation at () is reasonable and realistic and (ii) does not depend on galaxy masses at , the observed relation at could also provide constraints on . It is therefore an important observational test whether derived from the observed -dependences is consistent with derived from the structural and chemical properties of GCSs.

Appendix E The influences of maximum GC masses on the blue tilt
We adopted an assumption of a universal GC mass (luminosity) function with the same lower () and upper (or luminosity) mass cut off () for all halos in the present study. Since recent observations have suggested a possible maximum mass of star clusters in galaxies (e.g., Gieles et al. 2006) and correlations between and physical properties of their host galaxies, such as star formation rates (e.g., Larsen & Richtler 2000), the above assumption on the fixed could be less realistic. We thus investigated the models with relations (i.e., ) suggested by numerical simulations of Kravtsov & Gnedin 2005.
Fig. E1 shows the result of the model with and for . Owing to the introduction of the relation, the overall distribution of MPCs on the -[Fe/H] in this model appears to be only slightly more similar to the observed blue tilt than the model shown in Fig. 11. The least square fits to the simulation data show that (i.e., ). This relation is however still significantly steeper than the observed one of (Harris et al. 2006). Although the models with steeper relations can show flatter relations, the simulated dispersions in for given metallicity bins (in particular, for [Fe/H] ) are too large to be consistent with observations. These suggest that the models with relations still miss some important ingredients of GC formation. We discuss these problems in our forthcoming papers (Bekki et al. 2007, in preparation).
