Testing grain-surface chemistry in massive hot-core regions
Abstract
Aims. To establish the chemical origin of a set of complex organic molecules thought to be produced by grain surface chemistry in high mass young stellar objects (YSOs).
Methods. A partial submillimeter line-survey was performed toward 7 high-mass YSOs aimed at detecting H2CO, CH3OH, CH2CO, CH3CHO, C2H5OH, HCOOH, HNCO and NH2CHO. In addition, lines of CH3CN, C2H5CN, CH3CCH, HCOOCH3, and CH3OCH3 were observed. Rotation temperatures and beam-averaged column densities are determined. To correct for beam dilution and determine abundances for hot gas, the radius and H2 column densities of gas at temperatures 100 K are computed using 850 m dust continuum data and source luminosity.
Results. Based on their rotation diagrams, molecules can be classified as either cold (100 K) or hot (100 K). This implies that complex organics are present in at least two distinct regions. Furthermore, the abundances of the hot oxygen-bearing species are correlated, as are those of HNCO and NH2CHO. This is suggestive of chemical relationships within, but not between, those two groups of molecules.
Conclusions. The most likely explanation for the observed correlations of the various hot molecules is that they are “first generation” species that originate from solid-state chemistry. This includes H2CO, CH3OH, C2H5OH, HCOOCH3, CH3OCH3, HNCO, NH2CHO, and possibly CH3CN, and C2H5CN. The correlations between sources implies very similar conditions during their formation or very similar doses of energetic processing. Cold species such as CH2CO, CH3CHO, and HCOOH, some of which are seen as ices along the same lines of sight, are probably formed in the solid state as well, but appear to be destroyed at higher temperatures. A low level of non-thermal desorption by cosmic rays can explain their low rotation temperatures and relatively low abundances in the gas phase compared to the solid state. The CH3CCH abundances can be fully explained by low temperature gas phase chemistry. No cold N-containing molecules are found.
Key Words.:
Astrochemistry – Line: identification – Methods: observational – Stars: formation – ISM: abundances – ISM: molecules1 Introduction
A characteristic stage of high-mass star formation is the hot core phase where high abundances of complex molecules are found in the gas-phase and in the ice mantles around the dust grains in the cold extended envelope (e.g., Millar, 1996; Ikeda et al., 2001; Boogert & Ehrenfreund, 2004). The existence of both ices and gas-phase molecules around the same high-mass protostars suggests that the envelopes have temperatures that range from 200 K in the inner region to as low as 10 K in the cold outer part (e.g., van der Tak et al., 2000; Gibb et al., 2000b; Ikeda et al., 2001). Together the submillimeter and infrared data indicate that there is a rich chemistry which involves interactions between gas and grain-surface species. The precise origin of complex molecules is still heavily debated: are they “first generation” species formed on the grains during the cold collapse phase (e.g., Tielens & Charnley, 1997), or “second generation” species produced by high-temperature gas phase reactions following ice evaporation (e.g., Millar et al., 1991; Charnley et al., 1992; Charnley, 1995)? The aim of this work is to test the formation schemes of key complex organic molecules by presenting submillimeter observations of a sample of high-mass cores using the same instrument and frequency settings.
High column densities of the organic molecules CH3OH, CH4, HCOOH, OCN- and potentially H2CO have been detected in ice mantles in the cold outer envelopes of high-mass young stellar objects (YSOs) (Gibb et al., 2004). Abundances for some ice species such as CH3OH and OCN- are large, up to 30% with respect to H2O ice or 3 with respect to H2 (Brooke et al., 1999; Dartois et al., 1999; Pontoppidan et al., 2003; van Broekhuizen et al., 2005). Information on minor species such as CH4, HCOOH, H2CO and CH3CHO is more limited, but they appear to have constant abundances at the level of a few % with respect to H2O ice (Schutte et al., 1999; Keane et al., 2001; Gibb et al., 2004). More complex species with abundances lower than 0.1% cannot be detected by infrared observations because of their small optical depth. Moreover, features of the same functional groups such as C–H and O–H groups overlap, so that they can only be assigned to a class of molecules rather than to a specific species. Deep submillimeter surveys in the gas phase are more sensitive to detect these minor species.
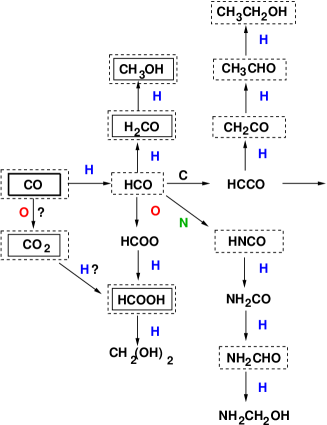
The abundances of the detected ice species are so large that they cannot be produced by pure gas-phase processes but must be formed on the grains. A proposed scheme for the formation of various “first generation” molecules on grains (based on Tielens & Charnley, 1997) is shown in Fig. 1. Through successive addition of H, C, O, and N to CO, many complex organic species are formed. The outcome depends on the relative gas-phase abundances of the atoms, their mobility on the grains, and the CO abundance. If the formation routes depicted in Fig. 1 are indeed valid and proceed under similar initial conditions, this would imply that the molecules in this scheme are related and that they will have correlated abundance ratios upon evaporation. For different initial conditions, the relative abundances will vary from source to source; the H2CO/CH3OH ratio depends for example on ice temperature, and the C2H5OH/CH3OH ratio on the atomic carbon abundance. In contrast, gas phase formation of second generation species is expected to cause time-dependent abundance variations where “first” and “second generation” as well as non-related “first generation” species are uncorrelated. A combination of rotation temperatures and relative abundances between species can determine which species are part of the same chemical group. To test the basic grain surface chemistry scheme, our survey has targeted emission lines of all species depicted in Fig. 1. Only CO2, the unstable species HCOO, HCCO, and NH2CO, as well as CH2(OH)2 and NH2CH2OH for which no laboratory frequencies are available, are lacking.
Many line surveys have been performed to study the molecular composition of high mass star forming regions (e.g., Blake et al., 1987; Sutton et al., 1995; Helmich & van Dishoeck, 1997; Schilke et al., 1997; Nummelin et al., 2000; Gibb et al., 2000a; Schilke et al., 2001). However, they often cover a single atmospheric window, each at a different telescope. These data thus probe a variety of excitation conditions with different beam-sizes, which complicates the comparison of column densities and abundances between different sources. Our observing strategy employs deep, partial line surveys in multiple atmospheric windows rather than complete, unbiased line surveys. Partial line surveys exist, but are usually targeted at a few specific molecules such as CH3OH (van der Tak et al., 2000) and HNCO (Zinchenko et al., 2000). The advantage of our survey is that it efficiently covers lines with a large range of excitation temperatures and that the settings and telescopes are the same for all sources. The lines of the molecules targeted in this work are sufficiently strong so that no complete line survey is needed for their identification. Compared with previous studies such as those by Ikeda et al. (2001) and Zinchenko et al. (2000) our observations cover higher frequencies, which implies smaller beams and, for some species, lines from higher energy levels.
This paper is organized as follows: Sect. 2 presents the selection of sources plus frequencies, and the observational techniques, Sect. 3 presents the data reduction techniques, Sect. 4 the results on the derived rotation temperatures plus column densities and compares those to other high mass YSOs. In Sect. 5 the correlations of the abundances between different molecular species are determined. Sect. 6 discusses the origin of the constant abundance ratios and compares these to astrochemical models, and finally in Sect. 7 the main conclusions are summarized.
2 Observations
2.1 Source sample
| Sources | (2000) | (2000) | a | ||
|---|---|---|---|---|---|
| [105 L⊙] | [kpc] | km s-1 | |||
| AFGL 2591 | 20:29:24.6 | 40:11:19 | 0.2 | 1.0 | 3 |
| G24.78 | 18:36:12.6 | 07:12:11 | 7.9 | 7.7 | 6 |
| G75.78 | 20:21:44.1 | 37:26:40 | 1.9 | 4.1 | 4 |
| NGC 6334 IRS1 | 17:20:53.0 | 35:47:02 | 1.1 | 1.7 | 5 |
| NGC 7538 IRS1 | 23:13:45.4 | 61:28:12 | 1.3 | 2.8 | 4 |
| W 3(H2O) | 02:27:04.6 | 61:52:26 | 0.2 | 2.0 | 6 |
| W 33A | 18:14:38.9 | 17:52:04 | 1.0 | 4.0 | 5 |
The basis for this survey is formed by a sample of 7 high-mass young stellar objects summarized in Table 1. The sources are known to have hot gas in their inner envelope where ices have evaporated and they either show complex organic molecules due to hot core chemistry or are on the verge of reaching that stage (e.g., Boonman et al., 2001). Most of the sources were selected from the sample of high mass YSOs studied in detail by van der Tak et al. (2000) based on the following criteria: (i) narrow line widths (6 km s-1) to minimize line confusion; (ii) detection of CH3OH lines, where the strongest lines in the 7K–6K 338 GHz band should have main-beam temperatures of 1 K; (iii) distances 5 kpc and (iv) visible from the James Clerk Maxwell Telescope (JCMT)111The James Clerk Maxwell Telescope is operated by the Joint Astronomy Centre, on behalf of the Particle Physics and Astronomy Research Council of the United Kingdom, the Netherlands Organization for Scientific Research and the National Research Council of Canada. Project IDs are m04bn12, m05an05, and m05bn11.. Preference was also given to sources for which infrared absorption line data of ices are available. The source list additionally includes G75.78 and G24.78. G75.78 has been previously observed by Hatchell et al. (1998) and obeys all previously mentioned selection criteria. G24.78 has a distance 5 kpc, but was selected based on the large line intensities of CH3CN detected by Beltrán et al. (2005). Trial JCMT observations of the 7K–6K 338 GHz CH3OH band confirmed that the strongest lines are 1 K and G24.78 was therefore added to the sample.
2.2 Observed frequency settings
The observed frequencies are shown in Table 2 and were selected based on whether they contained at least one strong line for a target molecule as well as lines of other interesting species. Strong lines of target molecules were chosen because of their high main-beam temperatures and minimum line confusion in line surveys of Orion A by Sutton et al. (1985) and Orion KL by Schilke et al. (1997) at 230 GHz and 345 GHz respectively. The aim was to cover at least two transitions for each molecule to determine rotation temperatures: one with 100 K, and one with 100 K. Table 2 shows the additional lines present in the rest frequency side band. The molecular species detected in the image band differed, because it varied per source. Finally, for H2CO, CH3OH, and HNCO lines of the isotopic species were observed to determine the optical depth of the main isotopologues.
An additional number of settings have been observed for CH2CO, CH3CHO, and HCOOH with the Institut de Radioastronomie Millimetrique222The IRAM 30 m telescope is operated by the Institut de Radioastronomie Millimétrique on behalf of the Centre National de la Recherche Scientifique of France, the Max Planck Gesellschaft of Germany, and Instituto Geográfico Nacional of Spain. (IRAM) 30 m telescope for AFGL 2591, G75.78, NGC 7538 IRS1, and W 3(H2O). The settings were chosen because of their high line strengths and low excitation temperatures. Combined with the JCMT settings, they allow for the determination of any cold component of these molecules.
| Molecule | Freq. | Transition | Additional molecules | ||
| [GHz] | [K] | [D2] | |||
| JCMT | |||||
| HCO | 346.725 | 41.61 | 7.341 | 40,4,5,4– 30,3,4,3 | C2H5CN/C2H5OH/H2C18O/HCOOCH3 |
| 348.778 | 172.36 | 5.313 | 42,3,4,4– 32,2,3,3 | HCOOCH3/CH313CN/C2H5OH | |
| H2CO | 218.222 | 20.96 | 16.2985 | 30,3– 20,2 | CH3OH/C2H5CN/HCOOCH3 |
| 364.275 | 158.42 | 52.1647 | 53,3– 43,2 | C2H5OH | |
| CH3OH | 338.344 | 5.3431 | 69.36 | 73,4,0– 63,4,0 | HCOOCH3 |
| CH2CO | 240.187 | 88.01 | 71.489 | 121,12– 111,11 | CH3OH/H2C18O/C2H5CN/CH3CN/HCOOCH3 |
| 220.178 | 76.48 | 65.434 | 111,11– 101,10 | CH313CN/13CH3OH/HCOOCH3 | |
| 222.298 | 182.26 | 61.0830 | 113,9– 103,8 | CH3OCH3/CH3CCH/HCOOCH3 | |
| CH3CHO | 226.590 | 71.30 | 77.779 | 120,12– 110,11 | HCOOCH3 |
| C2H5OH | 230.991 | 85.53 | 48.953 | 165,11– 164,12 | CH3OH/C2HCN |
| 347.916 | 250.88 | 66.314 | 204,17,0– 194,16,0 | C2H5CN/HCOOCH3/H2C18O | |
| 339.979 | 57.89 | 17.724 | 94,6– 83,5 | C2H5CN | |
| HNCO | 219.798 | 58.02 | 28.112 | 100,10,11– 90,9,10 | H213CO/C2H5CN |
| 352.898 | 187.25 | 43.387 | 161,15,17– 151,14,16 | C2H5CN/C2H5OH/HCOOCH3 | |
| HN13CO | 240.881 | 112.53 | 30.4313 | 111,11,12– 101,10,11 | CH3OCH3/CH3OH/HNCO |
| NH2CHO | 339.904 | 245.79 | 539.342 | 166,11– 156,10 | same setting as C2H5OH |
| 340.491 | 165.59 | 605.520 | 163,14– 153,13 | same setting as CH2CO | |
| 345.183 | 151.59 | 664.219 | 170,17– 160,16 | HCOOCH3/C2H5OH/13CH3OH | |
| HCOOH | 225.238 | 88.02 | 17.734 | 103,8– 93,7 | H2CO/HCOOCH3/CH3OCH3/13CH3OH |
| 338.144 | 180.53 | 27.1548 | 154,12– 144,11 | CH3OH/C2H5OH | |
| 346.719 | 143.92 | 28.726 | 152,13– 142,12 | same setting as HCO | |
| 356.137 | 158.67 | 30.6650 | 162,15– 152,14 | NH2CHO/HCOOCH3/C2H5CN/H213CO/CH3OH | |
| IRAM | |||||
| CH2CO | 81.586 | 22.86 | 22.4974 | 41,3– 31,2 | |
| 140.127 | 39.97 | 41.1295 | 71,7– 61,6 | ||
| 244.712 | 89.42 | 71.4841 | 121,11– 111,10 | ||
| 262.619 | 140.63 | 25.3788 | 132,12– 122,11 | ||
| CH3CHO | 98.901 | 16.51 | 31.2087 | 51,4– 41,3 | |
| 112.249 | 21.14 | 37.9261 | 61,6– 51,5 | ||
| 149.507 | 34.59 | 51.1868 | 81,8– 71,7 | ||
| 168.093 | 42.66 | 57.7848 | 91,9– 81,8 | ||
| HCOOH | 223.916 | 71.93 | 18.7011 | 102,9– 92,8 | |
| 247.514 | 150.71 | 17.0080 | 115,6/7– 105,5/6 | ||
| 257.975 | 83.91 | 23.2080 | 121,12– 111,11 | ||
| 262.103 | 82.77 | 23.2998 | 120,12– 110,11 | ||
2.3 JCMT observations
The frequencies given in the first part of Table 2 were observed for the 7 sources with the JCMT on Mauna Kea, Hawaii from August 2004 to January 2006. The beam size () is 20–21″ for observations in the 230 GHz band and 14″ in the 345 GHz band. The spectra were scaled from the observed antenna temperature scale, , to main beam temperatures, , using main beam efficiencies of 0.69 and 0.63 at 230 GHz and 345 GHz, respectively. The front-ends consisted of the facility receivers A3 and B3; the back-end was the Digital Autocorrelation Spectrometer (DAS), covering 500 MHz instantaneous bandwidth with a spectral resolution of 312.5 and 625 kHz respectively. Pointing was checked every 2 hrs or whenever a new source was observed and was always within 3″. To subtract atmospheric and instrumental backgrounds beam switching with a chop throw of 180″ was used. We aimed for a 20 mK on the scale when binned to a 1 km s-1 channel, which was obtained with integration times of 1 hr at 230 GHz and 2 hrs at 345 GHz dependent on weather. For NGC 6334 IRS1 the confusion limit was reached after 30 minutes of integration, however, at which point the observation was terminated. The absolute calibration is accurate to better than 15% from comparison to spectral line standards.
The JCMT B3 345 GHz receiver was operated in single side band mode to minimize line confusion. The A3 230 GHz receiver does not have the option of image sideband suppression. For line-rich sources like Orion (Sutton et al., 1985), it is difficult to assign a line to the correct sideband. For our sources the 230 GHz spectra are not confusion limited except for NGC 6334 IRS1 (see Fig. 3). For NGC 6334 IRS1, pairs of spectra with 10 MHz offsets were taken. This shifts lines in the image sideband by 20 MHz with respect to those observed in the rest sideband making a unique identification possible.
2.4 IRAM Observations
The frequencies given in the second part of Table 2 have been observed with the IRAM 30 m telescope. The beam size ( in arcsec) is 29″ at 86 GHz, 17″ at 140 GHz, and 10.5″ at 235 GHz. The front-ends were the B100, C150, B230, and C270 facility receivers. The VESPA auto-correlator was used as the back-end, with a bandwidth of 120 MHz, and a channel spacing of 80 kHz. Pointing was checked every 1.5 hrs and was always within 2-3″. Atmospheric and instrumental backgrounds were subtracted through “wobbler” switching where the telescope alternately observes positions +220″ and -220″ away from the source. Integration times differed per source and depended on the atmospheric conditions, but were generally 30 minutes for AFGL 2591 and G75.78, and 1 hr for NGC 7538 IRS1 and W 3(H2O). All observations were converted to the main-beam temperature scale using of 0.78 at 86 GHz to 0.46 at 260 GHz. Conveniently, all observations were performed in single-sideband mode.
3 Data analysis
3.1 Rotation diagrams
Line assignments were made by comparing the observed frequencies corrected for source velocity with the JPL333http://spec.jpl.nasa.gov/ftp/pub/catalog/catform.html, CDMS444http://www.ph1.uni-koeln.de/vorhersagen/ and NIST555http://physics.nist.gov/PhysRefData/Micro/Html/contents.html catalogs. Possible assignments had to be within 1 MHz, unless the uncertainty of the frequencies in the catalogs was larger. For NH2CHO, for example, lines were only assigned if multiple transitions were detected in the same spectrum.
Integrated intensities for the identified lines are given in Tables 11–25. These were used to derive rotation temperatures and column densities through the rotation diagram method (Goldsmith & Langer, 1999) when three or more lines were detected over a sufficiently large energy range. The integrated main-beam temperatures are then related to the column density in the upper energy level by:
| (1) |
where is the column density of the upper level , is the degeneracy in the upper level, is Boltzmann’s constant, is the transition frequency, is the dipole moment, and is the line strength. The total beam-averaged column density in cm-2 can then be computed from:
| (2) |
where is the rotational partition function, and is the upper level energy in K.
The calculated rotation temperatures and column densities can be used to make predictions for the intensities of other lines for a specific species. This was used as an independent check on line-assignments. If lines predicted to have high intensities in the observed frequency ranges are not seen, a detection is considered questionable. In the analysis, a correction has been made for the different beam-sizes at different frequencies. The assumption has been made that the maximum source size is equal to the smallest observed beam-size of the JCMT for all sources, i.e. 14″. The calculations have also been performed assuming that the emission is extended with respect to the largest JCMT beam-size of 21″. In this case, the rotation temperatures are higher and have larger errors by a factor of 2. In reality, as will be discussed in Sect. 3.2, the hot core gas will be even more severely beam-diluted. Finally, the calibration uncertainties are taken into account in the rotation diagram analysis and are shown as error-bars on the rotation diagram plots.
When only very few lines were detected or only a small range in was covered, no rotation temperatures or column densities could be derived. If the detection of the species was considered real, the column density was estimated assuming the rotation temperature to be the average for the same molecule in other sources. If no lines were detected, a 3 upper limit was determined. For lines from isotopologues, rotation temperatures equal to the main species were used to estimate the column densities.
A number of assumptions are implicitly made in the rotation diagram method. In short, they are that the excitation can be characterized by a single temperature and that the lines are optically thin. Even though the first assumption will almost certainly be incorrect, the rotation diagram method does give the average excitation temperature of the region from which most of the molecular emission arises. If the lines are sub-thermally excited because the density is below the critical density (), the rotation temperature is a lower limit. This could also be partly responsible for the scatter in the rotation diagrams. Since for most molecules studied here no collisional rate coefficients are known, a more sophisticated statistical equilibrium analysis is not possible. The critical density, , for the CH3OH 76,K–66,K transitions is 106 cm-3 while for the H2CO 30,3–20,2 transition it is 5106 cm-3. Since is proportional to and , transitions with high values for either will be most affected. Most species in this study have dipole moments close to the CH3OH value of 1.7 Debye. H2CO, CH3CHO, HNCO, NH2CHO, and CH3CN have dipole moments 2-3 times larger and for these species sub-thermal effects should thus be more important. Optical depth can significantly influence the results as well. Column densities derived from optically thick lines will be severely under- and rotation temperatures overestimated. Lines of isotopic species can be used to determine the optical depth. Alternatively, it is possible to predict which lines are optically thick based on the rotation diagram results and exclude those from the fit. In this paper both approaches have been used. A final uncertainty is infrared pumping. It is a well-studied phenomenon for HNCO (Churchwell et al., 1986). Its importance for other species is unknown, although all molecules have dipole-allowed mid-infrared transitions. However, no vibrationally excited lines have been detected in this survey except for CH3OH. With these limitations the rotation diagram method gives a useful indication of the temperature region where the abundance of a molecule peaks.
3.2 Beam dilution correction and hydrogen column density in hot gas
If the emission from the complex organic species comes from a warm region where the temperature is higher than the ice evaporation temperature of 100 K, it becomes important to properly take the amount of beam dilution into account, especially for inter-comparison of the sources. The region where the temperature is above 100 K is expected to be small (″) compared to the size of the single-dish beam, and is related to the luminosity . Also, the beam-dilution depends on the distance as . To correct for the amount of beam dilution we established a set of models for the dust envelopes of our sources based on SCUBA 850 m data666The SCUBA 850 m data were retrieved through the JCMT archive as a Guest User at the Canadian Astronomy Data Center, which is operated by the Dominion Astrophysical Observatory for the National Research Council of Canada’s Herzberg Institute of Astrophysics. For simplification we fix the inner radii of the envelopes to 500 AU, the outer radii to 100,000 AU ( pc) and adopt a power-law density profile, , typical of a free-falling core. is chosen to be so large that gas extending beyond this radius will not significantly contribute. We assume that the total luminosity quoted in Table 1 is provided by a single 30,000 K blackbody at the center of the envelope and fit the observed 850 m fluxes of each source by adjusting the mass of the envelope using the DUSTY dust radiative transfer code (Ivezić et al., 1999) as described in Jørgensen et al. (2002). The results of these models provide a temperature profile for each source from which the radius where the temperature increases above 100 K (), and the beam-dilution can be estimated (see Table 3). Figure 2 compares the inferred source sizes of the warm gas in arcsec with luminosity of the sources with all distances set to 1 kpc. These correlate very strongly with luminosity as expected. Our results are consistent with the independently derived relation from dust modeling of a large range of sources, (Doty private communication). In fact, the luminosity itself can be used to estimate the linear size of the region where the temperature is higher than 100 K. We therefore adopt these radii for the beam dilution correction for molecules that unambiguously probe warm K gas estimated from the rotation diagrams. The derived beam dilution (),
| (3) |
is then used to calculate source-averaged column densities () of hot molecules (X) in Sect. 4.4:
| (4) |
The radiative transfer models used to calibrate the relation can also be used to calculate the hydrogen mass in the inner warm regions and thereby provide an H2 column density to determine molecular abundances for K. With the derived density and temperature profiles listed in Table 3, the number of H2 molecules, (H2), within , can be calculated from:
| (5) |
where is the density of H2 molecules at the inner radius, and the power of the density profiles. The column density of H2 in gas with , in cm-2 is then simply divided by
| (6) |
Since both and refer to column densities for the same temperature region, they can be used directly to calculate abundances for a species X in the hot gas through:
| (7) |
It is clear from Table 3 that the derived values of and (H2) are rather similar for most sources with the exception of AFGL 2591 and G24.78. AFGL 2591 has a significantly smaller and G24.78 a much larger radius and H2 column density. These are related to their low and very high luminosities. The beam-dilution for G24.78 is thus very similar to that for the other sources in our sample. This makes a good comparison between G24.78 and the other sources possible.
Some of our sources have previously been modeled in more detail (e.g., van der Tak et al., 2000; Mueller et al., 2002; Hatchell & van der Tak, 2003); these models show some differences, e.g., in the slope of the density distribution from source to source and even for the same source depending on method. As an example, van der Tak et al. (2000) found that is 5.3103 AU for NGC 6334 IRS1 and 2.8103 AU for W 3(H2O) with a density slope =2. Both values are within 10–15% of our model result. Together with the good agreement with the models by Doty (private communication) this implies that the model-dependent uncertainty has a rather small effect on and the column densities. We therefore consider our adopted approach to provide the internally most consistent set of estimates - even though we caution that a full self-consistent set of models (explaining, e.g., both single-dish and interferometric continuum data) is required to estimate abundances to better than a factor 2–3.
Finally, interferometric observations have shown that even on scales as small as a few thousand AU, there may be strong chemical differentiation, e.g., oxygen-bearing molecules peaking at a different position than nitrogen-bearing species (Liu, 2005; Blake et al., 1996, 1987; Wyrowski et al., 1999; Sutton et al., 1995). From single-dish observations of a single source, it is not possible to determine whether the emission of various species arises from different regions. A comparison of the abundances of the species studied in this paper for a number of sources does, however, show whether the emission likely comes from the same or a different region (Sect. 5).

| Sources | (H2) | ||||
|---|---|---|---|---|---|
| [cm-3] | [AU] | [cm-2] | |||
| AFGL 2591 | 8.5(6) | 1.8(3) | 0.40 | 7.6(22) | 6.2(-2) |
| G24.78 | 1.0(8) | 1.3(4) | 4.8 | 4.0(23) | 5.8(-2) |
| G75.78 | 2.1(7) | 5.6(3) | 0.98 | 1.2(23) | 3.7(-2) |
| NGC 6334 IRS1 | 3.8(7) | 4.7(3) | 1.8 | 2.4(23) | 1.3(-1) |
| NGC 7538 IRS1 | 3.4(7) | 4.9(3) | 1.6 | 2.1(23) | 6.0(-2) |
| W 3(H2O) | 6.2(7) | 2.4(3) | 2.9 | 1.8(23) | 2.9(-2) |
| W 33A | 4.1(7) | 4.5(3) | 1.9 | 2.6(23) | 2.6(-2) |
a Density at inner radius of 500 AU.
b The optical depth is given for the dust at 100 m.
c is the beam-filling factor.
4 Results
4.1 General comparison between sources
Figure 3 shows the spectra at 240.25 and 353.05 GHz toward all sources and Tables 11-25 contain all measured line intensities for the molecules discussed in this paper. There is a clear difference in the “richness” of the sources in molecular lines. The intensities and thus also column densities of “line-poorer” sources are lower for most organic species for sources such as AFGL 2591, G75.78, NGC 7538 IRS1, and W 33A. Some lines, such as the HCOOCH3 314,27– 304,26 at 352.922 GHz, are weak relative to the HNCO 161,15– 151,14 at 352.898 GHz for the “line-poorer” sources, but strong for the “line-richer” sources, i.e. G24.78, NGC 6334 IRS1, NGC 7538 IRS1, and W 3(H2O). There therefore seems to be an intrinsic chemical difference between the “line-rich” and “line-poor” sources.
The two settings shown in Fig. 3 were aimed at detecting the CH2CO 121,12–111,11 transition at 240.187 GHz and the C2H5OH 211,20,2–202,19,2 line at 352.858 GHz. Both transitions were detected in most sources, indicating that the selected settings are suitable for obtaining detections or otherwise limits. Many lines of other target molecules have been detected in these settings as well.

4.2 Optical depth determinations
| Sources | |||||||
|---|---|---|---|---|---|---|---|
| Species | AFGL 2591 | G24.78 | G75.78 | NGC 6334 IRS1 | NGC 7538 IRS1 | W 3(H2O) | W 33A |
| H2CO/HCOa | 37 | 9.3 | 22 | 6.5 | 37 | 31 | 14 |
| HCO/H2C18Ob | 2.4 | 2.8 | 1.7 | 2.4 | 1.6 | 3.0 | 3.5 |
| HNCO/HN13COc | 2.4 | 11 | 6.5 | 8.6 | 2.0 | 3.6 | 7.3 |
| CH3CN/CHCNd | – | 5.8 | 5.9 | 25 | 7 | 9.5 | 7.6 |
a Derived from the 31,2–21,1 transition.
b Derived from the 52,3–42,2 transition.
c Derived from the 100,10–90,9 transition.
d Derived from the overall column density determined from all detected transitions.
| Sources | |||||||
| Species | AFGL 2591 | G24.78 | G75.78 | NGC 6334 IRS1 | NGC 7538 IRS1 | W 3(H2O) | W 33A |
| Hot molecules | |||||||
| H2COb | 1.3(16) | 6.4(16) | 2.2(16) | 1.3(17) | 2.5(16) | 1.8(17) | 5.4(16) |
| HCO | 2.4(14) | 1.2(15) | 4.0(14) | 2.5(15) | 4.8(14) | 3.3(15) | 1.0(15) |
| H2C18O | 7.4(13) | 4.3(14) | 2.5(14) | 1.1(15) | 1.3(14) | 1.7(15) | 3.0(14) |
| CH3OHc | 4.7(16) | 2.8(17) | 1.1(17) | 9.7(17) | 1.2(17) | 1.0(18) | 2.0(17) |
| 13CH3OH | 1.8(15) | 2.9(16) | 4.3(15) | 8.5(16) | 6.7(15) | 3.2(16) | 6.5(15) |
| C2H5OH | 1.0(15) | 7.1(15) | 2.4(15) | 1.9(16) | 5.7(15) | 8.4(15) | 4.7(15) |
| HNCO | 8.3(14) | 5.0(15) | 3.8(15) | 4.3(15) | 2.3(15) | 4.9(15) | 6.6(15) |
| HN13CO | 4.7(14) | 9.3(14) | 1.2(15) | 3.8(14) | 1.2(14) | 2.7(15) | 1.2(15) |
| NH2CHO | 1.3(15) | 7.2(14) | 2.0(14) | 7.4(14) | 5.7(14) | 1.3(15) | 2.1(15) |
| CH3CN | 3.5(15) | 5.9(16)d | 1.8(15) | 2.9(16)d | 8.2(15) | 7.0(15) | 2.7(16) |
| CHCN | 5.3(14) | 1.1(15) | 3.0(14) | 5.6(14) | 1.2(15) | 7.2(14) | 5.0(14) |
| C2H5CN | 7.5(14) | 4.0(15) | 1.2(15) | 5.1(15) | 9.2(14) | 4.5(15) | 2.1(15) |
| HCOOCH3 | 2.4(16) | 3.1(16) | 7.1(15) | 1.2(17) | 1.4(16) | 5.2(16) | 2.5(16) |
| CH3OCH3 | 7.7(15) | 1.2(17) | 2.3(16) | 5.8(17) | 1.6(16) | 1.5(17) | 2.7(16) |
| Cold molecules | |||||||
| CH2CO | 1.6(13) | 2.1(14) | 6.4(13) | 7.2(14) | 9.7(13) | 1.1(14) | 6.3(13) |
| CH3CHO | 3.1(12) | 1.5(13) | 2.1(13) | 1.2(14) | 2.8(13) | 3.5(13) | 3.0(13) |
| HCOOH | 3.4(13) | 2.1(14) | 7.9(13) | 4.9(14) | 9.8(13) | 1.5(14) | 1.3(14) |
| CH3CCH | 7.9(14) | 2.3(15) | 8.6(14) | 5.2(15) | 8.4(14) | 1.5(15) | 1.3(15) |
a The column densities for the hot core molecules are corrected for beam-dilution using the values of listed in Table 2. The cold molecules are given as a beam-averaged column density for a beam of 14″.
b From HCO multiplied by 53.
c From rotation diagram excluding optically thick lines.
d From CHCN multiplied by 53.
Some species such as CH3OH, H2CO, and CH3CN have previously been found to be optically thick in their main lines (see e.g., Helmich & van Dishoeck, 1997). Lines for selected isotopic species were used to determine whether the lines of the main species are optically thick and to derive column densities for the main isotopologues (see Tables 11, 12, 13, 18, and 20). For H2CO and HNCO, the same transition could be used for different isotopologues. For CH3CN, the optical depth was determined by comparing the column density derived from the rotation diagram analysis for the main species and that derived from the detected transition for the isotopologues. The ratios for the beam-averaged column densities are given in Table 4, and the corrected source-averaged column densities in Table 5. In the remainder of the paper a 12C/13C ratio value of 53 for the 4 kpc molecular ring has been used (Wilson & Rood, 1994). Note that this value is uncertain, however, and known to depend on the distance to the galactic center. However, for simplicity we have assumed the same ratio for all sources.
The rotation diagram results by van der Tak et al. (2000) were not corrected for optical depth, because no isotopologues were observed. In our data, however, lines for HCO and H2C18O are observed. The optical depth of H2CO has been determined from the 31,2–21,1 transition. The observed H2CO/HCO ratio ranges from 6.5 for NGC 6334 IRS1 to 37 for AFGL 2591 and NGC 7538 IRS1, lower than the expected ratio, which implies that the main isotopologue is optically thick in many of its transitions. The results for W 3(H2O) are consistent with the optical depth found by Helmich & van Dishoeck (1997). The optical depth of HCO was estimated based on the 52,3– 42,2 transition observed for both HCO and H2C18O. The HCO/H2C18O ratio is lower than the expected value of 5–8 for most sources, but it is unclear whether this difference is significant. We assume therefore for simplicity that HCO is optically thin for all sources.
No direct comparison of the same transition is possible for CH3OH with 13CH3OH. Many detected lines have strengths that are lower by more than an order of magnitude compared to the strongest transitions. It is therefore possible to determine the column density of the main isotopic species by excluding lines predicted to be optically thick for the source-averaged column density from the rotation diagram. This also circumvents the additional error introduced by the uncertain isotopic ratios. As seen in Fig. 10, this excludes mainly lines lying below the fit to the optically thin lines and results in a much better determined rotation temperature.
The limits on the HNCO/HN13CO ratios are smaller than 53, and HNCO could thus be optically thick for all sources. Note that the optical depth determination of HNCO is potentially complicated by the close spacing of the lines of the main species and its isotopologue of only 5 MHz. However, since most of our sources have line widths of only 3-4 km s-1, the upper limits for HN13CO are significant. Since HN13CO has not been detected for any of our sources and most sources studied by Zinchenko et al. (2000), HNCO is assumed to be optically thin throughout the remainder of this paper.
Since it was not one of the target molecules, CH3CN was not observed for all sources. Its lines and those of CHCN were coincidentally present in the image sidebands for some of the sources. For G24.78, NGC 6334 IRS1, and W 33A, both the main species and its isotopologue have been detected and CH3CN is found to be optically thick in the 12–11 and 13–12 transitions with ratios ranging from 5.8 for G24.78 to 24 for NGC 6334 IRS1. For G24.78, this result confirms the findings by Beltrán et al. (2005).
Since HCOOCH3 and CH3OCH3 have relatively high column densities, predictions were made for which lines were optically thick. All lines detected for both molecules were found to be optically thin, if we assume that the emission does not come from a radius smaller than .
4.3 Rotation temperatures
In the following subsection we discuss each molecule individually and compare it with literature; the main results are summarized at the end of this subsection. The rotation temperatures were derived from single temperature fits to rotation diagrams (see Sect. 3.1). Calibration uncertainties of 15% are shown as error bars on the rotation diagrams. All rotation diagrams are shown in Appendix A, and resulting rotation temperatures in Table 6.
H2CO: For H2CO, the data are taken from van der Tak et al. (2000) except for G24.78 and G75.78 (see Fig. 9). The rotation temperatures for all sources except NGC 6334 IRS1 and W 3(H2O) are 80 K. NGC 6334 IRS1 and W 3(H2O) have temperatures of about 100 K higher. However, as the optical depths are similar for most sources, this temperature difference between the sources is real.
CH3OH: For CH3OH no clear temperature trend is seen, but the temperature is generally higher than 100 K. This implies that the emission is coming from warm gas. The CH3OH rotation diagram for some sources like W 33A appears to consist of two temperature components as seen previously by van der Tak et al. (2000) (Fig. 10). However, deducing the presence of two components from a rotation diagram is non-trivial as this behavior could also result from sub-thermal excitation and optical depth effects. Indeed, excluding lines of high optical depth leads to the disappearance of the two-component structure for most sources other than W 33A. The fits in Fig. 10 are especially sensitive to lines with high excitation temperatures and are therefore thought to probe the hot component of the CH3OH gas.
| Sources | |||||||
| Species | AFGL 2591 | G24.78 | G75.78 | NGC 6334 IRS1 | NGC 7538 IRS1 | W 3(H2O) | W 33A |
| H2CO | 89b | 839 | 696 | 193b | 87b | 181b | 88b |
| CH3OH | 14711 | 21113 | 1137 | 17810 | 15610 | 1398 | 25916 |
| C2H5OH | [139] | 1047 | [139] | 16615 | 16417 | 12916 | 12216 |
| HNCO | 648 | 9611 | 10813 | 10512 | 27888 | 14724 | 858 |
| NH2CHO | [119] | 17020 | 7822 | 16629 | 16428 | 717 | 4013 |
| CH3CN | [218] | 26120 | 18925 | 17013 | [218] | 19614 | 27844 |
| C2H5CN | [96] | 995 | [96] | 923 | [96] | 9416 | [96] |
| HCOOCH3 | [119] | 1216 | 8713 | 1447 | 1348 | 1097 | 11215 |
| CH3OCH3 | [130] | 13412 | [130] | 24135 | [130] | 945 | 437 |
| CH2CO | [47] | 396 | 406 | 6720 | 374 | 548 | 457 |
| CH3CHO | [20] | [20] | [37.5] | [37.5] | 185 | 163 | [37.5] |
| HCOOH | [55] | 427 | [55] | 7515 | 7312 | 189108 | 386 |
| CH3CCH | 4512 | 596 | 5914 | 6312 | 5810 | 8215 | 406 |
a The bracket notation indicates assumed rotation temperature, when no temperature could be derived from a rotation diagram.
b H2CO data from van der Tak et al. (2000).
CH2CO: CH2CO has temperatures that are very low, generally only around 40 K. Slightly higher temperatures are found for NGC 6334 IRS1 and W 3(H2O). These temperatures suggest that this molecule is not present in hot regions, but rather in the cold envelope. The IRAM and JCMT detections for NGC 7538 IRS1 and W 3(H2O) are consistent. MacDonald et al. (1996) find very high values of 273 K for G34.3 based on three lines with 100 K. However the integrated intensity for the CH2CO 171,16–161,15 line at 346.6 GHz with 150 K in this survey, also detected by MacDonald et al. (1996), is consistent with the low rotation temperature found in our survey.
CH3CHO: Due to unfavorable weather conditions, IRAM observations of CH3CHO have only been performed for AFGL 2591, G75.78, NGC 7538 IRS1, and W 3(H2O). Almost all targeted lines were detected toward the sources NGC 7538 IRS1 and W 3(H2O). Both sources have rotation temperatures 20 K, consistent with the results found by Ikeda et al. (2001, 2002). Although its relatively high dipole moment of 2.69 D implies that sub-thermal excitation can play a role, it is unlikely that the temperature is above 100 K, especially since molecules with similarly high dipole moments such as HNCO and CH3CN have much higher rotation temperatures.
C2H5OH: C2H5OH consistently has temperatures of more than 100 K. This is somewhat higher than was found by Ikeda et al. (2001), which could be due to both the detection of more high excitation lines in this study. For the lower energy transitions, a steeper slope is observed, which indicates a lower temperature.
HCOOH: HCOOH has relatively low temperatures ranging from 40 K for G24.78, and W 33A to 70 K for NGC 6334 IRS1 and NGC 7538 IRS1. For NGC 7538 IRS1 and W 3(H2O), it was possible to combine results from both IRAM and the JCMT. For NGC 7538 IRS1, low rotation temperatures are confirmed, whereas for W 3(H2O) a scatter of more than one order of magnitude is present. As the W 3(OH) region is close to W 3(H2O) it is possible that emission from this region is picked up in one of the settings. Alternatively, HCOOH could be present in both hot and cold gas with only the cold component present for NGC 7538 IRS1. Due to the larger beam size of the JCMT, the 230 GHz observations are more sensitive to extended emission, whereas the IRAM 270 GHz observations probe a more compact region. Since most sources have low rotation temperatures, we conclude that it is mostly located in a cold environment. Low rotation temperatures have previously been inferred for HCOOH in other high mass star forming regions (Ikeda et al., 2001).
HNCO: The rotation temperature of HNCO varies between the different sources. This is not unexpected since the HNCO excitation is known to be dominated by radiation and not collisions (Churchwell et al., 1986). It is therefore not likely to provide much information about the actual kinetic temperature of the species. However it does need to be close to an infrared source to be excited, and thus must be present in hot gas. Finally, it is important to note that excluding the line with 300 K (see Fig. 15) strongly reduces the inferred rotation temperature for NGC 6334 IRS1 from 180 K to 106 K.
NH2CHO: NH2CHO has a variety of rotation temperatures. The scatter in the derived rotation temperatures appear to be relatively large, with especially NGC 7538 IRS1 being an outlier (Fig. 16). There is also some indication that there may be two temperature components - most clearly seen for the sources where many lines with 200 K are detected. Since NH2CHO has lines very close to the detection limit, this component may also be present for the other sources, but simply below the detection limit.
CH3CN: Rotation temperatures of CH3CN range from 170–280 K. It is thus always present in hot gas (see Fig. 17). The particularly high temperatures for G24.78 and W 33A are upper limits due to high optical depths. Pankonin et al. (2001) find lower rotation temperatures of 89 K for G24.78 which confirm this picture. For NGC 6334 IRS1 only three lines with 500 K have been detected, making the resulting rotation temperature uncertain. However, it seems clear that the rotation temperature for CH3CN is high, and the species must be present in hot gas.
C2H5CN: The other cyanide, C2H5CN, only has enough detected lines for three of the sources to allow a determination of the rotation temperature (see Fig. 18). For all three sources temperatures of 90 K are found. Fewer lines have been detected for W 3(H2O), but the fact that the results for this source are rather similar gives additional credibility to the derived temperatures.
CH3CCH: CH3CCH generally has rotation temperatures below 80 K - except for G24.78, NGC 6334 IRS1, and W 3(H2O). The higher temperatures for these three sources are, however, questionable. Removing the point with 300 K gives significantly lower temperatures for G24.78 and NGC 6334 IRS1 (see Fig. 19). The W 3(H2O) generally has a higher uncertainty and scatter on the data, which may in fact cause the higher temperature found for this source.
HCOOCH3: HCOOCH3 is detected in almost all of the sources, but with a relatively large scatter on the data. The temperature generally seems to be between 100–150 K, with somewhat lower values when less lines have been detected. For G75.78 the results are inconclusive as the upper limits on high energy transitions are not significant. Somewhat lower temperatures were found by Ikeda et al. (2001), which could be due to a difference in the number of detected lines.
CH3OCH3: CH3OCH3 also appears to have a relatively large spread in rotation temperatures (see Fig. 21). For W 33A, only lines with 100 K were detected, which result in low rotation temperatures. The upper limits on lines with 150 K are not significant, however, and do not exclude temperatures above 100 K. Rotation temperatures above 100 K are commonly seen for CH3OCH3 (Ikeda et al., 2001).
In summary, the temperatures for most molecules are rather consistent between all sources. The molecules can clearly be divided into “hot” ( K) and “cold” (100 K) where H2CO, CH3OH, C2H5OH, HNCO, NH2CHO, CH3CN, C2H5CN, HCOOCH3, and CH3OCH3 belong to the first and CH2CO, CH3CHO, HCOOH and CH3CCH to the second category.
4.4 Column densities
Table 5 and Figure 4 present the source-averaged column densities, i.e., corrected for beam dilution (Sect. 3.2), for the hot molecules per source. Absolute column densities are compared to determine the variability between different sources. Since we have assumed the beam dilution to be the same for all molecules, the trends for the beam-averaged column densities are similar. Molecules with rotation temperatures below 100 K are present in a different, cold region, presumably the envelope surrounding the hot region, and beam-averaged column densities are therefore given for those. Thus, the column densities for the hot and cold molecules in Fig. 4 and 5 cannot be compared directly.
Clearly, most molecules have column densities that vary by about an order of magnitude in the hot gas between the different sources. The column density variations do not scale with the luminosity and thus total mass in the hot region. CH3OH, H2CO, but also HCOOCH3, and CH3OCH3 - if detected - have column densities that are orders of magnitude higher than those of C2H5OH, HNCO, and NH2CHO. As will be discussed in Sect. 5 abundances show a similar trend. The advantage of comparing column densities is that they come directly from the observations and no assumption on the H2 column in the hot gas enters the analysis.
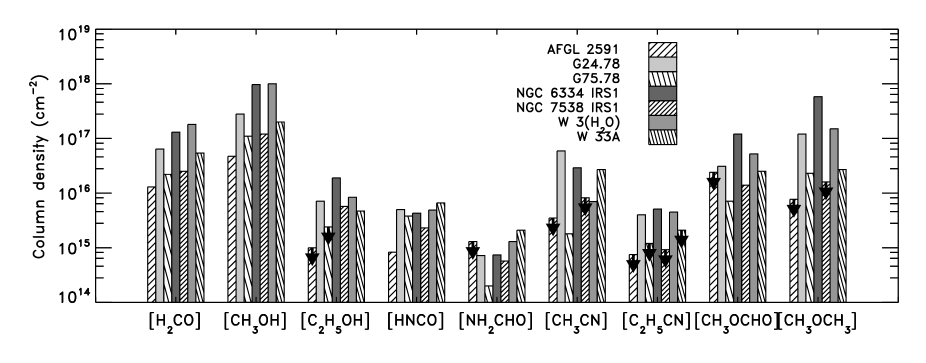
Most hot molecules have source-averaged column densities that are highest for the line-rich sources NGC 6334 IRS1, G24.78, and W 3(H2O). For the oxygen-bearing molecules C2H5OH, CH3OCH3, HCOOCH3, G24.78 has a higher column density than W 3(H2O). W 3(H2O) has a higher column density of CH3OH and H2CO, however. Thus H2CO and CH3OH have variable column densities compared to the other oxygen-bearing molecules. Nonetheless the column density trends between the oxygen-bearing species are similar.
The HNCO and NH2CHO column densities peak for W 33A and G24.78, and have very similar column density trends with respect to each other. W 33A has the highest and G75.78 the lowest column densities. NGC 7538 IRS1 has a relatively high column density for these species compared with the oxygen-bearing species. The column densities of the nitrogen-bearing species do, therefore, behave different from the oxygen-bearing species.
CH3CN has a relatively high column density for G24.78 and W 33A, but the uncertainties make it more difficult to compare its column density trends with other molecules (see Sect. 4.3). The general CH3CN column density trends appear more similar to those of HNCO and NH2CHO than to the O-bearing species. However, if we consider only the two sources for which both the main species and its isotopologue CHCN were detected with 500 K, the relative column densities appear more similar to those of the oxygen-bearing species.
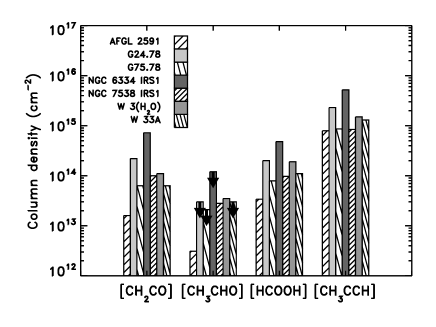
Figure 5 shows the beam-averaged column densities for the cold molecules, CH2CO, HCOOH, and CH3CCH. Clearly all three have very similar trends. NGC 6334 IRS1 has the highest column density and AFGL 2591 the lowest. For CH3CHO, the number of sources with detections is limited and it was thus not possible to compare its column density trends with the other species.
In summary, the molecular abundances vary about an order of magnitude between the sources. Furthermore, all oxygen-bearing species have similar abundance trends, but the abundances of HNCO and NH2CHO behave differently.
5 Column density and abundance correlations
Molecular column densities and abundances can be compared between sources in different ways, two of which will be presented here. Abundances can be estimated relative to column densities of (i) H2 calculated on the basis of CO, (ii) H2 derived from dust continuum observations (see Sect. 3.2) or (iii) one of the observed molecules, typically CH3OH. The disadvantage of method (i) is that CO gas is likely extended over much larger scales than the hot molecules due its lower desorption temperature. Observations of high excitation lines of CO isotopologues which probe only hot gas, will make this method possible in the future. In this paper, we use (ii) and (iii), and adopt (i) only for the cold molecules.
Abundances with respect to H2 column densities from modeling of dust continuum observations (Sect. 3.2) and to CH3OH column densities (Sect. 5.2) have the advantage that they allow comparisons to “only material at high temperatures” or “species probing the regions solely of interest”. Both approaches also have disadvantages, however. Since H2 is not directly observed, one has to rely on other tracers, in our case dust. Extrapolations of density and temperature profiles are made to scales smaller than actually probed by the observations. CH3OH is directly observed, but this method implicitly assumes that the abundance of CH3OH is constant from source to source. If this is not the case incorrect correlations of abundances with respect to CH3OH can be found, as we will return to in Sect. 5.2.
5.1 Abundances in 100 K gas
Table 7 lists the molecular abundances within the gas with 100 K for each source in our sample calculated through Eq. (7). The abundances have the same trends between the different sources as the column densities. Most molecules have abundances that vary one order of magnitude from source to source, as was also seen for CH3OH by van der Tak et al. (2000). The standard deviation on the average abundances is larger than our estimated uncertainty of a factor 2-3 (Sect. 3). Thus the observed variations are real. Furthermore, the overall abundances are relatively high compared to values in the literature. This is because we have determined the abundances with respect to the H2 column density within , whereas in e.g., Ikeda et al. (2001) they are determined based on CO transitions, which trace gas that is cooler and extended with respect to the hot core.
| AFGL 2591 | G24.78 | G75.78 | NGC 6334 IRS1 | NGC 7538 IRS1 | W 3(H2O) | W 33A | Average | a | |
| Hot moleculesb | |||||||||
| H2CO | 1.7(-7) | 1.6(-7) | 1.8(-7) | 5.4(-7) | 1.2(-7) | 1.0(-6) | 2.1(-7) | 3.4(-7) | 3.2 |
| CH3OH | 7.0(-7) | 6.5(-7) | 9.2(-7) | 4.0(-6) | 5.7(-7) | 5.4(-6) | 7.3(-7) | 1.9(-6) | 2.0 |
| C2H5OH | 1.4(-8) | 1.9(-8) | 2.0(-8) | 7.5(-8) | 2.5(-8) | 4.4(-8) | 1.8(-8) | 3.6(-8) | 2.3 |
| HNCO | 7.0(-9) | 1.3(-8) | 3.2(-9) | 1.8(-8) | 1.1(-8) | 2.7(-8) | 2.5(-8) | 1.6(-8) | 0.91 |
| NH2CHO | 1.7(-8) | 1.8(-9) | 1.7(-9) | 3.1(-9) | 2.6(-9) | 5.6(-9) | 8.5(-9) | 3.9(-9) | 2.7 |
| CH3CN | 4.6(-8) | 1.5(-7) | 1.5(-8) | 1.2(-7) | 3.9(-8) | 3.9(-8) | 1.0(-7) | 8.5(-8) | 5.6 |
| C2H5CN | 9.9(-9) | 1.0(-8) | 1.0(-8) | 2.1(-8) | 4.4(-9) | 2.5(-8) | 8.1(-9) | 1.7(-8) | 0.77 |
| HCOOCH3 | 3.2(-7) | 7.3(-8) | 5.9(-8) | 4.6(-7) | 6.7(-8) | 2.9(-7) | 9.6(-8) | 1.7(-7) | 1.6 |
| CH3OCH3 | 1.0(-7) | 3.0(-7) | 1.9(-7) | 2.4(-6) | 7.6(-8) | 8.3(-7) | 1.0(-7) | 7.7(-7) | 9.6 |
| Cold moleculesc | |||||||||
| CH2CO | 3.1(-11) | 8.8(-10) | 8.5(-11) | 2.8(-10) | 4.1(-10) | 1.3(-10) | 4.1(-10) | 3.2(-10) | 2.9 |
| CH3CHO | 6.1(-12) | 6.3(-11) | 2.8(-11) | 4.7(-11) | 1.2(-10) | 4.1(-11) | 1.9(-10) | 5.6(-11) | 5.8 |
| HCOOH | 6.7(-11) | 8.8(-10) | 1.0(-10) | 1.9(-10) | 4.2(-10) | 1.8(-10) | 8.4(-10) | 3.8(-10) | 3.4 |
| CH3CCH | 1.5(-9) | 9.6(-9) | 1.1(-9) | 2.1(-9) | 3.6(-9) | 1.8(-9) | 8.4(-9) | 4.0(-9) | 3.5 |
a refers to the same order of magnitude as the average.
b The abundances are derived with respect to the column density of H2 within in Sect. 3.2 and Table 3.
c The abundances are derived using the CO column densities from van der Tak et al. (2000), except G24.78 and G75.78 for which the data comes from Cesaroni et al. (2003) and Hatchell et al. (1998) respectively.
c refers to the same order of magnitude as the average.
| H2CO | CH3OH | C2H5OH | HNCO | NH2CHO | CH3CN | HCOOCH3 | CH3OCH3 | HCOOH | |
|---|---|---|---|---|---|---|---|---|---|
| H2CO | 1.00 | 0.98 | 0.76 | 0.46 | 0.53 | -0.07 | 0.88 | 0.75 | 0.76 |
| CH3OH | 0.98 | 1.00 | 0.86 | 0.38 | 0.39 | -0.07 | 0.92 | 0.86 | 0.70 |
| C2H5OH | 0.76 | 0.86 | 1.00 | 0.02 | 0.22 | 0.12 | 0.92 | 0.95 | 0.30 |
| HNCO | 0.46 | 0.38 | 0.02 | 1.00 | 0.38 | 0.81 | 0.16 | -0.27 | 0.98 |
| NH2CHO | 0.53 | 0.39 | 0.22 | 0.38 | 1.00 | 0.17 | 0.42 | -0.02 | 0.65 |
| CH3CN | -0.07 | -0.07 | 0.12 | -0.81 | 0.17 | 1.00 | 0.29 | 0.20 | -0.51 |
| HCOOCH3 | 0.88 | 0.92 | 0.92 | 0.16 | 0.42 | 0.29 | 1.00 | 0.90 | 0.49 |
| CH3OCH3 | 0.75 | 0.86 | 0.95 | -0.27 | -0.02 | 0.20 | 0.90 | 1.00 | 0.09 |
| HCOOHa | 0.76 | 0.70 | 0.30 | 0.98 | 0.65 | -0.51 | 0.49 | 0.09 | 1.00 |
a Assuming that the HCOOH emission comes from within .
The abundances of the species detected in our sources with K were compared by estimating the Pearson correlation coefficients between log(X/H2) vs log(Y/H2) (see Table 8). C2H5CN is not compared with the other species due to the low number of sources with detections. Although the number of sources for the other molecules are limited and correlations therefore only suggestive, a number of interesting trends are seen. These result from groups of molecules with very similar abundance trends.
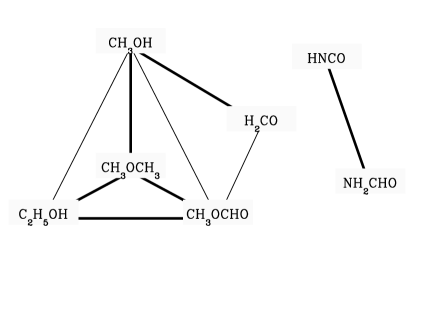
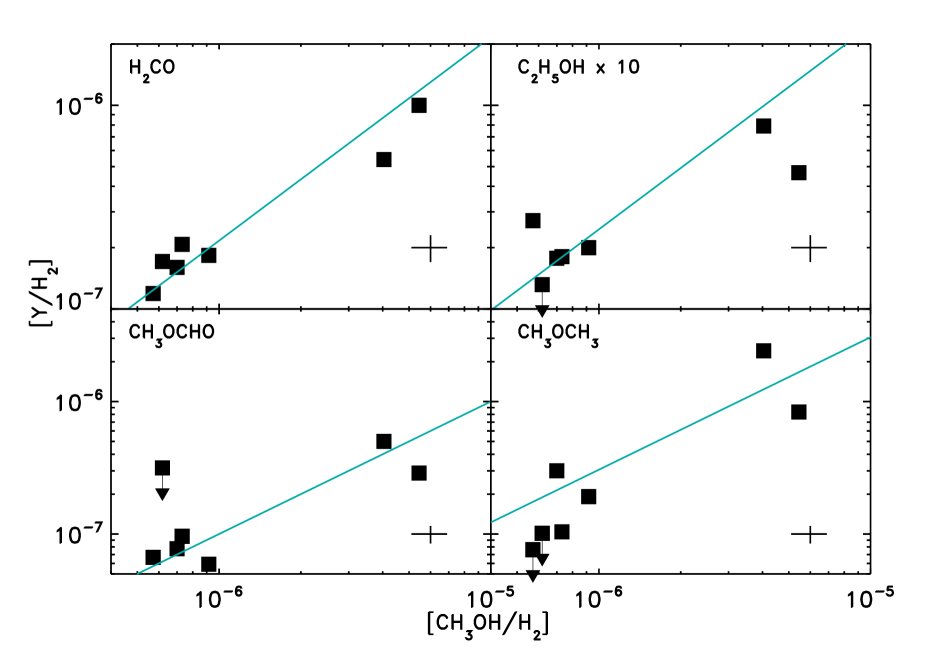
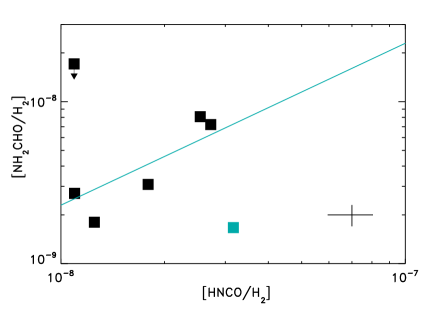
First, the abundances of the nitrogen-bearing species do not correlate with those of oxygen-bearing species. Strong correlations are, however, found between the oxygen-bearing species H2CO, CH3OH, C2H5OH, HCOOCH3, and CH3OCH3. Figure 7 shows the abundances of all hot oxygen-bearing species with respect to H2 compared to CH3OH/H2. The nitrogen-bearing species HNCO and NH2CHO also appear to be well correlated, which follows from the column density trends (Sect. 4 and shown in Fig. 8). The NH2CHO abundance for G75.78 is uncertain, as only few lines were detected. The correlation coefficient is 0.38 with this source included and 0.92 without.
| Molecule | abundance ratio() | Orion Compact Ridgea | G34.3b | Sgr B2(N)c | G327.3d | GC cloudse |
|---|---|---|---|---|---|---|
| with respect to CH3OH | ||||||
| H2CO | 0.220.05 | 0.10 | 0.009 | 0.0025 | – | 0.01 |
| C2H5OH | 0.0250.013 | 0.004 | 0.19 | 0.005 | 0.05 | 0.04 |
| HCOOCH3 | 0.100.03 | 0.08 | 0.86 | 0.005 | 0.96 | 0.04 |
| CH3OCH3 | 0.310.20 | 0.05 | – | 0.015 | 7 | 0.04 |
| with respect to HNCO | ||||||
| NH2CHO | 0.360.08 | – | – | 0.23 | 0.07 | |
a Sutton et al. (1995)
b MacDonald et al. (1996)
c Nummelin et al. (2000).
d Gibb et al. (2000a).
e Requena-Torres et al. (2006).
If the HCOOH emission is assumed to arise in hot instead of cold gas, its abundance correlates with very few molecular species. Its strongest correlation is with HNCO with a coefficient of 0.98. This result is surprising and due to the low rotation temperatures for HCOOH questionable.
The abundances of the hot molecules presented in Table 7 and Fig. 7 assume the same beam dilution factor corresponding to . As Table 6 shows, the rotation diagram temperatures of several species are significantly higher than 100 K. The 200 K radius is typically a factor of 3 smaller than that for 100 K so that the beam dilution and abundances can be a factor 9 larger. If all emission of hot molecules would arise from a smaller region, the correlations would remain the same. If some species are present in 100 K gas and others in 200 K gas, the correlations would disappear, however. The differences in rotation temperatures in Table 6 are assumed to arise largely from other effects such as optical depth, sub-thermal excitation, or the detection of very high or low lying energy levels affecting the overall fit. Future interferometric observations of multiple high mass sources could determine whether the assumption of a single source size for all molecules is correct.
For the molecules that have abundances that do correlate, the abundance ratios were calculated with respect to either CH3OH/H2 or HNCO/H2 and are shown in Table 9. Figure 6 shows the empirical relations for molecules with Pearson coefficients of 0.8 and higher. Per set of species the ratios vary no more than a factor of three, the previously found uncertainty in the abundances. H2CO, HCOOCH3, and CH3OCH3 have 5-10 times lower abundances than CH3OH. NH2CHO is a factor 3 times lower than HNCO. Possibly, coefficients between 0.8–0.9 are present between species that are not directly chemically related, but that are both strongly correlated with a third species.
5.2 Abundances with respect to CH3OH
The Pearson correlation coefficients of log(X/CH3OH) vs. log(Y/CH3OH) differ significantly from the correlations in Sect. 5.1. First, strong correlations are not present between the same species. This is due to the variability of the CH3OH abundance between the different sources, and to the dependence of the correlations on three (X, Y, and CH3OH) rather than two (X and Y) species. The abundances of two species with respect to CH3OH will correlate when their abundances with respect to H2 correlate but also when the abundance of one of the species correlates with that of CH3OH. This makes it difficult to use correlations of abundance ratios with respect to CH3OH to chemically link molecules. Instead it is better to compare X/CH3OH with the CH3OH column density or abundance, i.e. N(CH3OH) or CH3OH/H2 as has been done by e.g., Requena-Torres et al. (2006).
5.3 Comparison to other well known sources
The abundance ratios with respect to CH3OH are compared in Table 9 to other well-studied high mass star forming regions, specifically the Orion Compact Ridge (Sutton et al., 1995), G34.3 (MacDonald et al., 1996), Sgr B2(N) (Nummelin et al., 2000), and G327.3 (Gibb et al., 2000a). The ratios for the Orion Compact Ridge all agree within the error bars for H2CO and HCOOCH3. CH3OCH3 has a relatively low abundance with respect to CH3OH. Only three lines have been detected for this species in the Compact Ridge and it has a rather low excitation temperature of 75 K implying that it is perhaps present in a colder region.
In contrast, the relative abundances for G34.3 deviate more from those in our work. The H2CO/CH3OH ratio by MacDonald et al. (1996) is probably a lower limit as only one line was detected for G34.3 and the column density of HCO was calculated to be higher than the main H2CO isotopologue based on their respective line intensities. Both C2H5OH and HCOOCH3 have relatively high abundances with respect to CH3OH. This could potentially be due to high optical depth in the lines of CH3OH. MacDonald et al. (1996) assumed the emission to be optically thin, and thus underestimate the CH3OH column density. The relative abundances of C2H5OH and HCOOCH3 are similar between G34.3 and the sources studied in this paper.
The abundance ratios with respect to CH3OH for Sgr B2(N) from Nummelin et al. (2000) appear to be significantly lower than for the sources in our sample. This is due to the CH3OH emission being decomposed into a core and a halo component for Sgr B2(N), whereas that of the other molecules is not. For this source it is more relevant to compare the relative ratios between the different molecules. The C2H5OH abundance is high compared to HCOOCH3 and CH3OCH3. However, the HCOOCH3/CH3OCH3 and the NH2CHO/HNCO ratios of 0.33 are similar to those for our sources.
G327.3 in the study of Gibb et al. (2000a) has a C2H5OH/CH3OH abundance ratio a factor of 2 higher compared to the average for our sample. Small deviations could be caused by their relatively low rotation temperature for C2H5OH of 66 K. HCOOCH3 and CH3OCH3 have relatively high abundances with respect to CH3OH, but HCOOCH3/CH3OCH3 is within a factor two of the ratio derived for our sample. Again NH2CHO/HNCO is the same within error to our sample.
Molecular abundance ratios can also be compared to those found in shocked gas in the galactic center by Requena-Torres et al. (2006). Their sources have relatively constant ratios of complex molecules with respect to CH3OH of 0.04. The H2CO/CH3OH and CH3OCH3/CH3OH ratios are significantly higher for our hot cores. Small differences may be due to the fact that Requena-Torres et al. (2006) observed rotational transitions with 40–50 K, whereas lines with excitation energies that range from 20–900 K have been observed in this study.
In summary, the overall emerging picture is that of relatively constant abundance ratios between various molecules comparable to the sources for our sample. Distinct differences for individual species can often be ascribed to specific observation or analysis problems.
5.4 Comparison with ice abundances
| Species | W 33Aa | NGC 7538 IRS1b | AFGL 2591b | HH 46c (low mass) | CK 2c (field star) | gas phased |
|---|---|---|---|---|---|---|
| 10-5 | 10-5 | 10-5 | 10-5 | 10-5 | ||
| H2CO | 0.65 | – | – | – | – | 3.2(-7) |
| CH3OH | 1.4-1.7 | 0.4 | 1.4 | 1.2 | 0.11 | 2.0(-6) |
| HCOOH | 0.37-0.71 | 2.2 | 1.7 | 1.5 | 0.11 | 3.8(-10) |
| CH3CHO | 0.98 | 1.2 | 0.66 | – | – | 5.6(-11) |
| OCN- | 0.63 | 0.05 | – | 0.12 | – | 1.6(-8)e |
a From Gibb et al. (2000b); Dartois et al. (1999); Schutte et al. (1999); Whittet et al. (2001); Demyk et al. (1998).
b From Gibb et al. (2004).
c From Knez et al. (2005) and references therein.
d Average abundances from this paper.
e Assuming that OCN- evaporates as HNCO.
It is interesting to relate the gas-phase abundances derived above to the ice abundances from mid-infrared observations. Of the sources in our sample, AFGL 2591, NGC 7538 IRS1 and W 33A were also observed at mid-infrared wavelengths with ISO (Gibb et al., 2004). Table 10 lists the abundances of the ice species from that paper assuming an H2O abundance of 10-4 with respect to H2. W 33A is particularly rich in organics in the solid state whereas the other two sources mainly have upper limits. The solid state abundances of CH3OH are at least an order of magnitude higher than the comparable source-averaged gas phase abundances. The H2CO abundance of 210-6, although more uncertain, is also larger by an order of magnitude (Keane et al., 2001). For W 33A, however, the solid H2CO/CH3OH abundance ratio is consistent with the gas phase abundance ratio.
Where detected toward high mass YSOs, solid HCOOH and CH3CHO have abundances of 10-6–10-5 and 10-5 respectively (Schutte et al., 1999; Keane et al., 2001; Gibb et al., 2000b, 2004). Similar abundances for solid HCOOH are found toward background stars by Knez et al. (2005). These absolute solid state abundances are four to five orders of magnitude higher than the gas phase abundances for the same sources.
The XCN band is detected in many objects and usually assigned to OCN- (Grim & Greenberg, 1987; Demyk et al., 1998; Pendleton et al., 1999; Gibb et al., 2000b; van Broekhuizen et al., 2005). OCN- is thought to convert to and evaporate off grains as HNCO (Sect. 6.1). Abundances of solid OCN- vary and range from 110-7–410-6 (van Broekhuizen et al., 2005; Thi et al., 2006). Gas phase abundances of HNCO are factors of 100–1000 times lower.
Many of the species are expected to have abundances in the ice below the detection limit. Boudin et al. (1998) determined upper limits for the column densities of a number of more complex organic molecules, including C2H6 and C2H5OH toward NGC 7538 IRS9. The upper limit on the C2H5OH abundance is 1.2 with C2H5OH/CH3OH 0.28. This is consistent with the C2H5OH/CH3OH abundance ratio of 0.009 in the gas phase for our sample of sources.
In summary, the absolute ice abundances of observed “first generation” species, CH3OH and OCN-, are 10–102 times higher compared to the gas phase values, and as much as a factor of 104–105 for HCOOH and CH3CHO.
6 Discussion and comparison to astrochemical models
6.1 General model considerations
Pure gas phase chemistry models such as presented in e.g., Lee et al. (1996), are unable to explain the high abundances of many complex organics, especially of highly saturated molecules in hot gas phase environments. CH3OH, for example, is estimated to have abundances of 10-12 through pure gas phase chemistry, whereas abundances of 10-6 are found. For CH3CN abundances of 10-10 are modeled (Lee et al., 1996) whereas abundances of 10-7 are detected. Furthermore, they are not able to explain the presence of complex organics in ices by simple freeze-out of gas phase species (see Herbst, 2005, for a review). For highly saturated molecules, solid state chemistry provides a likely alternative. Here one can distinguish basic grain surface chemistry and chemistry induced by energetic processing (UV irradiation, energetic particle bombardment and/or thermal heating) which can proceed also inside the ice.
Surface chemistry models have been developed by several groups (e.g., Hasegawa & Herbst, 1993; Charnley, 2001; Keane, 2001) (see Fig. 1). The results are generally very sensitive to the atomic C, O, and N abundances in the gas. Moreover, the dust temperature () plays a crucial role in the mobility of the atoms and radicals as well as the availability of CO as a reaction partner on the grain, which evaporates at 20 K (Tielens & Hagen, 1982; Caselli et al., 1993). However, if CO is located in an ice environment that is dominated by H2O it will be available for reactions in the ice up to much higher temperatures (Sandford & Allamandola, 1993; Collings et al., 2003).
If grain surface chemistry is the explanation for our observed correlations, the constant abundance ratios for different sources must imply very similar conditions during ice formation, at least of the ice layer that contains the “hot” molecules. This is also confirmed by the similarity between the composition of ices observed toward background stars compared to those toward low and high mass star forming regions (Knez et al., 2005). Perhaps the simplest explanation is that the bulk of the ice forms at similarly low temperature conditions in which the bulk of the oxygen and nitrogen are in atomic form and C/CO is at a fairly constant ratio, around 0.01 as computed for dense clouds (Gredel et al., 1989). When these “first generation” species evaporate together and have similar destruction rates, a constant abundance ratio would result even in regions where the temperatures of the gas and UV-flux are very different.
In contrast, “second generation” species are expected to peak at different times dependent on their formation and destruction processes. While this argument has been used to explain the anti-coincidences between the nitrogen and oxygen-bearing species (Caselli et al., 1993; Rodgers & Charnley, 2003), it is inconsistent with our observed correlations of supposedly “second generation” species HCOOCH3 and CH3OCH3 with other “first generation” oxygen-bearing molecules. Indeed, in models by Garrod & Herbst (2006) where HCOOCH3 is formed in the solid state, many of the oxygen-bearing species have similar gas phase abundance variations throughout the chemical evolution and have constant abundance ratios. Solid state formation is therefore more likely for the supposedly “second generation” oxygen-bearing species. However, the abundances of oxygen-bearing and nitrogen-bearing species do not correlate. This can be due to a different time-dependence of formation and destruction or a variable N/C abundance ratio.
Laboratory experiments show that beyond a certain minimum dose of irradiation the reaction products often do reach a constant plateau (Gerakines et al., 1996; Moore & Hudson, 2000; van Broekhuizen et al., 2004; Hagen et al., 1979). Oxygen-bearing species, such as H2CO, and nitrogen-bearing species, e.g., OCN- and NH2CHO, can be formed this way (Grim et al., 1989). However, there is not enough information in the literature on the formation of the more complex molecules observed here to make a quantitative test of this scheme. It is plausible, though, that an equilibrium between formation and destruction is reached in interstellar ices and could be responsible for the constant abundance ratios between the oxygen-bearing species or HNCO/NH2CHO.
Recent work by Garrod & Herbst (2006) combines both grain surface chemistry and UV-induced chemistry with thermal evolution of the ices during the protostellar phase. In particular, radicals created in the ices by ultraviolet radiation become mobile at the higher dust temperatures during the warm-up phase and lead to the formation of many complex organic species. This suggests that the ice composition changes with temperature. Potentially only the ices on grains that are close to the evaporation temperature have similar relative abundances to those observed in the gas phase. Since the detected ice features are observed in a column, they will contain both cold and warmer ices, which complicates the comparison of the ice abundances with the gas phase, even within one source.
Species such as HCOOH and CH3CHO are detected with much lower column densities in the gas phase than in the ice (see Section 5.4) and have low rotation temperatures. Possibly, these species are formed in the solid state at low temperatures and destroyed due to reactions at high temperatures. Since their desorption temperatures are typically 100 K (Viti et al., 2004; Bisschop et al., in prep.), thermal desorption cannot account for their low temperatures. However, non-thermal mechanisms induced by, for example, cosmic rays (Léger et al., 1985), can explain the low gas phase abundances if they cause a small fraction (10-4) of the ice to evaporate (see Sect. 6.2). Alternatively, cold gas phase ion-molecule reactions are able to reproduce the abundances of e.g., CH3CHO and CH2CO (Lee et al., 1996, see also Sect. 6.2).
Ices are expected to be layered because different molecules such as H2O, CO, and N2 form or condense at different densities. Since nitrogen is transformed into N2 deepest in the cloud it is expected to freeze-out last. To form species such as HNCO or NH2CHO a more reactive form of nitrogen, i.e. N-atoms are needed. N-atoms could potentially be present in a non-hydrogen bonding layer dominated by CO or a layer dominated by H2O. If they were present in the non-hydrogen bonding layer a small fraction of non-thermal desorption would result in cold gas phase N-bearing species. The lack of these cold N-bearing molecules and high rotation temperatures of HNCO and NH2CHO suggests that they desorb at higher temperatures and must thus be present in a different, more tightly bound ice layer.
In summary, pure gas-phase reactions cannot reproduce the abundances of most species depicted in Fig. 1, and second generation gas phase chemistry is inconsistent with the observed correlations for the oxygen-bearing species. Constant abundance ratios after ice evaporation can be explained either by similar initial conditions for ice formation or an equilibrium between formation and destruction due to energetic processes. The low abundances of cold gas phase species could be due to gas phase ion-molecule reactions or non-thermal desorption of a small fraction of the ices e.g., by cosmic rays.
6.2 Individual molecules
This subsection elaborates on the general conclusions stated in Sect. 6.1 for individual molecules, grouped according to the different branches of Fig. 1.
H2CO and CH3OH: CH3OH and H2CO are molecules commonly expected to originate from grain-surface chemistry. They are formed through successive hydrogenation of CO on grains, a scheme that has been tested experimentally by Hiraoka et al. (2002), Watanabe et al. (2004), and Fuchs et al. (in prep.). Both H2CO and CH3OH have been detected in these experiments with different abundance ratios dependent on the exact conditions. H2CO can also be formed by UV-irradiation of CH3OH containing ices (Allamandola et al., 1988; Bernstein et al., 1995). However, the high ice abundances of CH3OH (e.g., Gibb et al., 2004) and the constant abundance ratio between H2CO/CH3OH in this paper are inconsistent with this CH3OH destruction mechanism. Our data imply that hydrogenation reactions are more feasible formation mechanisms.
Furthermore as discussed in Sect. 5.4, the solid state abundance of CH3OH appears to be at least an order of magnitude higher than the comparable source-averaged gas phase abundances. This could be due to a number of effects: i) CH3OH is partly destroyed upon evaporation, ii) intrinsic CH3OH ice variations from source to source (Brooke et al., 1999; Dartois et al., 1999; Pontoppidan et al., 2004), iii) an underestimate of the beam-filling factor of the CH3OH emitting gas. Possibly, all three factors contribute to the relatively low gas phase abundance.
CH2CO, CH3CHO, and C2H5OH: In Figure 1 CH2CO, CH3CHO, and C2H5OH are thought to be interrelated through successive hydrogenation as well as to H2CO and CH3OH by successive H- and C-atom addition. All three species are expected to evaporate from the ice together with H2O (Viti et al., 2004) and have similar rotation temperatures. This is not the case, however. Indeed, interferometric observations of CH3CHO in high mass star forming regions show that CH3CHO emission is extended with respect to hot cores species such as HCOOCH3 and CH3OCH3 (Liu, 2005). This suggest that CH2CO, CH3CHO, and C2H5OH gas are not present in the same region. Possibly, H-atom addition to CH2CO and CH3CHO on grains is very efficient and completely converts them to C2H5OH at high temperatures, so that only C2H5OH evaporates from the ice and is detected in the warm inner regions. Non-thermal desorption of a small fraction due to e.g., cosmic ray spot heating of CH2CO and CH3CHO ice in cold regions could explain the low gas phase abundances and rotation temperatures, as well as the high ice abundances of CH3CHO. Alternatively, C2H5OH could be formed through another surface reaction related to CH3OH and H2CO formation, explaining its constant abundance ratio.
For CH2CO and CH3CHO there are also potential gas phase formation mechanisms. Millar & Nejad (1985) argue that CH2CO could result from radiative associative reactions between CH and CO. Assuming that CH3CO+ dissociative recombination results in CH2CO for 50% of the cases, this would allow for CH2CO abundances of 10-10, comparable to our observed abundances and also to those by Turner et al. (1999). Gas phase models by Lee et al. (1996) predict fractional abundances of 510-12 for CH3CHO and its isomers. This is lower than the abundances of Ikeda et al. (2001) and Charnley (2004) but close to the abundances for some of our sources. Herbst & Leung (1989) proposed that H3O+ and C2H2 react to form CH3CHO after dissociative recombination, which results in higher abundances of up to 10-10 in dark clouds. Many of these conclusions depend on high branching ratios toward these products in dissociative recombination. If three body break-up prevails as found for some species, pure gas phase production becomes untenable (Geppert et al., 2005).
HCOOH: High abundances of HCOOH in the ice, low gas phase rotation temperatures, and orders of magnitude lower abundances in the gas phase compared to the solid state can be due to two reasons: i) HCOOH is quickly destroyed in the gas phase upon evaporation, and ii) HCOOH is abundant in low temperature ice, but destroyed at higher temperatures due to reactions in the ice. Gas phase destruction is a possibility, but it is unclear why the destruction rate of HCOOH would be orders of magnitude larger compared to other species. Even if this would be the case, most high mass star-forming regions are expected to have an evaporation front that moves outward through the envelope as the luminosity increases. HCOOH should thus continuously freshly evaporate from icy grains. The second possibility of HCOOH destruction in the ice at high temperatures is much more likely and can be tested in the laboratory. The lower gas phase abundance can then be explained by a small fraction of the ice (10-4) that evaporates due to non-thermal desorption mechanisms. The low rotation temperatures of 40–70 K for most sources in our sample are also consistent with this picture. Finally, it can explain the high HCOOH abundances in shocked regions by e.g. Requena-Torres et al. (2006), where the ice is warmed up and evaporated over much shorter timescales.
The precise formation of HCOOH through surface chemistry still remains a puzzle, however. In Figure 1 the formation mechanisms in the solid state is either through CO or CO2. Laboratory experiments indicate that it only evaporates at very high temperatures ( K) similar to H2O (Collings et al., 2004). This is even the case for HCOOH diluted in CO or CO2 ices (Bisschop et al. in prep.). Keane (2001) predicts the formation of HCOOH through successive atom addition to CO and finds that the HCOOH ice concentration is proportional to the O/O2 ratio. Alternatively, Allen & Robinson (1977) proposed the reaction HCO + OH in the solid state leading to HCOOH. New models by Garrod & Herbst (2006) have HCOOH gas phase abundances that are much higher than found for our sources with most of the HCOOH actually formed in the gas. If this occurs at intermediate temperatures, a fraction of the HCOOH may freeze out on grains. Further laboratory experiments are needed to elucidate the exact formation mechanism for HCOOH.
HNCO and NH2CHO: HNCO formation has been explained by surface chemistry formation and gas phase reactions (Turner et al., 1999; Keane, 2001). Both Turner et al. (1999) and Keane (2001) argue that NH2CHO is formed on grain-surfaces due to its high level of hydrogen saturation. The strong correlation between the two species in Sect. 5.1 suggests they are related. Alternatively, both OCN- and NH2CHO can form in ices due to energetic processes such as UV-irradiation (van Broekhuizen et al., 2004; Muñoz Caro & Schutte, 2003; Allamandola et al., 1999). Van Broekhuizen et al.(2004) conclude that thermal formation of OCN- can, however, also not be ruled out. Concluding, solid state processes appear to be the most likely formation mechanism for both species, whether they involve energetic processing or not.
HCOOCH3 and CH3OCH3: HCOOCH3 and CH3OCH3 were previously thought to form from protonated methanol in the gas phase (Millar et al., 1991). Horn et al. (2004) recently found the barrier for the gas phase formation of HCOOCH3 to be higher than previously anticipated. Moreover, the gas phase routes assume that H2COOCH and (CH3)2OH+ recombine to HCOOCH3 and CH3OCH3 respectively. Measurements by Geppert et al. (2004, 2005) have shown that dissociative recombination of CH3OH mostly results in a three-body break-up instead of its deprotonated counterpart. If this would also be the case for species such as HCOOCH3 and CH3OCH3, they are more likely to be at least partially formed on grain surfaces. The constant abundance ratios between both species and CH3OH also confirm this scenario. Indeed Garrod & Herbst (2006) explain surface formation of HCOOCH3 and CH3OCH3 through reactions of CH3O and HCO radicals, first proposed by Allen & Robinson (1977).
CH3CN, C2H5CN, and CH3CCH: CH3CN can be formed from the fast association reaction CH + HCN and the radiative association reaction of CH3 + CN (Charnley et al., 1992). The abundances in the gas phase for Orion are, however, 10-10 (Charnley et al., 1992) compared to 10-8 in our sources. The relatively high abundances plus their high degree of hydrogenation for C2H5CN and CH3CN imply that they are possibly formed on grain-surfaces. CH3CCH usually has very low rotation temperatures, and its formation is explained in dark and translucent clouds through gas phase ion-molecule or neutral-neutral reactions.
In summary, most species, such as H2CO, CH3OH, C2H5OH, HCOOCH3, and CH3OCH3 probably result from “first generation” chemistry in ices, likely dominated by surface chemistry. This is possibly also true for CH3CN and C2H5CN. CH2CO, CH3CHO, HCOOH and CH3CCH have all been detected in the gas with low rotation temperatures and, for some species, abundances that are orders of magnitude lower than those in ices. Non-thermal desorption of a small fraction of the ice (10-4) is sufficient to explain the abundances in the cold gas phase. For CH2CO, CH3CHO, and HCOOH formation plus destruction in the ice at higher temperature are plausible, but gas phase chemistry cannot be excluded. Models of gas phase reactions are able to accurately reproduce the observed CH3CCH abundances.
7 Summary and Conclusions
We have performed a survey of selected frequency settings for 7 high mass YSOs. The survey was targeted at detecting species thought to be produced by the grain surface chemistry depicted in Fig. 1. Other species such as CH3CN, C2H5CN, CH3CCH, HCOOCH3 and CH3OCH3 have also been detected. To compare abundances between sources, the source luminosity and 850 m dust emission was used to constrain the radius within which K and the column density out to this radius, . The main conclusion derived in this work are:
-
•
Most detected molecules have similar rotation temperatures for all sources. The following molecules can be classified as cold (100 K): CH2CO, CH3CHO, HCOOH, and CH3CCH; and the following as hot (100 K): H2CO, CH3OH, C2H5OH, HNCO, NH2CHO, CH3CN, C2H5CN, HCOOCH3, and CH3OCH3.
-
•
Groups of molecules have their highest column densities for the same sources. This is the case for the oxygen-bearing species H2CO, CH3OH, C2H5OH, HCOOCH3 and CH3OCH3. HNCO and NH2CHO have their highest column in other sources than the oxygen-bearing species, but both are highest for the same sources. Due to optical depth effects and a limited number of detections it is difficult to establish the trends for CH3CN and C2H5CN.
-
•
Absolute abundances in the hot regions vary by an order of magnitude. Relative abundances of the oxygen-bearing species and the two nitrogen-bearing species are, however, very constant. The absolute abundances are much higher than can be produced by gas phase chemistry. The constant abundance ratios plus the similar rotation temperatures imply that the oxygen-bearing species, H2CO, CH3OH, C2H5OH, HCOOCH3 and CH3OCH3, as well as the two nitrogen-bearing species, HNCO and NH2CHO, share a common solid state formation scheme. This can be the result of very similar conditions during ice formation or a balance between formation and destruction in the ice. The oxygen-bearing species and the two nitrogen-bearing species are not related, however. The abundances of two cyanides, CH3CN and C2H5CN, are likely due to “first generation” ice chemistry as well.
-
•
CH2CO, CH3CHO, CH3CCH and HCOOH have very low rotation temperatures. The formation of CH2CO, CH3CHO, and HCOOH can be explained by solid state or gas phase reactions. For HCOOH and CH3CHO gas phase abundances are a factor of 104 lower than those observed in the solid state. Solid state formation for these species is thus more likely. A low fraction of non-thermal desorption could be responsible for the low gas phase abundances. Models of ion-molecule reactions in the cold gas phase can, however, also reproduce the abundances of CH2CO and CH3CHO. CH3CCH on the other hand is probably created by cold gas phase chemistry, as its abundance is similar to that found in dark clouds. Interestingly, no cold N-bearing molecules are found.
The abundance correlations and branching ratios determined in this paper are key to understanding chemical relationships between these complex organic molecules and addressing their origins. Future spatially resolved observations with interferometers such as ALMA will make it possible to confirm molecular relations and address the chemical variations within each source. Additional laboratory experiments can explore the pathways to the formation of the most abundant species given these observational constraints of constant abundance ratios. Taken together such studies will be important to fully understand the chemistry of complex organic molecules in star forming regions.
Acknowledgements.
We thank Peter Schilke for supplying the XCLASS program used to calculate line intensities, and Remo Tilanus and Alain Castets for the support for the observations at the JCMT and IRAM respectively. We are also grateful for useful discussions with Steve Doty, Eric Herbst, Miguel Requena-Torres, Floris van der Tak, Xander Tielens, as well as Malcolm Walmsley and an anonymous referee for comments on the paper. Funding was provided by NOVA, the Netherlands Research School for Astronomy and a NWO Spinoza grant. The research of JKJ was supported by NASA Origins Grant NAG5-13050.References
- Allamandola et al. (1999) Allamandola, L. J., Bernstein, M. P., Sandford, S. A., & Walker, R. L. 1999, Space Science Reviews, 90, 219
- Allamandola et al. (1988) Allamandola, L. J., Sandford, S. A., & Valero, G. J. 1988, Icarus, 76, 225
- Allen & Robinson (1977) Allen, M. & Robinson, G. W. 1977, ApJ, 212, 396
- Beltrán et al. (2005) Beltrán, M. T., Cesaroni, R., Neri, R., et al. 2005, A&A, 435, 901
- Bernstein et al. (1995) Bernstein, M. P., Sandford, S. A., Allamandola, L. J., Chang, S., & Scharberg, M. A. 1995, ApJ, 454, 327
- Bisschop et al. (in prep.) Bisschop, S. E., Fuchs, G. W., Boogert, A. C. A., Van Dishoeck, E. F., & Linnartz, H. 2007, in prep.
- Blake et al. (1996) Blake, G. A., Mundy, L. G., Carlstrom, J. E., et al. 1996, ApJ, 472, L49
- Blake et al. (1987) Blake, G. A., Sutton, E. C., Masson, C. R., & Phillips, T. G. 1987, ApJ, 315, 621
- Boogert & Ehrenfreund (2004) Boogert, A. C. A. & Ehrenfreund, P. 2004, in ASP Conf. Ser. 309: Astrophysics of Dust, ed. A. N. Witt, G. C. Clayton, & B. T. Draine, 547–573
- Boonman et al. (2001) Boonman, A. M. S., Stark, R., van der Tak, F. F. S., et al. 2001, ApJ, 553, L63
- Boudin et al. (1998) Boudin, N., Schutte, W. A., & Greenberg, J. M. 1998, A&A, 331, 749
- Brooke et al. (1999) Brooke, T. Y., Sellgren, K., & Geballe, T. R. 1999, ApJ, 517, 883
- Caselli et al. (1993) Caselli, P., Hasegawa, T. I., & Herbst, E. 1993, ApJ, 408, 548
- Cesaroni et al. (2003) Cesaroni, R., Codella, C., Furuya, R. S., & Testi, L. 2003, A&A, 401, 227
- Charnley (1995) Charnley, S. B. 1995, Ap&SS, 224, 251
- Charnley (2001) Charnley, S. B. 2001, ApJ, 562, L99
- Charnley (2004) Charnley, S. B. 2004, Advances in Space Research, 33, 23
- Charnley et al. (1992) Charnley, S. B., Tielens, A. G. G. M., & Millar, T. J. 1992, ApJ, 399, L71
- Churchwell et al. (1990) Churchwell, E., Walmsley, C. M., & Cesaroni, R. 1990, A&AS, 83, 119
- Churchwell et al. (1986) Churchwell, E., Wood, D., Myers, P. C., & Myers, R. V. 1986, ApJ, 305, 405
- Collings et al. (2004) Collings, M. P., Anderson, M. A., Chen, R., et al. 2004, MNRAS, 354, 1133
- Collings et al. (2003) Collings, M. P., Dever, J. W., Fraser, H. J., & McCoustra, M. R. S. 2003, Ap&SS, 285, 633
- Dartois et al. (1999) Dartois, E., Schutte, W., Geballe, T. R., et al. 1999, A&A, 342, L32
- Demyk et al. (1998) Demyk, K., Dartois, E., D’Hendecourt, L., et al. 1998, A&A, 339, 553
- Forster & Caswell (1989) Forster, J. R. & Caswell, J. L. 1989, A&A, 213, 339
- Garrod & Herbst (2006) Garrod, R. T. & Herbst, E. 2006, A&A, 457, 927
- Geppert et al. (2005) Geppert, W. D., Hellberg, F., Österdahl, J., et al. 2005, in IAU Symposium 231, ed. D. C. Lis, G. A. Blake, & E. Herbst, 117–124
- Geppert et al. (2004) Geppert, W. D., Thomas, R., Semaniak, J., et al. 2004, ApJ, 609, 459
- Gerakines et al. (1996) Gerakines, P. A., Schutte, W. A., & Ehrenfreund, P. 1996, A&A, 312, 289
- Gibb et al. (2000a) Gibb, E., Nummelin, A., Irvine, W. M., Whittet, D. C. B., & Bergman, P. 2000a, ApJ, 545, 309
- Gibb et al. (2004) Gibb, E. L., Whittet, D. C. B., Boogert, A. C. A., & Tielens, A. G. G. M. 2004, ApJS, 151, 35
- Gibb et al. (2000b) Gibb, E. L., Whittet, D. C. B., Schutte, W. A., et al. 2000b, ApJ, 536, 347
- Goldsmith & Langer (1999) Goldsmith, P. F. & Langer, W. D. 1999, ApJ, 517, 209
- Gredel et al. (1989) Gredel, R., Lepp, S., Dalgarno, A., & Herbst, E. 1989, ApJ, 347, 289
- Grim & Greenberg (1987) Grim, R. J. A. & Greenberg, J. M. 1987, ApJ, 321, L91
- Grim et al. (1989) Grim, R. J. A., Greenberg, J. M., de Groot, M. S., et al. 1989, A&AS, 78, 161
- Hagen et al. (1979) Hagen, W., Allamandola, L. J., & Greenberg, J. M. 1979, Ap&SS, 65, 215
- Hasegawa & Herbst (1993) Hasegawa, T. I. & Herbst, E. 1993, MNRAS, 263, 589
- Hatchell et al. (1998) Hatchell, J., Thompson, M. A., Millar, T. J., & MacDonald, G. H. 1998, A&AS, 133, 29
- Hatchell & van der Tak (2003) Hatchell, J. & van der Tak, F. F. S. 2003, A&A, 409, 589
- Helmich & van Dishoeck (1997) Helmich, F. P. & van Dishoeck, E. F. 1997, A&AS, 124, 205
- Herbst (2005) Herbst, E. 2005, in The Dusty and Molecular Universe: A Prelude to Herschel and ALMA, ed. A. Wilson, 205–210
- Herbst & Leung (1989) Herbst, E. & Leung, C. M. 1989, ApJS, 69, 271
- Hiraoka et al. (2002) Hiraoka, K., Sato, T., Sato, S., et al. 2002, ApJ, 577, 265
- Horn et al. (2004) Horn, A., Møllendal, H., Sekiguchi, O., et al. 2004, ApJ, 611, 605
- Ikeda et al. (2001) Ikeda, M., Ohishi, M., Nummelin, A., et al. 2001, ApJ, 560, 792
- Ikeda et al. (2002) Ikeda, M., Ohishi, M., Nummelin, A., et al. 2002, ApJ, 571, 560
- Ivezić et al. (1999) Ivezić, Ž., Nenkova, M., & Elitzur, M. 1999, User Manual for DUSTY, University of Kentucky Internal Report
- Jørgensen et al. (2002) Jørgensen, J. K., Schöier, F. L., & van Dishoeck, E. F. 2002, A&A, 389, 908
- Keane (2001) Keane, J. V. 2001, PhD thesis, Rijks Universiteit Groningen
- Keane et al. (2001) Keane, J. V., Tielens, A. G. G. M., Boogert, A. C. A., Schutte, W. A., & Whittet, D. C. B. 2001, A&A, 376, 254
- Knez et al. (2005) Knez, C., Boogert, A. C. A., Pontoppidan, K. M., et al. 2005, ApJ, 635, L145
- Lee et al. (1996) Lee, H.-H., Herbst, E., Pineau des Forets, G., Roueff, E., & Le Bourlot, J. 1996, A&A, 311, 690
- Léger et al. (1985) Léger, A., Jura, M., & Omont, A. 1985, A&A, 144, 147
- Liu (2005) Liu, S.-Y. 2005, in IAU Symposium 231, ed. D. C. Lis, G. A. Blake, & E. Herbst, 217–226
- MacDonald et al. (1996) MacDonald, G. H., Gibb, A. G., Habing, R. J., & Millar, T. J. 1996, A&AS, 119, 333
- Millar (1996) Millar, T. J. 1996, in IAU Symp. 178: Molecules in Astrophysics: Probes & Processes, ed. E. F. van Dishoeck, 75–88
- Millar et al. (1991) Millar, T. J., Herbst, E., & Charnley, S. B. 1991, ApJ, 369, 147
- Millar & Nejad (1985) Millar, T. J. & Nejad, L. A. M. 1985, MNRAS, 217, 507
- Moore & Hudson (2000) Moore, M. H. & Hudson, R. L. 2000, Icarus, 145, 282
- Muñoz Caro & Schutte (2003) Muñoz Caro, G. M. & Schutte, W. A. 2003, A&A, 412, 121
- Mueller et al. (2002) Mueller, K. E., Shirley, Y. L., Evans, N. J., & Jacobson, H. R. 2002, ApJS, 143, 469
- Nummelin et al. (2000) Nummelin, A., Bergman, P., Hjalmarson, Å., et al. 2000, ApJS, 128, 213
- Pankonin et al. (2001) Pankonin, V., Churchwell, E., Watson, C., & Bieging, J. H. 2001, ApJ, 558, 194
- Pendleton et al. (1999) Pendleton, Y. J., Tielens, A. G. G. M., Tokunaga, A. T., & Bernstein, M. P. 1999, ApJ, 513, 294
- Pontoppidan et al. (2003) Pontoppidan, K. M., Fraser, H. J., Dartois, E., et al. 2003, A&A, 408, 981
- Pontoppidan et al. (2004) Pontoppidan, K. M., van Dishoeck, E. F., & Dartois, E. 2004, A&A, 426, 925
- Requena-Torres et al. (2006) Requena-Torres, M. A., Martín-Pintado, J., Rodríguez-Franco, A., et al. 2006, A&A, 455, 971
- Rodgers & Charnley (2003) Rodgers, S. D. & Charnley, S. B. 2003, ApJ, 585, 355
- Sandford & Allamandola (1993) Sandford, S. A. & Allamandola, L. J. 1993, ApJ, 417, 815
- Schilke et al. (2001) Schilke, P., Benford, D. J., Hunter, T. R., Lis, D. C., & Phillips, T. G. 2001, ApJS, 132, 281
- Schilke et al. (1997) Schilke, P., Groesbeck, T. D., Blake, G. A., & Phillips, T. G. 1997, ApJS, 108, 301
- Schutte et al. (1999) Schutte, W. A., Boogert, A. C. A., Tielens, A. G. G. M., et al. 1999, A&A, 343, 966
- Sutton et al. (1985) Sutton, E. C., Blake, G. A., Masson, C. R., & Phillips, T. G. 1985, ApJS, 58, 341
- Sutton et al. (1995) Sutton, E. C., Peng, R., Danchi, W. C., et al. 1995, ApJS, 97, 455
- Thi et al. (2006) Thi, W.-F., van Dishoeck, E. F., Dartois, E., et al. 2006, A&A, 449, 251
- Tielens & Charnley (1997) Tielens, A. G. G. M. & Charnley, S. B. 1997, Origins of Life and Evolution of the Biosphere, 27, 23
- Tielens & Hagen (1982) Tielens, A. G. G. M. & Hagen, W. 1982, A&A, 114, 245
- Turner et al. (1999) Turner, B. E., Terzieva, R., & Herbst, E. 1999, ApJ, 518, 699
- van Broekhuizen et al. (2004) van Broekhuizen, F. A., Keane, J. V., & Schutte, W. A. 2004, A&A, 415, 425
- van Broekhuizen et al. (2005) van Broekhuizen, F. A., Pontoppidan, K. M., Fraser, H. J., & van Dishoeck, E. F. 2005, A&A, 441, 249
- van der Tak et al. (2000) van der Tak, F. F. S., van Dishoeck, E. F., Evans, N. J., & Blake, G. A. 2000, ApJ, 537, 283
- Viti et al. (2004) Viti, S., Collings, M. P., Dever, J. W., McCoustra, M. R. S., & Williams, D. A. 2004, MNRAS, 354, 1141
- Watanabe et al. (2004) Watanabe, N., Nagaoka, A., Shiraki, T., & Kouchi, A. 2004, ApJ, 616, 638
- Whittet et al. (2001) Whittet, D. C. B., Pendleton, Y. J., Gibb, E. L., et al. 2001, ApJ, 550, 793
- Wilson & Rood (1994) Wilson, T. L. & Rood, R. 1994, ARA&A, 32, 191
- Wyrowski et al. (1999) Wyrowski, F., Schilke, P., Walmsley, C. M., & Menten, K. M. 1999, ApJ, 514, L43
- Zhang (2005) Zhang, Q. 2005, in IAU Symposium 227, ed. R. Cesaroni, M. Felli, E. Churchwell, & M. Walmsley, 135–144
- Zinchenko et al. (2000) Zinchenko, I., Henkel, C., & Mao, R. Q. 2000, A&A, 361, 1079
Appendix A Rotation diagrams per molecule for all sources

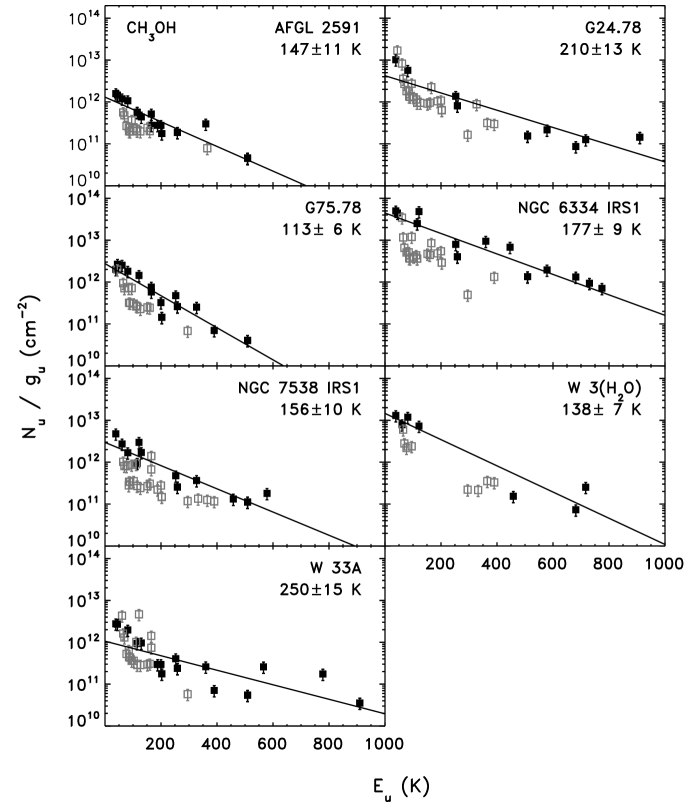
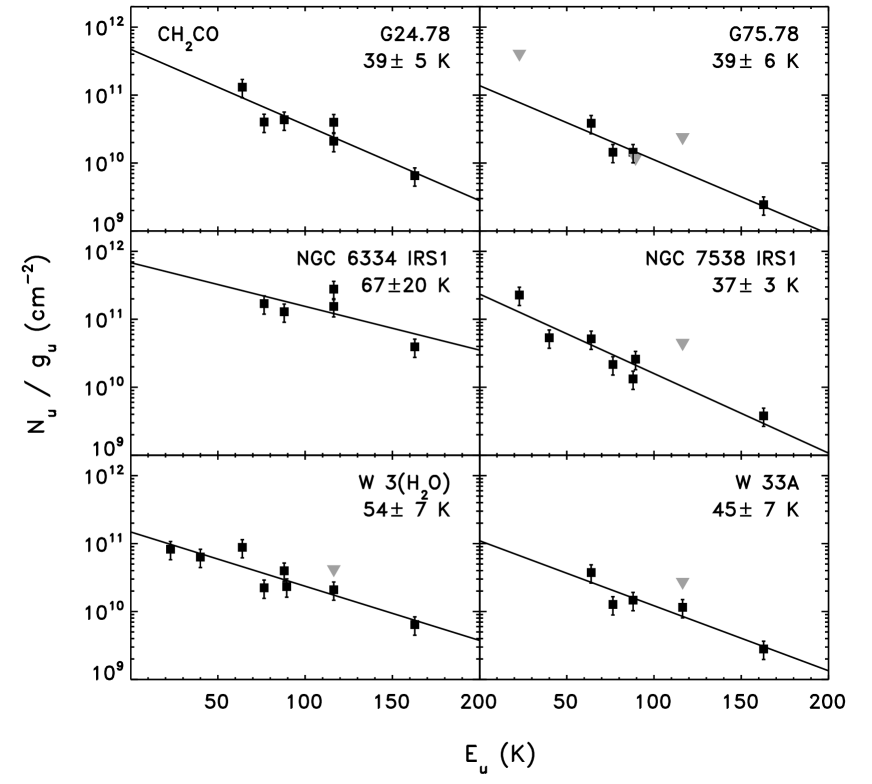

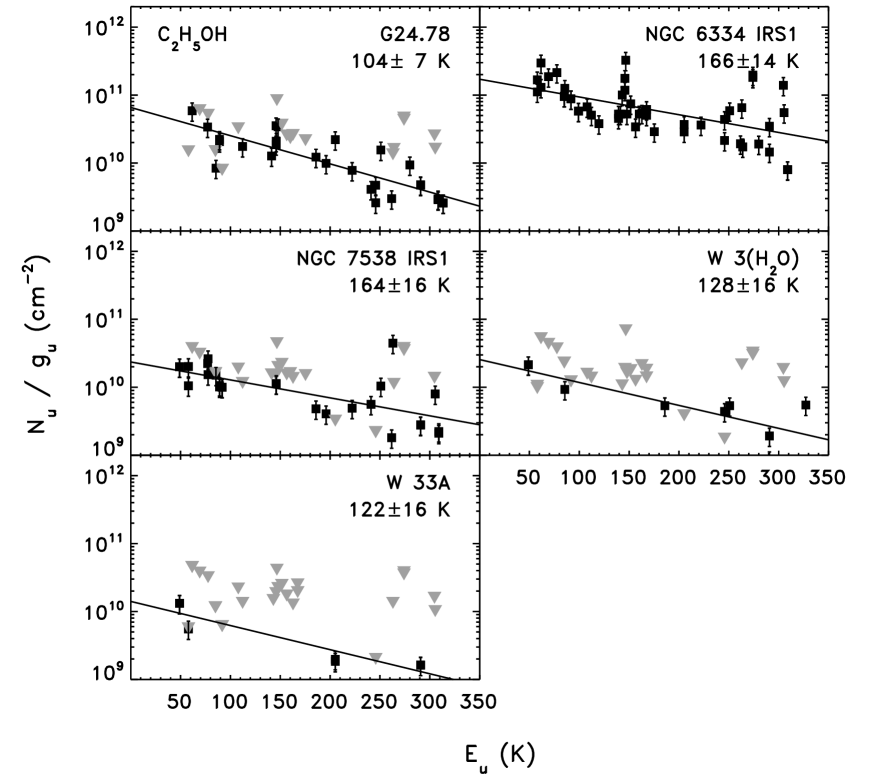
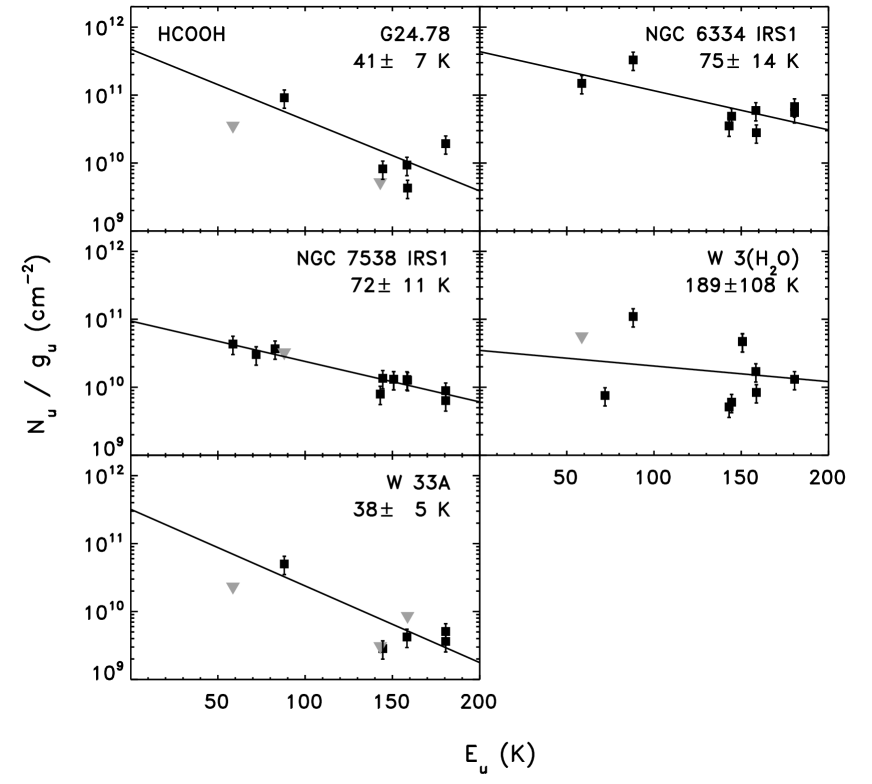
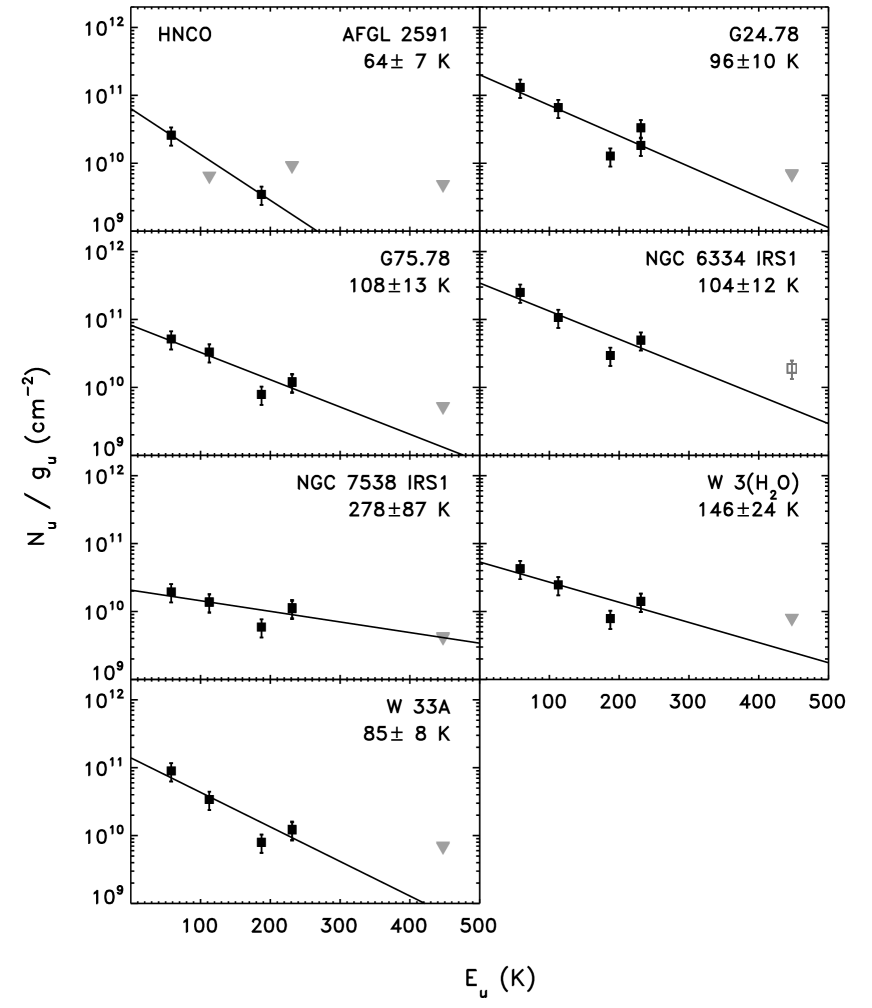
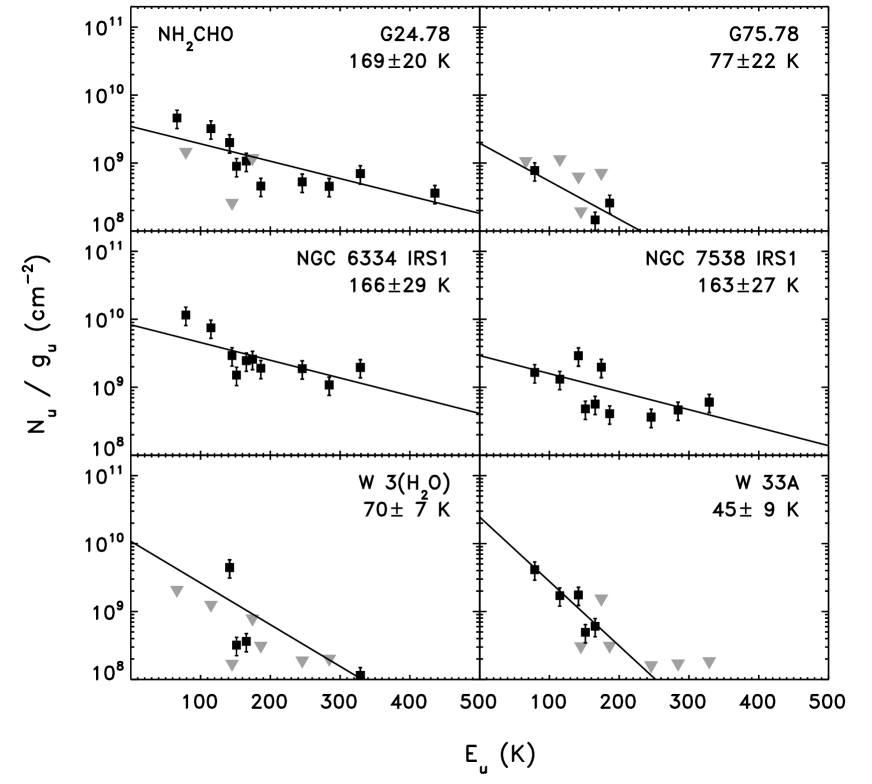
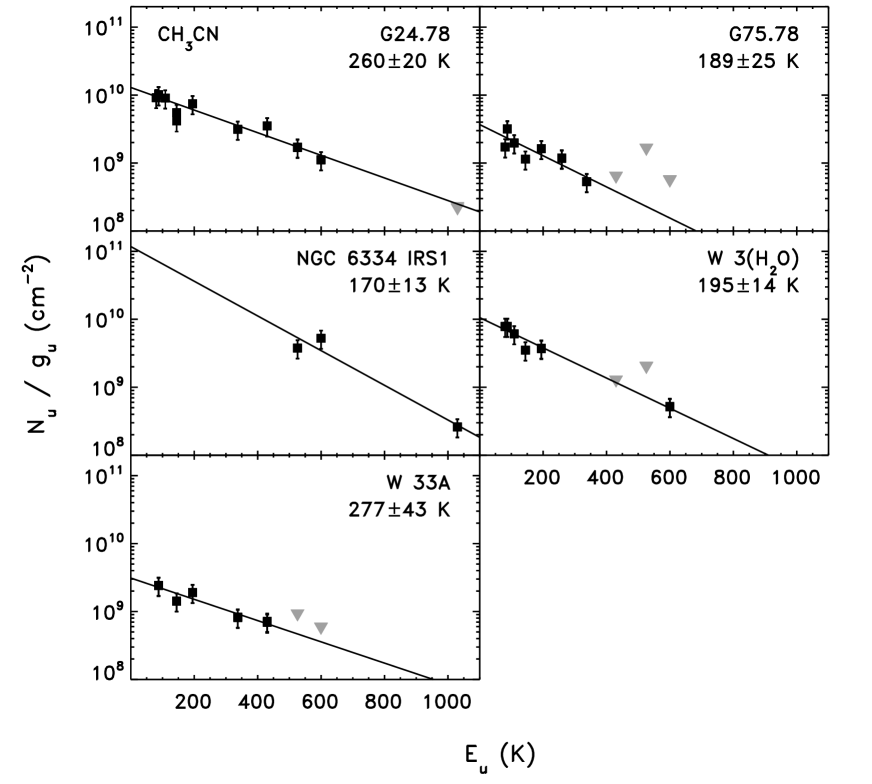
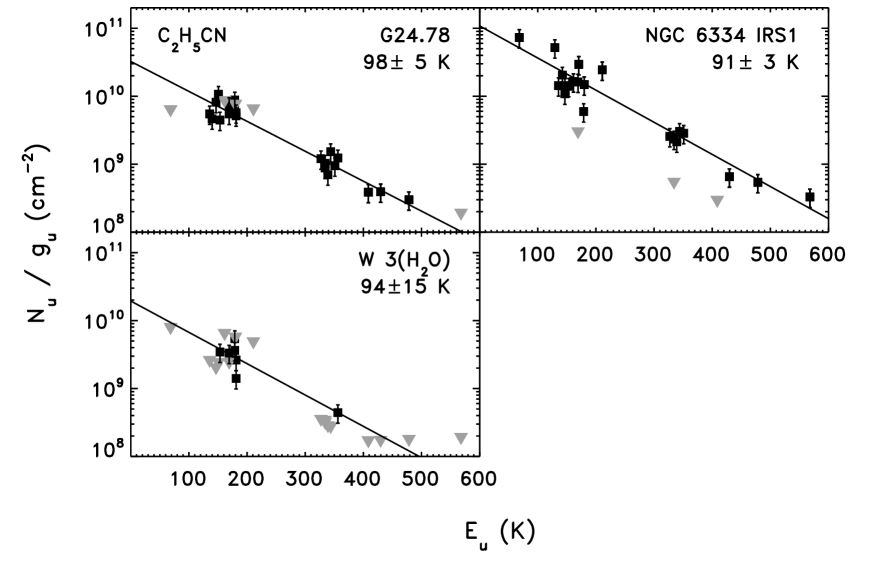
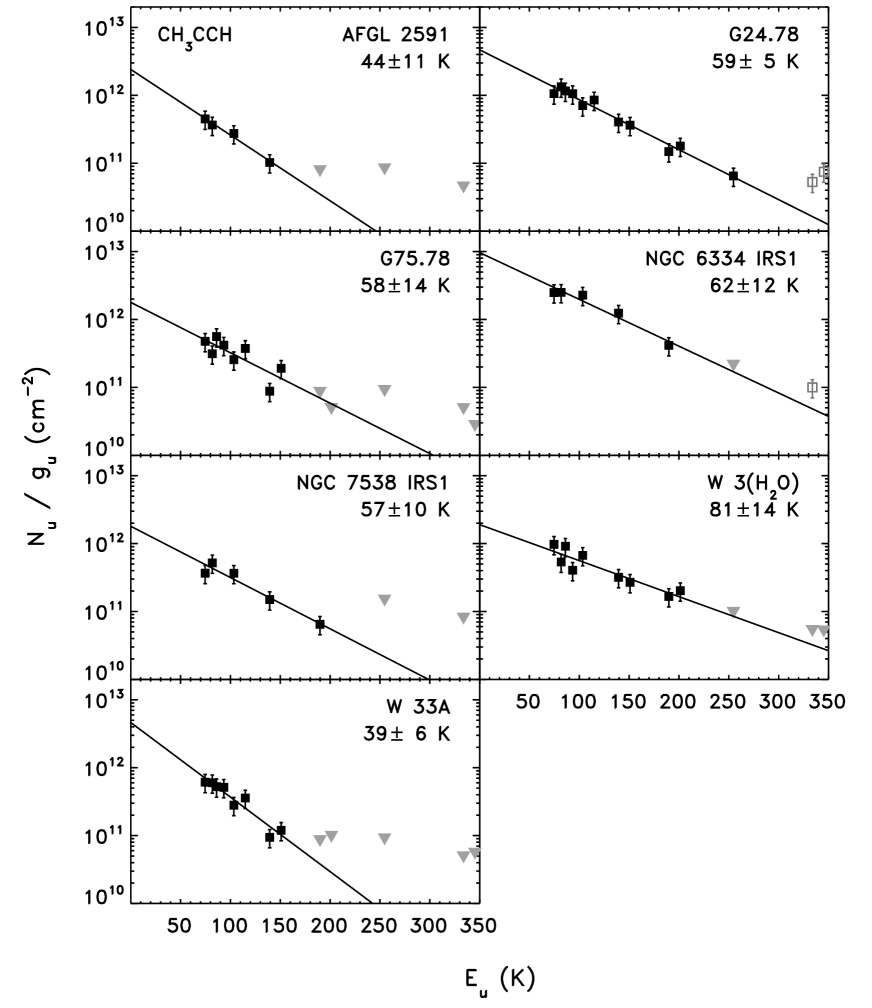
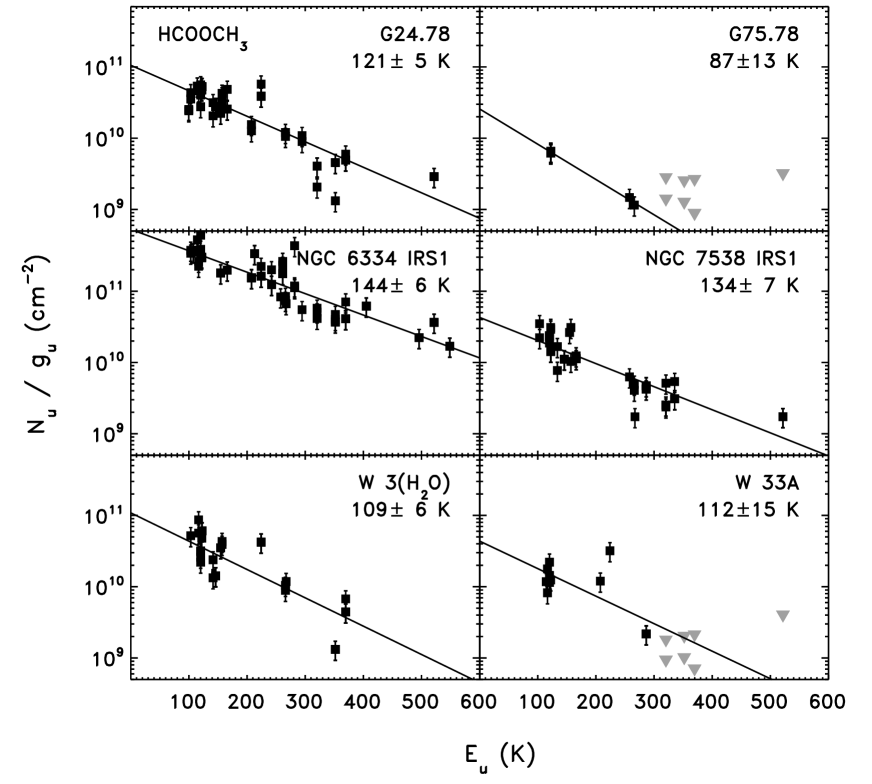
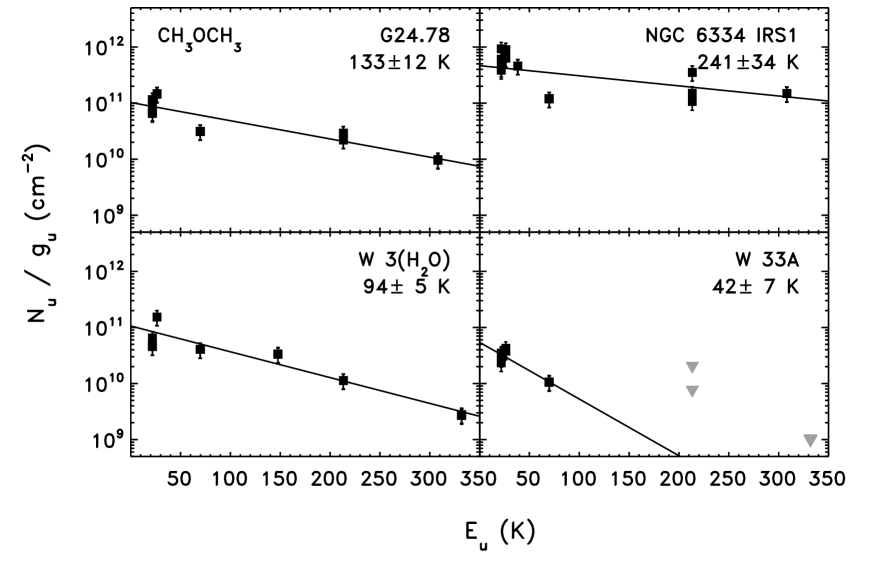
Appendix B Detected lines per species for all sources
| Frequency | Transition | Sources | ||||||
|---|---|---|---|---|---|---|---|---|
| [GHz] | AFGL 2591 | G24.78 | G75.78 | NGC 6334 IRS1 | NGC 7538 IRS1 | W 3(H2O) | W 33A | |
| H2CO | ||||||||
| 218.222 | 30,3– 20,2 | – | 17 | 14 | – | – | – | – |
| 218.476 | 32,2– 22,1 | – | 5.6 | 3.3 | – | – | – | – |
| 225.698 | 31,2– 21,1 | 15 | 27 | 22 | 57 | 31 | 34 | 22 |
| 363.946 | 52,4– 42,3 | – | 15 | 5.9 | – | – | – | – |
| 364.103 | 54,1/2– 44,0/1 | – | 7.3 | 2.7 | – | – | – | – |
| 364.275 | 53,3– 43,2 | – | 16 | 7.5 | – | – | – | – |
| 364.289 | 53,2– 43,1 | – | 18 | 7.9 | – | – | – | – |
| HCO | ||||||||
| 219.909 | 31,2– 21,1 | 0.41 | 2.9 | 1.0 | 8.8 | 0.84 | 1.1 | 1.6 |
| 356.176 | 52,3– 42,2 | 0.36 | 2.4 | 0.55 | 6.3 | 0.41 | 0.96 | 0.92 |
| H2C18O | ||||||||
| 348.032 | 52,3– 42,2 | 0.15 | 0.85 | 0.32 | 2.6 | 0.26 | 0.32 | 0.26 |
– means frequency not observed.
| Frequency | Transition | Sources | ||||||
|---|---|---|---|---|---|---|---|---|
| [GHz] | AFGL 2591 | G24.78 | G75.78 | NGC 6334 IRS1 | NGC 7538 IRS1 | W3(H2O) | W33A | |
| CH3OH | ||||||||
| 218.440 | 43,1,0– 32,1,0 | – | 12.5 | 3.0 | – | – | – | – |
| 219.994 | 2314,9,0– 2214,8,0 | 0.36 | 0.49 | 0.26 | 2.0 | 0.32 | 0.47 | 0.41 |
| 220.079 | 84,4,0– 74,3,0 | 0.55 | 4.1 | 1.1 | 18 | 1.3 | 3.6 | 0.54 |
| 227.815 | 169,8,0,1– 159,7,0,1 | – | 2.1 | 0.60 | – | 0.87 | 1.8 | – |
| 229.939 | 1912,7,0,2– 2012,8,0,2 | 0.31 | 0.56 | 0.32 | 5.1 | 0.47 | 0.38 | 0.25 |
| 230.027 | 31,3,0– 42,3,0 | 0.53 | 3.4 | 0.68 | 17 | 1.6 | 4.3 | 0.92 |
| 230.293 | 222200– 213190 | 0.31 | 0.38 | 0.32 | 5.1a | 0.41 | 0.68 | 0.25 |
| 230.369 | 2213,9,0– 2113,8,0 | 0.31 | 0.26 | 0.32 | 4.0 | 0.67 | 0.22 | 0.25 |
| 231.281 | 106,4,0,2– 96,3,0,2 | 0.34 | 7.6b | 0.93 | 13 | 0.82 | 4.5 | 1.7 |
| 232.417 | 106,4,0,1– 96,3,0,1 | 0.64 | 2.8 | 0.72 | 10 | 0.38 | – | 0.94 |
| 232.784 | 1811,8,0,1– 1711,7,0,1 | – | – | – | 17 | – | – | – |
| 232.927 | 14681– 14771 | – | – | – | 1.7 | – | – | – |
| 232.946 | 10470– 11570 | – | – | – | 16 | – | – | – |
| 233.097 | 13671– 13761 | – | – | – | 0.83 | – | – | – |
| 234.683 | 43,1,0,2– 53,2,0,2 | 0.62 | 4.3 | 1.3 | 18 | 1.4 | 4.1 | 2.2 |
| 234.698 | 51,5,0– 62,5,0,5 | 0.24 | 0.36 | 0.31 | 10 | 0.64 | 1.6 | 1.0 |
| 240.242 | 54,1,0– 64,2,0,5 | 0.50 | 3.7 | 0.85 | 12 | 0.79 | 5.6 | 0.92 |
| 240.741 | 263,23,0– 262,24,0 | 0.25 | 0.66 | 0.3 | 4.8 | 0.47 | 0.33 | 0.20 |
| 240.960 | 53,2,1,1– 43,2,1,1c | 0.54 | 3.0d | 0.61 | 17 | 1.1 | 3.4 | 0.94 |
| 241.043 | 226,16,0– 235,18,0 | 0.25 | 0.40 | 0.3 | 2.6 | 0.45 | 0.54 | 0.26 |
| 241.057 | 93,6,0– 100,10,0 | 0.25 | 0.40 | 0.3 | 3.3 | 0.35 | 0.54 | 0.26 |
| 248.282 | 1710,7,0,2– 1710,8,0,1 | – | – | – | – | 0.35 | 3.0 | – |
| 248.885 | 1610,7,0,2– 169,7,0,1 | 0.60 | 2.4 | 0.87 | – | 0.96 | 2.7 | 0.20 |
| 13CH3OH | ||||||||
| 220.363 | 173150– 180180 | 0.19 | 0.15 | 0.36 | 1.3 | 0.30 | 0.46 | 0.19 |
| 223.332 | 64,3,1,2– 75,3,1,2 | 0.25 | – | – | 1.3 | 0.36 | – | – |
| 225.571 | 147,8,0– 136,8,0 | 0.32 | 0.64 | 0.24 | 0.84 | 0.32 | 0.50 | 0.23 |
| 239.169 | 192170– 190190 | – | 0.49 | 0.19 | – | – | 0.38 | 0.29 |
| 241.036 | 220220– 213180 | 0.25 | 0.40 | 0.30 | 0.83 | 0.35 | 0.36 | 0.42 |
– means frequency not observed.
a Blend with HCOOCH3.
b Blend with CH3CN.
c Blend with 52,3,2– 42,3,2.
d Blend with HCOOCH3.
| Frequency | Transition | Sources | ||||||
|---|---|---|---|---|---|---|---|---|
| [GHz] | AFGL 2591 | G24.78 | G75.78 | NGC 6334 IRS1 | NGC 7538 IRS1 | W3(H2O) | W33A | |
| CH3OH continued | ||||||||
| 337.969 | 74,3,1,2– 64,3,1,2 | 0.48 | 3.2 | 0.76 | 14 | 1.3 | 3.6 | 0.77 |
| 338.125 | 74,4,0– 63,3,0 | 2.9 | 20 | 4.7 | 56 | 5.9 | 24 | 5.8 |
| 338.345 | 73,4,0– 63,4,0 | 3.9 | 35 | 7.7 | 71 | 8.1 | 30 | 11 |
| 338.409 | 74,4,0,1– 63,3,0,1 | 3.9 | 39 | 7.9 | 59 | – | 66 | 11 |
| 338.431 | 71,7,0– 60,6,0 | – | 4.0 | 0.84 | – | – | – | – |
| 338.442 | 77,1,0,1/2– 66,0,0,1/2 | – | 4.7 | 1.4 | – | – | – | – |
| 338.456 | 71,6,0– 61,6,0 | – | 5.6 | 1.5 | – | – | – | – |
| 338.475 | 76,1,0– 66,1,0 | – | 5.9 | 1.8 | – | – | – | – |
| 338.486 | 76,1,0,1/2– 66,1,0,1/2 | – | 6.9 | 1.6 | – | – | – | – |
| 338.504 | 72,6,0– 61,5,0 | – | 6.8 | 1.9 | – | – | – | – |
| 338.513 | 75,3,0,2– 6 | – | 14 | 3.3 | – | – | – | – |
| 338.530 | 76,2,0– 65,1,0 | – | 7.2 | 1.8 | – | – | – | – |
| 338.542 | 75,2,0,1/2– 65,2,0,1 | – | 17 | 4.7 | – | – | – | – |
| 338.560 | 72,5,0– 62,5,0 | – | 8.6 | 2.1 | – | – | – | – |
| 338.583 | 75,2,0– 65,2,0 | – | 10 | 2.5 | – | – | – | – |
| 338.615 | 74,3,0– 64,3,0 | – | 20 | 8.0 | – | – | – | – |
| 338.640 | 75,3,0,1– 64,2,0,1 | – | 13 | 3.1 | – | – | – | – |
| 338.722 | 73/5,5/3,0– 62/4,4/2,0 | – | 27 | 6.5 | – | – | – | – |
| 340.141 | 22,0,0,1– 32,1,0,1 | 0.89 | 5.6 | 1.6 | 27 | 3.2 | 4.1 | 1.7 |
| 340.394 | 1611,5,0,1/2– 1711,6,0,1/2 | 0.65 | 2.2 | 0.58 | 19 | 1.6 | 1.1 | 0.78 |
| 355.964 | 1610,7,1– 169,7,1 | 0.29 | 0.47 | 0.53 | 5.6 | 0.41 | 0.43 | 0.68 |
| 356.007 | 158,7,0,2– 158,8,0,1 | 2.4 | 9.5 | 3.9 | 29 | 6.8 | 13 | 3.4 |
| 13CH3OH | ||||||||
| 345.084 | 22,0,0,1– 32,1,0,1 | 0.23 | 0.26 | 0.30 | 4.1 | 0.33 | 0.29 | 0.19 |
| 348.101 | 116,6,0– 106,5,0 | 0.18 | 2.0 | 0.27 | 10.0 | 0.61 | 0.44 | 0.19 |
– means frequency not observed.
a Blend with 76,2,0,1/2– 65,1,0,1/2.
| Frequency | Transition | Sources | ||||||
|---|---|---|---|---|---|---|---|---|
| [GHz] | AFGL 2591 | G24.78 | G75.78 | NGC 6334 IRS1 | NGC 7538 IRS1 | W3(H2O) | W33A | |
| 81.586 | 41,3– 31,2 | 0.32 | – | 0.75 | – | 0.45 | 0.16 | – |
| 140.127 | 71,7– 61,6 | – | – | – | – | 0.72 | 0.85 | – |
| 244.712 | 121,11– 111,10 | 0.39 | – | 0.78 | – | 1.8 | 1.6 | – |
| 262.619 | 132,12– 122,11 | 0.33 | – | 0.47 | – | 1.7 | 1.5 | – |
| 220.178 | 111,11– 101,10 | 0.19 | 1.2 | 0.41 | 5.0 | 0.63 | 0.65 | 0.37 |
| 222.199a | 110,11– 100,10 | 0.31 | 1.3 | 0.38 | 5.9 | 0.51 | 0.87 | 0.37 |
| 222.229 | 112,10– 102,9 | 0.31 | 0.38 | 0.22 | 2.7 | 0.41 | 0.20 | 0.11 |
| 222.315 | 112,9– 102,8 | 0.31 | 0.20 | 0.22 | 1.5 | 0.41 | 0.35 | 0.25 |
| 240.187 | 121,12– 111,11 | 0.24 | 1.5 | 0.50 | 4.5 | 0.46 | 1.4 | 0.51 |
| 346.600 | 171,16– 161,15 | 0.26 | 1.4 | 0.52 | 8.4 | 0.81 | 1.4 | 0.60 |
– means frequency not observed.
a Blend of lines 11011 – 10010, 1139 – 1038, and 1138– 1037.
| Frequency | Transition | Sources | ||||||
|---|---|---|---|---|---|---|---|---|
| [GHz] | AFGL 2591 | G24.78 | G75.78 | NGC 6334 IRS1 | NGC 7538 IRS1 | W3(H2O) | W33A | |
| 98.901 | 51,4– 41,3 | 0.29 | – | 0.14 | – | 0.22 | 0.38 | – |
| 112.249 | 61,6– 51,5 | – | – | – | – | 0.40 | 0.50 | – |
| 149.507 | 81,8– 71,7 | 0.15 | – | 0.36 | – | 0.69 | 0.54 | – |
| 168.093 | 91,9– 81,8 | 0.21 | – | 0.30 | – | 0.30 | 0.48 | – |
– means frequency not observed.
| Frequency | Transition | Sources | ||||||
|---|---|---|---|---|---|---|---|---|
| [GHz] | AFGL 2591 | G24.78 | G75.78 | NGC 6334 IRS1 | NGC 7538 IRS1 | W3(H2O) | W33A | |
| 220.155 | 243,22,2– 242,23,2 | 0.24 | 0.38 | 0.36 | 1.1 | 0.78 | 0.39 | 0.24 |
| 222.138 | 197,13/12,0– 187,11/12,1 | 0.39 | 0.43 | 0.32 | 1.6 | 0.32 | 0.27 | 0.32 |
| 225.279 | 135,9,1– 125,8,1 | 0.41 | 0.43 | 0.24 | 0.57 | 0.26 | 0.21 | 0.29 |
| 225.283 | 135,8,1– 125,7,1 | 0.41 | 0.43 | 0.24 | 0.9 | 0.26 | 0.21 | 0.29 |
| 225.457 | 133,11,1– 123,10,1 | 0.41 | 0.43 | 0.24 | 0.66 | 0.26 | 0.21 | 0.29 |
| 225.546 | 134,10,1– 124,9,1 | 0.41 | 0.43 | 0.24 | 0.56 | 0.26 | 0.21 | 0.29 |
| 225.560 | 133,11,0– 123,10,0 | 0.41 | 0.43 | 0.24 | 1.9 | 0.26 | 0.21 | 0.29 |
| 225.660 | 134,10,0– 124,9,0 | 0.41 | 0.43 | 0.24 | 0.85 | 0.26 | 0.21 | 0.29 |
| 226.581 | 262,24,2– 261,25,2 | 0.30 | 0.48 | 0.21 | 2.6 | 0.26 | 0.35 | 0.30 |
| 230.954 | 165,11,2– 164,12,2 | 0.32 | 0.59 | 0.21 | 2.9 | 0.29 | 0.32 | 0.42 |
| 230.991 | 140,14,2– 131,13,2 | 0.32 | 0.19 | 0.21 | 2.8 | 0.34 | 0.21 | 0.42 |
| 232.035 | 185,14,2– 184,15,2 | 0.30 | 0.43 | 0.26 | 0.56 | 0.30 | – | 0.41 |
| 232.319 | 235,19,2– 234,20,2 | 0.30 | 0.43 | 0.26 | 0.45 | 0.30 | – | 0.41 |
| 232.405 | 175,13,2– 174,14,2 | 0.30 | 0.43 | 0.26 | 0.95 | 0.30 | – | 0.41 |
| 232.491 | 140,14,0– 130,13,0 | 0.30 | 0.24 | 0.26 | 0.99 | 0.30 | – | 0.41 |
| 232.809 | 165,12,2– 164,13,2 | – | – | 0.30 | 2.0 | – | – | – |
| 232.929 | 145,9,2– 144,10,2 | – | – | 0.30 | 0.54 | – | – | – |
| 233.571 | 135,8,2– 134,9,2 | 0.41 | 0.43 | 0.24 | 0.87 | 0.25 | 0.21 | 0.29 |
| 234.524 | 255,21,2– 254,22,2 | 0.30 | 0.48 | 0.21 | 1.6 | 0.23 | 0.35 | 0.30 |
| 234.666 | 105,5,2– 104,6,2 | 0.30 | 0.48 | 0.21 | 0.62 | 0.24 | 0.35 | 0.30 |
| 234.715 | 105,6,2– 104,7,2 | 0.30 | 0.48 | 0.21 | 2.0 | 0.14 | 0.35 | 0.30 |
| 234.853 | 95,4,2– 94,5,2 | 0.30 | 0.48 | 0.21 | 1.5 | 0.25 | 0.35 | 0.30 |
| 234.984 | 85,3,2– 84,4,2 | 0.30 | 0.48 | 0.21 | 0.84 | 0.25 | 0.35 | 0.30 |
| 234.992 | 85,4,2– 84,5,2 | 0.30 | 0.38 | 0.21 | 1.9 | 0.25 | 0.35 | 0.30 |
| 240.110 | 272,25,2– 271,26,2 | 0.30 | 0.36 | 0.26 | 0.72 | 0.30 | 0.16 | 0.41 |
| 240.782 | 152,13,0– 141,13,1 | 0.32 | 0.53 | 0.30 | 1.1 | 0.28 | 0.45 | 0.26 |
| 240.839 | 141,13,0– 131,13,1 | 0.32 | 0.53 | 0.30 | 2.0 | 0.28 | 0.45 | 0.26 |
| 338.099 | 187,11,2– 186,12,2 | 0.30 | 1.7 | 0.20 | 2.8 | 0.25 | 0.30 | 0.14 |
| 338.110 | 187,12,2– 186,13,2 | 0.30 | 0.29 | 0.20 | 2.2 | 0.25 | 0.30 | 0.15 |
| 338.163 | 102,8,1– 91,8,0 | 0.30 | 0.37 | 0.20 | 1.1 | 0.25 | 0.30 | 0.29 |
| 339.511 | 97,3/2,2– 96,4/3,2 | 0.30 | 0.64 | 0.21 | 1.3 | 0.28 | 0.39 | 0.21 |
| 339.544 | 87,2/1,2– 86,3/2,2 | 0.30 | 0.26 | 0.21 | 2.8 | 0.32 | 0.39 | 0.21 |
| 339.566 | 77,0/1,2– 76,1/2,2 | 0.30 | 0.26 | 0.21 | 1.6 | 0.28 | 0.39 | 0.21 |
| 339.979 | 94,6,2– 83,5,2 | 0.30 | 1.2 | 0.21 | 6.1 | 0.73 | 0.39 | 0.21 |
| 340.189 | 65,1/2,2– 54,2/1,2 | 0.36 | 3.4 | 0.68 | 15 | 1.6 | 1.7 | 1.1 |
| 340.420 | 94,5,2– 83,6,2 | 0.36 | 0.55 | 0.26 | 4.0 | 0.38 | 0.36 | 0.78 |
| 345.173 | 77,0/1,0– 66,0/1,1 | 0.29 | 0.43 | 0.30 | 2.4 | 0.26 | 0.21 | 0.24 |
| 345.295 | 211,21,1– 201,20,1 | 0.29 | 0.55 | 0.30 | 2.5 | 0.26 | 0.21 | 0.24 |
| 345.408 | 210,21,1– 200,20,1 | 0.29 | 0.30 | 0.30 | 5.1 | 0.26 | 0.51 | 0.24 |
| 346.620 | 208,12/13,0– 198,11/12,0 | 0.26 | 0.10 | 0.36 | 1.3 | 0.34 | 0.32 | 0.23 |
| 346.817 | 207,13/14,0– 197,12/13,0 | 0.26 | 0.82 | 0.36 | 3.9 | 0.48 | 0.22 | 0.28 |
| 346.929 | 206,15,1– 196,14,1 | 0.26 | 0.71 | 0.36 | 1.4 | 0.19 | 0.32 | 0.23 |
| 346.963 | 210,21,2– 201,20,2 | 0.26 | 2.0 | 0.36 | 4.4a | 0.80 | 0.89 | 0.23 |
| 347.887 | 205,15,0– 195,14,0 | 0.23 | 0.38 | 0.32 | 2.4 | 0.23 | 0.32 | 0.26 |
| 347.916 | 204,17,0– 194,16,0 | 0.23 | 2.1 | 0.32 | 8.1 | 1.4 | 0.74 | 0.26 |
| 347.975 | 222,20,2– 213,19,2 | 0.23 | 0.57 | 0.32 | 2.7 | 0.36 | 0.32 | 0.26 |
| 348.720 | 44,0/1,1– 33,0/1,0 | 0.36 | 0.65 | 0.27 | 0.36 | 0.26 | 0.36 | 0.26 |
| 348.847 | 106,5/4,0– 95,5/4,1 | 0.36 | 0.97 | 0.27 | 0.36 | 0.26 | 0.36 | 0.26 |
| 352.858 | 211,20,2– 202,19,2 | 0.32 | 1.2 | 0.51 | 4.9 | 0.49 | 0.29 | 0.42 |
| 353.035 | 123,9,2– 112,10,2 | 0.32 | 0.97 | 0.51 | 5.2 | 0.64 | 0.58 | 0.42 |
| 363.968 | 217,15/14,1– 207,14/13,1 | – | 0.50 | 0.38 | – | – | – | – |
| 364.233 | 217,15/14,0– 207,14/13,0 | – | 0.57 | 0.38 | – | – | – | – |
– means frequency not observed.
a Blend with C2H5CN.
| Frequency | Transition | Sources | ||||||
|---|---|---|---|---|---|---|---|---|
| [GHz] | AFGL 2591 | G24.78 | G75.78 | NGC 6334 IRS1 | NGC 7538 IRS1 | W3(H2O) | W33A | |
| 223.916 | 102,9– 91,8 | 0.21 | – | 0.17 | – | 0.76 | 0.19 | – |
| 247.514 | 115,6/7– 105,5/6 | – | – | – | – | 0.66 | 2.4 | – |
| 257.975 | 121,12– 111,11 | 0.38 | – | 1.9 | – | 0.89 | 0.95 | – |
| 262.103 | 120,12– 110,11 | – | – | – | – | 0.36 | 1.3 | – |
| 220.038 | 100,10– 90,9 | 0.19 | 0.29 | 0.29 | 1.3 | 0.37 | 0.46 | 0.19 |
| 225.513 | 103,7– 93,6 | 0.32 | 0.73 | 0.19 | 2.6 | 0.25 | 0.88 | 0.40 |
| 338.144 | 154,12– 144,11 | 0.23a | 2.1a | 0.16 | 3.7 | 0.49a | 1.2a | 0.28 |
| 338.202 | 153,13– 143,12 | 0.24 | 0.53 | 0.26 | 3.4 | 0.74 | 0.97 | 0.24 |
| 338.249 | 154,11– 144,10 | 0.24 | 1.1 | 0.16 | 3.1 | 0.35 | 0.72 | 0.20 |
| 345.031 | 160,16– 150,15 | 0.23 | 0.32 | 0.20 | 2.3 | 0.51 | 0.33 | 0.19 |
| 346.719 | 152,13– 142,12 | 0.21 | 0.49 | 0.19 | 2.9 | 0.81 | 0.36 | 0.17 |
| 356.137 | 162,15– 152,14 | 0.65 | 0.28 | 0.34 | 1.8 | 0.83 | 0.55 | 0.54 |
– means frequency not observed.
a Blend with C2H5CN.
| Frequency | Transition | Sources | ||||||
|---|---|---|---|---|---|---|---|---|
| [GHz] | AFGL 2591 | G24.78 | G75.78 | NGC 6334 IRS1 | NGC 7538 IRS1 | W3(H2O) | W33A | |
| HNCO | ||||||||
| 219.656 | 103,7/8– 93,6/7 | 0.29 | 0.41 | 0.31 | 1.2 | 0.25 | 0.47 | 0.41 |
| 219.734 | 102,9– 92,8 | 0.29 | 0.59 | 0.77 | 3.2 | 0.72 | 0.90 | 0.78 |
| 219.737 | 102,8– 92,7 | 0.29 | 1.1 | a | a | a | a | a |
| 219.798 | 100,10–90,9 | 0.88 | 4.4 | 1.7 | 8.4 | 0.65 | 1.4 | 3.0 |
| 240.876 | 111,11– 101,10 | 0.25 | 2.7 | 1.3 | 4.3 | 0.55 | 0.99 | 1.4 |
| 352.898 | 161,15– 151,14 | 0.89 | 3.3 | 2.0 | 7.7 | 1.5 | 2.0 | 2.1 |
| HN13CO | ||||||||
| 219.803 | 102,9– 92,8 | 0.36 | 0.41 | 0.26 | 0.98 | 0.32 | 0.39 | 0.41 |
| 240.881 | 111,11– 101,10 | 0.25 | 0.46 | 0.36 | 0.41 | 0.28 | 0.54 | 0.26 |
– means frequency not observed.
a Blend with HNCO line at 219734 MHz.
| Frequency | Transition | Sources | ||||||
|---|---|---|---|---|---|---|---|---|
| [GHz] | AFGL 2591 | G24.78 | G75.78 | NGC 6334 IRS1 | NGC 7538 IRS1 | W3(H2O) | W33A | |
| 227.606 | 110,11– 100,10 | – | 0.90 | 0.20 | – | a | 0.39 | – |
| 232.274 | 112,10– 102,9 | 0.5 | 0.27 | 0.15 | 2.2 | 0.32 | – | 0.60 |
| 233.529 | 116,5/6– 106,4/5 | 0.15 | 0.32 | 0.19 | 0.73 | 0.56 | 0.21 | 0.42 |
| 233.595 | 115,6/7– 105,5/6 | 0.15 | 0.64 | 0.19 | b | 0.93 | 1.4 | 0.56 |
| 233.736 | 114,8– 104,7 | 0.15 | 0.56 | 0.19 | 1.3 | 0.23 | 0.21 | 0.30 |
| 339.716 | 168,8/9– 158,7/8 | 0.3 | 1.3 | 0.17 | 3.8 | 1.2 | 0.22 | 0.34 |
| 339.780 | 167,9/10– 157,8/9 | 0.3 | 0.93 | 0.17 | 2.2 | 0.95 | 0.39 | 0.34 |
| 339.904 | 166,10/11– 156,9/10 | 0.3 | 1.2 | 0.17 | 4.1 | 0.81 | 0.39 | 0.34 |
| 340.491 | 163,14– 153,13 | 0.36 | 1.3 | 0.18 | 3.0 | 0.70 | 0.45 | 0.75 |
| 340.536 | 164,13– 154,12 | 0.36 | 0.55 | 0.31 | 2.3 | 0.49 | 0.36 | 0.36 |
| 345.183 | 170,17– 160,16 | 0.29 | 1.2 | 0.24 | 2.1 | 0.66 | 0.44 | 0.34 |
| 345.327 | 161,15– 151,14 | 0.29 | 0.32 | 0.24 | 3.8 | 2.2 | 0.21 | 0.38 |
– means frequency not observed.
a Blend with C2H5OH.
b Blend with C2H5OH at 225404 MHz in other sideband.
| Frequency | Transition | Sources | ||||||
|---|---|---|---|---|---|---|---|---|
| [GHz] | AFGL 2591 | G24.78 | G75.78 | NGC 6334 IRS1 | NGC 7538 IRS1 | W3(H2O) | W33A | |
| CH3CN | ||||||||
| 220.476 | 128.0,K– 118,0,L | 0.24 | 0.45 | 0.43 | 1.0 | 0.54 | 0.53 | 0.24 |
| 238.913 | 137,0,K– 127,0,L | – | 1.4 | 0.25 | – | – | 0.50 | 0.38 |
| 238.972 | 136,0,K– 126,0,K | – | 2.8 | 0.47 | – | – | 1.8 | 0.73 |
| 239.064 | 134,0,K– 124,0,L | – | 3.8 | 0.83 | – | – | 1.9 | 0.97 |
| 239.097 | 133,0,K– 123,0,L | – | 5.9 | 1.2 | – | – | 3.8 | 1.5 |
| 239.120 | 132,0,K– 122,0,L | – | 5.0 | 1.1 | – | – | 3.4 | 1.5 |
| 239.133 | 131,0,K– 120/1,0,L | – | 5.7 | 1.8 | – | – | 8.1 | 1.4 |
| 239.138 | 130,0,K– 120,0,L | – | 5.2 | 0.98 | – | – | 0.50 | 0.69 |
| 240.090 | 131,2,K– 121,2,L | 0.3 | 0.94 | 0.31 | 3.0 | a | 0.29 | 0.32 |
| 348.645 | 1911,0,K– 1811,0,L | 0.36 | 0.36 | 0.43 | 0.64 | 0.59 | 0.58 | 0.24 |
| CHCN | ||||||||
| 220.485 | 126,0,K– 116,0,L | 0.24 | 0.30 | 0.43 | 0.35 | 0.54 | 0.53 | 0.24 |
| 238.905 | 135,0,K– 125,0,L | – | 0.17 | 0.25 | – | – | 0.50 | 0.34 |
| 238.946 | 134,0,K– 124,0,L | – | 0.57 | 0.25 | – | – | 0.50 | 0.34 |
| 238.978 | 133,0,K– 123,0,L | – | 1.06 | 0.25 | – | – | 0.50 | 0.38 |
| 239.001 | 132,0,K– 122,0,L | – | 0.73 | 0.25 | – | – | 0.50 | 0.34 |
| 348.853 | 198,0,K– 188,0,L | 0.36 | 0.36 | 0.43 | 0.36 | 0.59 | 0.58 | 0.24 |
– means frequency not observed.
K refers to main transition of the upper level i.e. 12, 13, or 19 1, , or 1
L refers to the main transition of the lower level i.e. 11, 12 , or 18 1, , or 1.
a Blend with CH3OH.
| Frequency | Transition | Sources | ||||||
|---|---|---|---|---|---|---|---|---|
| [GHz] | AFGL 2591 | G24.78 | G75.78 | NGC 6334 IRS1 | NGC 7538 IRS1 | W3(H2O) | W33A | |
| 218.390 | 243,21– 233,20 | – | 0.71 | 0.41 | – | – | – | – |
| 219.506 | 242,22– 232,21 | 0.36 | 0.85 | 0.26 | 2.2 | 0.32 | 0.39 | 0.41 |
| 222.918 | 251,24– 241,23 | 0.32 | – | – | 3.4 | 0.36 | – | – |
| 223.385 | 261,26– 251,25 | 0.32 | – | – | 1.9 | 0.36 | – | – |
| 227.781 | 253,22– 243,21 | – | 1.8 | 0.26 | – | 0.32 | 0.39 | – |
| 228.483 | 252,23– 242,22 | 0.24 | 1.4 | 0.36 | 2.4 | 0.30 | 0.33 | 0.24 |
| 231.310 | 261,25– 251,24 | 0.32 | 0.79 | 0.21 | 2.5 | 0.36 | 0.61 | 0.42 |
| 233.443 | 265,22– 255,21 | 0.15 | 1.2 | 0.24 | 1.0 | 0.41 | 0.94 | 0.29 |
| 233.498 | 265,21– 255,20 | 0.15 | 1.5 | 0.24 | 1.9a | 0.41 | 0.63 | 0.29 |
| 240.319 | 281,28– 271,27 | 0.30 | 1.4 | 0.26 | 3.2 | 0.38 | 0.66 | 0.41 |
| 240.429 | 280,28– 270,27 | 0.30 | 1.1 | 0.26 | 0.58 | 0.38 | 0.47 | 0.41 |
| 248.781 | 291,29– 281,28 | 0.32 | 1.1 | 0.30 | – | 0.35 | 0.60 | 0.26 |
| 248.869 | 290,29– 280,28 | 0.32 | 1.2 | 0.30 | – | 0.35 | 1.1 | 0.26 |
| 339.895 | 392,38– 382,37 | 0.30 | 1.2 | 0.21 | 2.8 | 0.36 | 0.39 | 0.21 |
| 339.968 | 382,36– 372,35 | 0.30 | 1.4 | 0.21 | 2.9 | 0.36 | 0.39 | 0.21 |
| 340.149 | 391,38– 381,37 | 0.36 | 1.0 | 0.26 | 0.62 | 0.41 | 0.36 | 0.23 |
| 340.433 | 3812,26/27– 3712,25/26 | 0.36 | 0.63 | 0.26 | 1.1 | 0.41 | 0.36 | 0.23 |
| 340.483 | 3810,28/29– 3710,27/28 | 0.36 | 0.83 | 0.26 | 1.4 | 0.41 | 0.36 | 0.23 |
| 340.551 | 3815,23/24– 3715,22/23 | 0.36 | 0.35 | 0.26 | 0.63 | 0.41 | 0.36 | 0.23 |
| 340.576 | 389,29/30– 379,28/29 | 0.36 | 0.85 | 0.26 | 0.62 | 0.41 | 0.36 | 0.23 |
| 346.712 | 258,17/18– 257,18/19 | 0.26 | 0.47 | 0.36 | 1.9 | 0.24 | 0.32 | 0.23 |
| 346.864 | 228,14/15– 227,15/16 | 0.26 | 0.47 | 0.36 | 0.96 | 0.24 | 0.32 | 0.23 |
| 346.874 | 384,34– 374,33 | 0.26 | 0.82 | 0.36 | 2.4 | 0.24 | 0.32 | 0.23 |
| 346.898 | 218,13/14– 217,14/15 | 0.26 | 0.49 | 0.36 | 1.8 | 0.24 | 0.32 | 0.23 |
| 346.925 | 208,12/13– 207,13/14 | 0.26 | 0.47 | 0.36 | 0.93 | 0.24 | 0.32 | 0.23 |
| 348.261 | 392,37– 382,36 | 0.23 | 1.8 | 0.21 | 3.6 | 0.27 | 0.32 | 0.26 |
| 348.345 | 401,39– 391,38 | 0.23 | 1.2 | 0.21 | 3.5 | 0.27 | 0.32 | 0.26 |
| 353.089 | 233,20– 222,21 | 0.32 | 0.27 | 0.51 | 0.58 | 0.30 | 0.29 | 0.42 |
| 353.235 | 116,5/6– 105,6/5 | 0.32 | 0.23 | 0.51 | 2.9 | 0.30 | 0.29 | 0.42 |
– means frequency not observed.
a Blend with NH2CHO.
| Frequency | Transition | Sources | ||||||
|---|---|---|---|---|---|---|---|---|
| [GHz] | AFGL 2591 | G24.78 | G75.78 | NGC 6334 IRS1 | NGC 7538 IRS1 | W3(H2O) | W33A | |
| 222.014 | 136– 126 | 0.23 | 0.27 | 0.25 | 0.51 | 0.41 | 0.27 | 0.25 |
| 222.061 | 135– 125 | 0.23 | 0.18 | 0.25 | 0.59 | 0.41 | 0.27 | 0.25 |
| 222.099 | 134– 124 | 0.23 | 0.44 | 0.25 | 1.2 | 0.19 | 0.49 | 0.25 |
| 222.129 | 133– 123 | 0.63 | 2.5 | 0.54 | 7.6 | 0.92 | 2.0 | 0.58 |
| 222.150 | 132– 122 | 0.87 | 2.2 | 0.81 | 7.2 | 1.2 | 2.1 | 0.89 |
| 222.163 | 131– 121 | 1.2 | 4.3 | 1.0 | 8.1 | 1.7 | 1.7 | 1.9 |
| 222.167 | 130– 120 | 1.5 | 3.4 | 1.5 | 8.1 | 1.2 | 3.2 | 2.0 |
| 239.088 | 146– 136 | – | 0.46 | 0.17 | – | – | 0.32 | 0.34 |
| 239.138a | 145– 135 | – | 0.69 | 0.98 | – | – | 0.32 | 0.34 |
| 239.179 | 144– 134 | – | 0.62 | 0.17 | – | – | 0.70 | 0.34 |
| 239.211 | 143– 133 | – | 2.6 | 1.4 | – | – | 1.9 | 0.86 |
| 239.234 | 142– 132 | – | 3.2 | 1.4 | – | – | 8.0b | 1.3 |
| 239.248 | 141– 131 | – | 4.0 | 1.6 | – | – | 1.5 | 1.9 |
| 239.252 | 140– 130 | – | 4.4 | 2.1 | – | – | 3.4 | 2.0 |
– means frequency not observed.
a Blend with CH3CN.
b Blend with OCS at 231062 MHz in the main sideband.
| Frequency | Transition | Sources | ||||||
|---|---|---|---|---|---|---|---|---|
| [GHz] | AFGL 2591 | G24.78 | G75.78 | NGC 6334 IRS1 | NGC 7538 IRS1 | W3(H2O) | W33A | |
| 211.537 | 176,11– 166,10 E | 0.36 | – | – | 8.6 | – | – | 0.14 |
| 211.575 | 176,11– 166,10 A | 0.36 | – | – | 6.3 | – | – | 0.19 |
| 211.771 | 175,13– 165,12 E | 0.36 | – | – | 6.2 | – | – | 0.14 |
| 211.785 | 175,13– 165,12 A | 0.36 | – | – | 6.2 | – | – | 0.14 |
| 218.281 | 171,16– 161,15 E | – | 0.48 | 0.41 | – | – | – | – |
| 218.297 | 173,14– 163,13 A | – | 0.46 | 0.41 | – | – | – | – |
| 220.167 | 172,15– 164,12 E | 0.24 | 0.82 | 0.36 | 7.1 | 0.42 | 0.98 | 0.24 |
| 220.190 | 174,13– 164,12 A | 0.24 | 0.67 | 0.36 | 6.4 | 0.66 | 0.33 | 0.24 |
| 221.979 | 189,9/10– 179,8/9 A | 0.39 | 0.71 | 0.32 | 5.7 | 0.84 | 1.1 | 0.32 |
| 223.125 | 187,11– 177,10 E | 0.32 | – | – | 7.2 | 0.30 | – | – |
| 223.135 | 187,12– 177,11 | 0.32 | – | – | 8.9 | 0.43 | – | – |
| 223.163 | 187,11– 177,10 A | 0.32 | – | – | 1.3 | 0.14 | – | – |
| 225.609 | 193,16– 183,15 E | 0.41 | 0.27 | 0.24 | 4.9 | 0.32 | 1.2 | 0.39 |
| 225.619 | 193,17– 183,16 A | 0.41 | 1.0 | 0.24 | 5.7 | 0.32 | 1.9 | 0.18 |
| 226.713 | 202,18– 192,18 E | 0.30 | 0.65 | 0.21 | 9.1 | 0.56 | 0.60 | 0.30 |
| 226.719 | 202,19– 192,18 A | 0.30 | 1.3 | 0.21 | 14 | 0.66 | 0.73 | 0.52 |
| 226.773 | 203,18– 193,17 E | 0.30 | 0.30 | 0.21 | 1.4 | 0.44 | 0.35 | 0.30 |
| 226.779 | 201,19– 191,18 A | 0.30 | 0.30 | 0.21 | 1.4 | 0.53 | 0.35 | 0.30 |
| 227.561 | 211,21– 201,20 Ea | – | 5.3 | 0.73 | – | 1.4 | 6.1 | 0.34 |
| 233.247 | 1916,3/4– 1816,2/3 A | 0.41 | 0.27 | 0.24 | 1.5 | 0.32 | 0.21 | 0.29 |
| 233.256 | 1916,3– 1816,2 E | 0.41 | 0.27 | 0.24 | 3.0 | 0.32 | 0.21 | 0.29 |
| 233.269 | 1916,4– 1816,3 E | 0.41 | 0.27 | 0.24 | 1.3 | 0.32 | 0.21 | 0.29 |
| 233.310 | 1915,4/5– 1815,3/4 A | 0.41 | 0.27 | 0.24 | 3.1 | 0.32 | 0.21 | 0.29 |
| 233.316 | 1915,4– 1815,3 E | 0.41 | 0.27 | 0.24 | 2.0 | 0.32 | 0.21 | 0.29 |
| 233.331 | 1915,5– 1815,4 E | 0.41 | 0.27 | 0.24 | 2.3 | 0.32 | 0.21 | 0.29 |
| 233.395 | 1914,5/6– 1814,4/5 Ab | 0.41 | 0.27 | 0.24 | 4.0 | 0.32 | 0.21 | 0.29 |
| 233.414 | 1914,6– 1814,5 E | 0.41 | 0.27 | 0.24 | 2.1 | 0.32 | 0.21 | 0.29 |
| 233.505 | 1913,6– 1813,5 Ec | 0.41 | 1.4 | 0.24 | 6.1 | 0.32 | 1.6 | 0.29 |
| 233.525 | 1913,7– 1813,6 E | 0.41 | 0.72 | 0.24 | 2.8 | 0.32 | 0.21 | 0.40 |
| 233.649 | 1912,7– 1812,6 E | 0.41 | 0.22 | 0.24 | 0.74 | 0.32 | 0.21 | 0.29 |
| 233.655 | 1912,7/8– 1812,6/7 A | 0.41 | 1.5d | 0.24 | 4.4 | 0.32 | 0.21 | 0.29 |
| 233.671 | 1912,8– 1812,7 E | 0.41 | 0.18 | 0.24 | 2.3 | 0.32 | 0.21 | 0.17 |
| 233.754 | 182,16– 172,15 E | 0.41 | 1.1 | 0.24 | 7.5 | 0.32 | 0.21 | 0.29 |
| 234.502 | 199,10/11– 189,9/10 A | 0.30 | 0.94 | 0.21 | 7.3 | 0.41 | 0.35 | 0.30 |
| 240.021 | 191,18– 181,17 E | 0.30 | 1.1 | 0.26 | 6.8 | 0.72 | 0.42 | 0.41 |
| 240.035 | 193,16– 183,15 A | 0.30 | 1.1 | 0.26 | 7.0 | 0.68 | 1.1 | 0.29 |
| 248.617 | 207,14– 197,13 A | 0.32 | 0.69 | 0.30 | – | 0.35 | 0.91 | 0.26 |
| 248.634 | 207,14– 197,13 E | 0.32 | 0.94 | 0.30 | – | 0.35 | 0.96 | 0.26 |
| 248.744 | 207,13– 197,12 E | 0.32 | 0.33 | 0.30 | – | 0.69 | 0.45 | 0.26 |
| 248.750 | 232,22– 221,22 Ee | 0.32 | 3.8 | 0.30 | – | 1.3 | 2.0 | 0.26 |
| 248.787 | 207,13– 197,12 A | 0.32 | 0.33 | 0.30 | – | 0.24 | 0.45 | 0.26 |
| 249.031 | 205,16– 195,15 E | 0.32 | 0.51 | 0.30 | – | 0.35 | 0.33 | 0.26 |
| 249.047 | 205,16– 195,15 A | 0.32 | 0.77 | 0.30 | – | 0.35 | 0.59 | 0.26 |
– means frequency not observed.
a Blend with 212,20– 202,19 E,211,21– 201,20 A, and 210,21– 200,20 A.
b Blend with line at 233397 1914,5– 1814,4 E.
c Blend with 1913,6– 1813,5 A, and 1913,7– 1813,6 A.
d Blend with C2H5CN.
e Blend with 231,23– 22122 E, 232,22– 222,21 E, 231,23– 222,21 E,
| Frequency | Transition | Sources | ||||||
|---|---|---|---|---|---|---|---|---|
| [GHz] | AFGL 2591 | G24.78 | G75.78 | NGC 6334 IRS1 | NGC 7538 IRS1 | W3(H2O) | W33A | |
| 338.356 | 278,19– 268,18 E | 0.30 | 0.30 | 0.20 | 8.8 | 0.23 | 1.6 | 0.29 |
| 338.397 | 277,21– 267,20 E | 0.30 | 0.30 | 0.13 | 11 | 0.85 | 0.30 | 0.29 |
| 340.221 | 3113,19– 3112,19 Ea | 0.36 | 0.35 | 0.26 | 2.7 | 0.41 | 0.36 | 0.23 |
| 345.069 | 2814,14– 2714,13 Eb | 0.29 | 1.7 | 0.30 | 14 | 0.33 | 1.5 | 0.24 |
| 345.090 | 2814,15– 2714,14 E | 0.29 | 0.69 | 0.30 | 8.2 | 0.33 | 0.78 | 0.24 |
| 345.281 | 1813,5/6– 1812,6/7 A | 0.29 | 0.27 | 0.30 | 3.5 | 0.33 | 0.21 | 0.24 |
| 345.462 | 2813,15– 2713,14 E | 0.29 | 0.27 | 0.30 | 4.8 | 0.33 | 0.21 | 0.24 |
| 345.467 | 2813,15/16– 2713,14/15 A | 0.29 | 1.1 | 0.30 | 8.9 | 0.33 | 0.32 | 0.24 |
| 345.486 | 2813,16– 2713,15 E | 0.29 | 0.16 | 0.30 | 5.7 | 0.33 | 0.21 | 0.24 |
| 345.975 | 2812,16– 2712,15 E | – | – | – | – | 0.68 | 0.29 | – |
| 345.985 | 2812,16/17– 2712,15/16 A | – | – | – | – | 0.78 | 2.0 | – |
| 346.001 | 2812,17– 2712,16 E | – | – | – | – | 0.39 | 0.64 | – |
| 346.660 | 2811,17– 2711,16 E | 0.26 | 0.47 | 0.36 | 7.5 | 0.67 | 0.32 | 0.23 |
| 346.675 | 2811,17/18– 2711,16/17 A | 0.26 | 1.1 | 0.36 | 11 | 0.67 | 0.32 | 0.23 |
| 346.687 | 2811,18– 2711,17 E | 0.26 | 0.27 | 0.36 | 6.7 | 0.31 | 0.32 | 0.23 |
| 348.050 | 284,24– 274,23 E | 0.23 | 1.8 | 0.11 | 12 | 0.73 | 1.5 | 0.26 |
| 348.066 | 286,23– 276,22 A | 0.23 | 1.6 | 0.32 | 11 | 0.60 | 1.3 | 0.26 |
| 348.909 | 289,20– 279,19 E | 0.23 | 1.2 | 0.32 | 0.43 | 0.33 | 0.36 | 0.30 |
| 348.915 | 289,20– 279,19 A | 0.23 | 1.5 | 0.32 | 7.7 | 0.33 | 0.36 | 0.30 |
| 356.215 | 2921,8/9– 2821,7/8 A | 0.36 | 0.47 | 0.53 | 2.6 | 0.41 | 0.36 | 0.68 |
| 356.297 | 2920,9/10– 2820,8/9 A | 0.36 | 0.49 | 0.53 | 6.3 | 0.30 | 0.36 | 0.68 |
| 356.404 | 2919,10/11– 2819,9/10 A | 0.36 | 0.47 | 0.53 | 4.2 | 0.41 | 0.36 | 0.68 |
– means frequency not observed.
a Blend with 3113,18– 3112,19 A, and 3113,19– 3112,20 A.
b Blend with 2814,14– 2714,13 A, and 2814,15– 2714,14 A.
| Frequency | Transition | Sources | ||||||
|---|---|---|---|---|---|---|---|---|
| [GHz] | AFGL 2591 | G24.78 | G75.78 | NGC 6334 IRS1 | NGC 7538 IRS1 | W3(H2O) | W33A | |
| 222.029 | 212,20,2/3– 211,21,2/3 | 0.39 | 0.26 | 0.32 | 3.1 | 0.41 | 0.42 | 0.25 |
| 222.035 | 212,20,0/1– 211,21,0/1 | 0.39 | 0.72 | 0.32 | 2.5 | 0.41 | 0.37 | 0.25 |
| 222.239 | 43,2,2– 32,1,2 | 0.39 | 0.16 | 0.32 | 1.6 | 0.41 | 0.27 | 0.25 |
| 222.248 | 43,2,1/3– 32,1,1/3 | 0.39 | 0.86 | 0.32 | 5.3 | 0.41 | 0.37 | 0.37 |
| 222.255 | 43,2,0– 32,1,0 | 0.39 | 0.53 | 0.32 | 4.7 | 0.41 | 0.50 | 0.18 |
| 222.259 | 43,1,1/2– 32,1,1/2 | 0.39 | 0.60 | 0.32 | 2.6 | 0.41 | 0.48 | 0.18 |
| 222.326 | 253,23,K– 244,20,0 | 0.39 | 0.15 | 0.32 | 2.3 | 0.41 | 0.27 | 0.25 |
| 225.599 | 121,12,K– 110,11,K | 0.41 | 3.1 | 0.73 | 11.8 | 0.83 | 4.0 | 1.0 |
| 226.347 | 141,13,K– 132,12,K | – | 1.5 | 0.41 | – | – | – | – |
| 227.648 | 265,21,K– 264,22,K | – | 0.40 | 0.26 | – | 0.32 | 0.39 | – |
| 227.658 | 243,22,0/1– 242,23,0/1 | – | 0.81 | 0.26 | – | 0.32 | 0.39 | – |
| 230.140 | 172,15,K– 163,14,K | 0.39 | 1.7 | 0.32 | 3.3 | 0.41 | 1.4 | 0.25 |
| 233.633 | 255,20,K– 254,21,K | 0.15 | 1.1 | ,0.24 | 2.6 | 0.32 | 0.46 | 0.23 |
| 240.978 | 53,3,2– 42,2,2 | 0.32 | a | 0.30 | 2.6 | 0.35 | 0.45 | 0.26 |
| 240.985 | 53,3,1– 42,2,1 | 0.32 | 3.4a | 0.30 | 8.3 | 0.41 | 2.8 | 0.56 |
| 240.990 | 53,3,0– 42,2,0 | 0.32 | a | 0.30 | 3.3 | 0.35 | 0.45 | 0.19 |
– means frequency not observed.
K is either 0,1,2, or 3.
a 53,3,1– 42,2,1 transition is blended with 53,3,2– 42,2,2 and 53,3,0– 42,2,0.