Mass Modelling with Minimum Kinematic Information
Abstract
Mass modelling of early-type systems is a thorny issue; even for the few close by galaxies for which kinematic data is available, the implementation of this data can get embroiled in problems that are hard to overcome, unless more complete data sets are available. The mass-anisotropy degeneracy is a typical example of this. In this paper, we present a new mass modelling formalism for ellipticals that invokes no other observations other than the central velocity dispersion () and photometry. The essence of the method lies in choosing a local mass-to-light ratio () profile for a galaxy, with which the deprojected luminosity density distribution (along the major axis coordinate ) is scaled. The resulting discontinuous mass density profile is then smoothed, according to a laid out prescription; the local profile that stems from this smoothed mass density, is found to be significantly different from the raw distribution. A suite of model galaxies (both Sersic and cored in nature) is used for intensive experimentation in order to characterise this raw profile and in each case, the mass density recovered from this mass modelling technique is compared to the known mass distribution. We opt to work with a raw profile that is a simple two-stepped function of , with a low inner and higher outer value of and , respectively. The only constraint that we have on this profile is in the centre of the galaxy, via . This value of is implemented in the virial theorem to obtain an estimate of the central ratio of the galaxy. The fallibility of the virial mass estimate is taken care of, by allowing for a range in the values of that can be used for a given galaxy model. Moreover, our experiments indicate that is uniquely known, for a given ; for cored galaxies, this functional form is found uniquely dependant on the core radius. The physical basis for such a connection to exist between the inner and out is discussed. The jump radius of the raw profile is chosen to be about thrice the effective radius of the galaxy. In this way, the local distribution is completely specified and mass profiles of ellipticals can be constructed till about 3 times the effective radius. The proposed technique is extended to predict a mass profile for M87 which is then successfully compared to distributions reported earlier from kinematic analyses.
keywords:
galaxies: kinematics and dynamics – galaxies: structure – celestial mechanics: stellar dynamics1 Introduction
The recovery of the total mass distribution in early type systems is a knotty problem. The obvious reason for this is lack of information; photometry offers access to the stellar mass but the deduction of the arrangement of the total mass in a system remains elusive, unless kinematic information is invoked. Even when velocity information is available, the implementation of the same is besotted with problems of varying degrees of subtleness (?, ?, ?, ?).
Of the many debacles that plague the processing of kinematics, the worst is perhaps the mass anisotropy degeneracy; even in the simplistic case of a spherical system, the mass distribution can be known only as a function of the anisotropy in velocity space (?). Getting an independent handle on anisotropy is difficult, if not impossible in most cases. ? attempt this for the system of globular clusters in M87, by constraining the total mass from the work of ?. Their conclusion indicates that the velocity distribution of this system in M87 is “almost perfectly isotropic”. This is consistent with the appraisal of isotropy in globular cluster systems in other galaxies (?, ?).
An attempt is also underway to produce a fully anisotropic algorithm, that is similar in flavour to the existing code CHASSIS that works by implementing kinematic data of tracers to recover the potential and distribution function from which the tracer sample is most likely to have been drawn (?, ?). However, a large number of kinematic observations is required by this proposed extension. Nonetheless, what is heartening is that such ambitious data sets are less of a figment of the astronomer’s reverie today, owing to the huge kinematic surveys that are planned or already in operation.
Another technique that is often employed in mass modelling of elliptical galaxies involves the utilisation of X-ray measurements. The procedure suffers from uncertainties in the observed temperature profile and simplification in terms of the assumption of a single component in the X-ray emitting gas and of hydrostatic equilibrium. A comprehensive review of various the shortcomings of the conventional mass modelling techniques is presented in ?.
Thus, it is clear that at the present moment, utilisation of kinematic information in mass modelling, suffers from egregious drawbacks. Even more crucially, such data is hard to come by in many external galaxies, including those at higher redshifts. For this latter class, the implementation of velocity information in formalisms that stem from a stellar distribution function, is all the more debatable since systems outside the local universe are most probably not relaxed.
This indicates an opening for a technique that is able to extricate the mass profile of early type systems from photometry, using as little velocity information as possible. Moreover, the used kinematic information should not be used in a procedure that relies on the rigorous employment of the equilibrium stellar distribution function. Such a scheme is advanced in this short report.
It merits mention that any such mass modelling formalism for elliptical galaxies will bear the potential of shedding light on the connection between the luminous and dark matter content in such systems. In the past, such correlations have been explored in spiral galaxies (?, ? and ?), but very little is known about the distribution of the total mass in ellipticals; ? and ? discuss sample galaxies in this context. The scheme discussed here will indicate the same in model systems.
The paper is arranged as follows. The next section provides an exposure to the details of the proposed scheme. In Section 3, the Sersic model considered in the paper is introduced. Section 4 is devoted to the results obtained with the toy galaxy models, while the following section (Section 5) delineates the galaxy models that can be tackled with the proposed scheme from those that are outside the purview of this scheme. Section 6 discusses the details of the results obtained with the data for M87, as obtained from the ACS Virgo Cluster Survey (ACSVCS), (?), and comparison of the recovered mass model with those predicted by ? and ?, (from the analysis of kinematic data of tracer populations in M87). The last section is devoted to the discussions of some of the salient points that were raised in the other sections and a summary of the results.
2 Details of the Formalism
We work under the assumption that the surface brightness profile of a galaxy is known to us. The central velocity dispersion () is also considered known from observations.
2.1 Deprojection
The first step is to deproject the observed brightness profile into the three dimensional luminosity density distribution. This can be done with the non-parametric deprojection algorithm DOPING, which is the acronym for Deprojection of Observed Photometry using an INverse Gambit (?).
This algorithm can perform the deprojection under a general geometry that needs to be specified as an input. The other fundamental input is the inclination. The measurements that DOPING processes are the surface brightness measurements and the projected ellipticity profile, at different values of the major axis coordinate , i.e. the surface brightness map of the galaxy. This is used to provide the three dimensional luminosity density distribution, the line-of-sight projections of which are the best reproductions of the brightness data, along any azimuth on the plane of the sky. The deprojection of the observed photometry for systems with varying intrinsic shape requires the implementation of a regularisation technique, though systems in which the ellipticity is uniform are more easily dealt with. It needs to be mentioned that DOPING can in principle, deal with changes of eccentricity and twist angle, with galactocentric distance.
The errors on the deprojected luminosity profile are the errors of the analysis, which measures the 1- extent of the excursion of the algorithm around the global maxima in the likelihood function; likelihood is maximised on spotting the luminosity density distribution that projects best into the data. The observational errors can be also incorporated into the analysis.
2.2 Models
In this paper, we attempt to mass model a set of toy elliptical galaxies. In terms of measurable quantities, these model systems are ascribed a brightness profile and a projected ellipticity , that we choose to fix at 0.4, (implying that for edge-on viewing, the intrinsic eccentricity =0.8). All the toy galaxies are assumed to have been observed in the SDSS -band and placed at the distance of Virgo (considered as 17Mpc).
Multiple runs are carried out with the toy galaxies being assigned varying values of central velocity dispersion (), from which the local mass-to-light ratio at the centre of the galaxy is calculated in a way discussed below. These observables are the inputs into the mass modelling system that is proposed in the paper. The recovered total mass density distribution is then compared to the true mass density profiles () of these models. The degree of overlap between the predicted and known mass distributions is then visually tracked, in order to confirm the success and limitations of the proposed mass modelling scheme.
The models are described by a luminous component (luminosity density ) lying embedded in a dark halo that is chosen to be NFW type (density: . Thus, the true total mass density of a model galaxy can be written as:
| (1) |
where the dark matter density is
| (2) |
and is a measure of the luminous matter fraction, such that its reciprocal indicates the halo fraction in the toy galaxy. Also, is the absolute magnitude of the Sun in the same waveband as the brightness observations.
We treat two sets of model brightness distributions: the cored and the Sersic type profiles. As far as the cored brightness distributions are concerned, the following prescription is used. The brightness profile of the test galaxies is extracted from the line-of-sight integration of an analytically chosen luminosity density function. (Thus, the deprojection of this brightness data can be compared to the known luminosity density to confirm the correctness of the deprojection). This analytical luminosity density distribution is chosen to have the form:
| (3) |
where is the central luminosity density and the core radius of the test galaxy in question. Thus, various toy surface brightness data sets are prepared, with varying amplitude and core radii. The deprojection is carried out under the assumptions of oblateness and an edge-on viewing angle.
We normalise the deprojected luminosity density profiles of all the model galaxies such that the central value of is about 100 L⊙pc-3, leaving the models distinguishable from each other in terms of the core radius only. Each such model luminosity density profile is then ported to the mass modelling formalism (discussed below) and the outcome is compared to the known mass density distribution of this toy galaxy. Figure 1 shows the normalised luminosity distributions of the cored galaxies (of core radius 7.07pc and about 22.4pc) that have been used in our experiments.
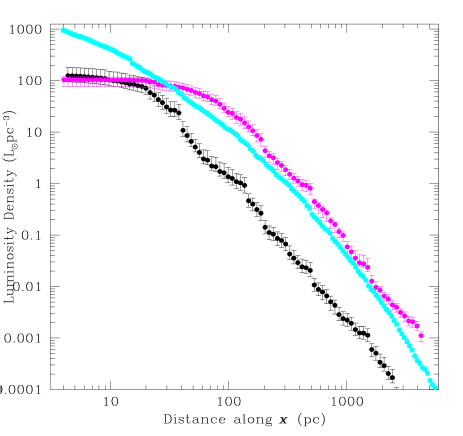
For the Sersic models, the brightness is chosen to be described by a Sersic index of 5.3 and a scale length of about 108pc. This central density is normalised to 1000 L⊙pc-3, i.e. 1 order of magnitude higher than the normalisation factor for the cored galaxies.
2.3 Raw Two-stepped Discontinuous Profile
Once the deprojection is performed, the next stage is to choose a total mass-to-light ratio () profile that scales the obtained luminosity density profile in such a way that it would hopefully emulate the total mass density. Or at least, such is the aim, as in other procedures that hope to connect photometry to a mass model. We suggest selection of a discontinuous, two-step local :
| (4) | |||||
The luminosity density is scaled by this mass-to-light ratio profile and then . Of course, the success of the scheme depends on the selection of , and .
Additionally, we need to be cautious that this method is susceptible to spurious answers at distances where the dark matter halo dominates the system. Thus, we aim to produce a mass profile over a radial range that is not too extensive (not exceed about 3, where is a measure of the effective radius of the galaxy). We ascertain by measuring the slope () of the straight line that is fit to the plot of core-removed log10(I) against : .
So, what would amount to a judicious prescription for the selection of the free parameters in this formalism? If we were to assume that mass follows light in elliptical galaxies, then we could set and could be set to any value in the range of [0, 3]. But there is no reason to believe that mass does follow light in elliptical galaxies. In fact, gas kinematics and X-ray studies indicate otherwise; ? report that the hypothesis that mass follows light can be rejected at 96 for their oblate models for NGC720 and 98 for their prolate models. ? point out that the run of the mass-to-light ratio with galactocentric radius in ellipticals is similar to that in spirals.
Kinematics too rule out the possibility of a constant at 95 confidence (?). More recently, the analysis of the kinematics of planetary nebulae observed in five elliptical galaxies, by the Planetary Nebula Spectrograph, has led to the announcement that these galaxies are drastically short of dark matter in the outer parts (?, ?). ? advance a parameter that measures the logarithmic slope of the mass-to-light ratio in a sample of early type galaxies, to find that it increases with the stellar mass. They conclude that the distribution of dark matter or its fraction changes with radius.
2.3.1 Jump Radius
Thus, we are left to make as good a choice for the parameters as possible, from whatever can be learnt about the system from the minimum of observables. Now, there is no observational constraint that can suggest a value for the jump radius , at which the above two-step local profile should suffer its discontinuity. However, one obvious length scale in the problem is . So we can choose to impose a certain multiple of as the jump radius; in fact, experiments indicate that a good value of is 3. This is not a particularly bad choice either, given that by 3 effective radii, the dark matter content can be expected to begin to exert its influence. Having fixed , we now proceed to use whatever observable information there may be available to constrain and .
2.3.2 Inner
One measure that is often available from observations is the central velocity dispersion in galaxies. can be utilised to get a handle on the local mass-to-light ratio in the inner parts of the galaxy (i,e, ). This can be done by implementing that is measured at (say), in the virial theorem. However, the estimation of the mass enclosed within (), from which the average mass density () inside can be calculated in this way, will be mired in errors owing to a lack of information about the degree of anisotropy present at , as well as the extent of deviation from sphericity at . Virial theorem suggests that under the assumption of velocity isotropy,
| (5) |
and oblateness and edge-on inclination imply
| (6) |
This estimated will deviate from the true inner mass density, as explained above. Anisotropy will spuriously lower the estimated enclosed mass and therefore the calculated , for a given . For example, ? suggest that the dynamical mass enclosed within the projected half-light radius () of the massive ellipticals in their SDSS sample is given as 1.652 times , with a systematic error of 30 (?).
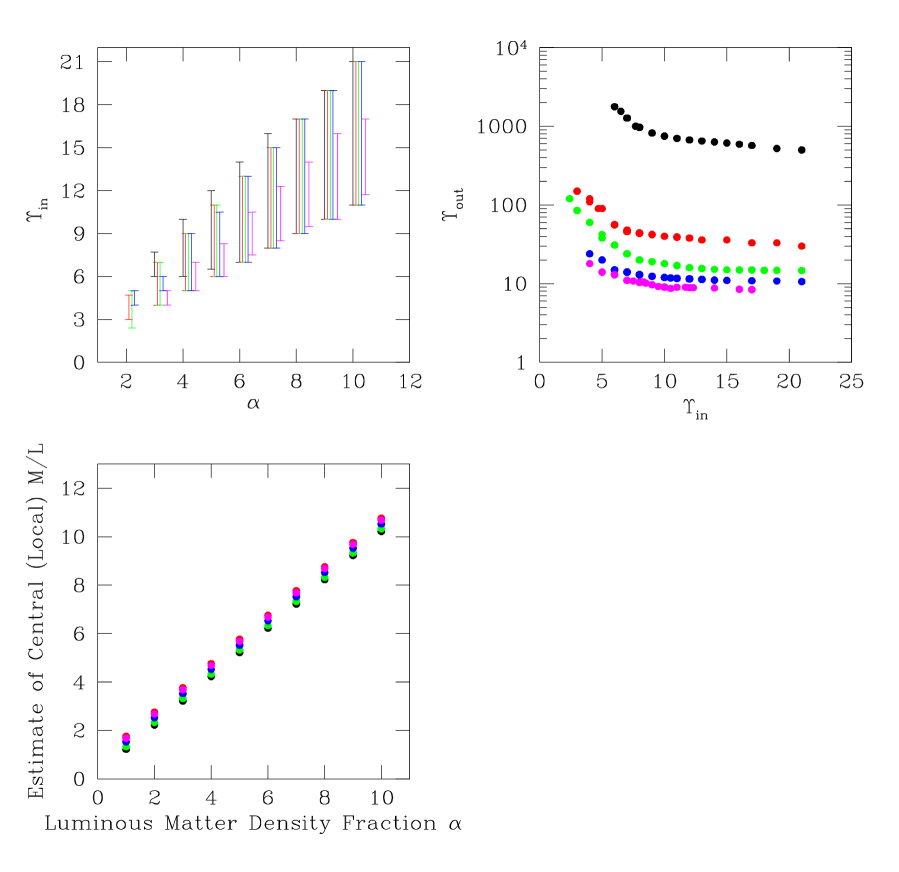
Expectedly, the central () has a one-to-one and monotonically increasing relationship with the luminous matter fraction index (lower left panel of Figure 2). As shown in the figure, is well represented by , though the deviation of from unity exists - this ratio decreases from about 0.22 to 0.07 as we increase from 7.1pc to 22.4pc. We will use this result to justify our choice of for parametrising the estimated central .
We scan through a range of estimated central values (i.e. ) and monitor the success of the proposed technique; in the process, the ranges of and corresponding to a given choice of the central value are recorded.
Now, experiments with our model galaxies of a given core radius indicate that for a given , there exists a range of values for that will result in compatibility of the estimated and known mass density profiles (upper left panel in Figure 2). This band of allowed values for a given , varies with core radius of the normalised luminosity density profile in hand. For our cored galaxies, this band of values that are allowed at a given , range from just above the corresponding value of to approximately 2 times this , with this factor varying only weakly with core radius .
If we assume the value of 2.72 between the true value of the mass enclosed within an effective radius and , as suggested by ? (and used by ?), then the true central should be about 1.82 times the virial estimate. Thus, the range of 2 that is allowed in , for a given estimate of , appears to be inclusive of real ellipticals, at least the systems that are as massive as those in the sample of ?.
If it so happens that a certain galaxy is far too anisotropic at the centre, such that the true exceeds the upper bound on the allowed at the at hand, then the mass density profile that will result from using the highest value of the permitted in our mass modelling formalism, will not concur with the profile that results from using the lowest allowed . Thus, in such circumstances, when our scheme fails, we will be aware that it has done so.
Thus, it may be summarised that even though the virial theorem is invoked to help constrain , there is enough scope available within the formalism to accommodate for the problems caused by velocity anisotropy in traditional kinematic modelling. This and other flexibilities offered by the proposed formalism are discussed in greater detail in Section 7.
2.3.3 Outer
Our experiments indicate that it is possible to achieve a one-to-one correlation between and , for a toy configuration of a given core radius. In other words, irrespective of , whenever a value of is chosen, is fixed. This relationship between and is depicted on the top right panel in Figure 2.
Actually, there exists a range of for a given , with the extent of this range maximising itself at values of that lie in the middle of the range that is allowed for a given . However, to keep matters simple, we present only the value of that lies at an extrema of this range, for a given .
Analytical fits to the plots suggest that varies as , where and are constants that are determined from fitting this exponentially decaying function to the plot of against ; measures the decay rate. Fitting this functional form to the experimentally obtained plots, suggest power-law dependences of both the additive and multiplicative constants, on :
-
1.
,
-
2.
and
-
3.
has a weak dependence on , according to .
That the inner and outer local ratios are connected, betrays a relationship between the luminous and dark matter content in these toy elliptical galaxies. This facet of the models and the conclusions that we can draw on the basis of these results for elliptical galaxies in general, are further explored in Section 7.
2.3.4 Smoothing
Once the local is specified, it is used to scale the luminosity density distribution, in order to obtain a mass density distribution, which is indeed rendered discontinuous by the process of its formulation. Thus, the next stage is to smooth this mass density distribution.
We choose to smooth this density profile with a triangle filter of filter size given by 2, i.e. two successive applications of a box filter of filter size corresponding to the length . It is appropriate that the smoothing filter size be a function of one of the characteristic scale-lengths of the system; is the most obvious candidate that satisfies this criterion. Thus, the trends in with variation in , for the different normalised toy galaxy configurations, have been extracted from experiments performed with a smoothing filter size of . However, other smoothing windows are also usable - except that the exact nature of the relationship between and will then be different from what is prescribed above, for a given .
3 Sersic Galaxies
All the toy models that are discussed above correspond to examples of surface brightness profiles that are cored. In order to investigate the full applicability of our mass modelling technique, a Sersic type galaxy is now examined.
We consider a toy Sersic surface brightness distribution, described by a central density of 1000 L⊙pc-3, a scale length of about 100pc and a Sersic index of 5.3. When deprojected under the assumption of sphericity, a luminosity density profile along the semi-major axis is recovered. The central density chosen for this toy model is 1000 L⊙pc-3 instead of 100 L⊙pc-3 (as in the cored models), since the proposed mass modelling technique does not work for Sersic models at the lower normalisation.
Once normalised in this way, a range of central (local) mass-to-light ratio values are imposed, in order to scan the range of parameters over which our scheme is viable. As before, the central values are imposed in terms of the parameter (the luminous matter fraction). The raw two-step local profile that is imposed upon this luminosity density is again chosen to be described by an inner of and an outer of , with the jump radius given by 3.
In these Sersic models, is defined as the slope () of the straight line that is fit to the plot of log10(I) against : . For the toy model at hand, we find 726.8pc.
Once the two-stepped local profile is fully characterised, the deprojected luminosity density is scaled by it and the resulting mass density distribution is smoothed. As before, it is smoothed by two successive applications of a boxcar smoothing filter of filter size given by .
For a given choice of the central , a range of are allowed. This is shown on the left panel of Figure 3. This range is evidently smaller for the Sersic toy model, compared to the cored models. Again, we find that a one-to-one relationship exists between and , as shown in the right panel of Figure 3.
Thus, it is apparent that galaxies with brightness distributions that are best described by a Sersic profile, can also be tackled by the proposed mass modelling scheme. The two main differences in the formalism, as applicable to the cored and Sersic brightness profiles are the following.
-
1.
The luminosity density for a Sersic-type galaxy needs to be normalised to 1000 L⊙pc-3, while a cored brightness profile would require a normalisation factor that is 1 order of magnitude smaller.
-
2.
For the determination of of the Sersic-type galaxies, a straight line fit to the plot of log10(I) against needs to be performed while for the cored galaxies, a linear fit is sought to the relationship between the core-removed log10(I) profile and .
4 Results
Figure 4 brings out the change in the local mass-to-light ratio profile, as a result of the smoothing; the mass density distribution that results from the smoothing of the scaled luminosity density profile, is compared to the luminosity density, to extract the smoothed local . This is seen in the figure to be different from the raw, two-step, discontinuous distribution that is used to scale . The smoothing is noted to affect mass-to-light on both sides of the jump radius.

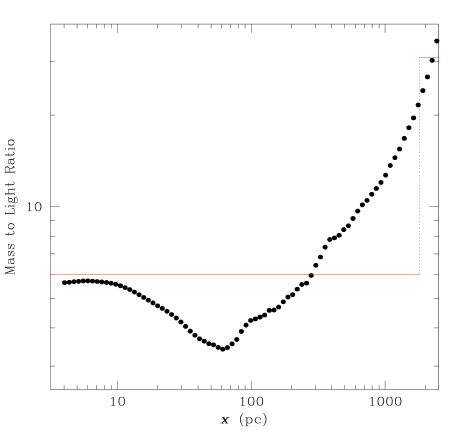
Figure 5 displays the degree of overlap between the estimated and true mass density profiles, for toy cored galaxies that are normalised to the same central luminosity density and characterised by varying shapes, i.e. varying (upper panels). The lower panels of the same figure indicate a similar comparison, when is made to change. In all these cases, when we utilise the prescribed values of and , the predicted mass density profile reproduces the true mass density profile very well, within error bars.
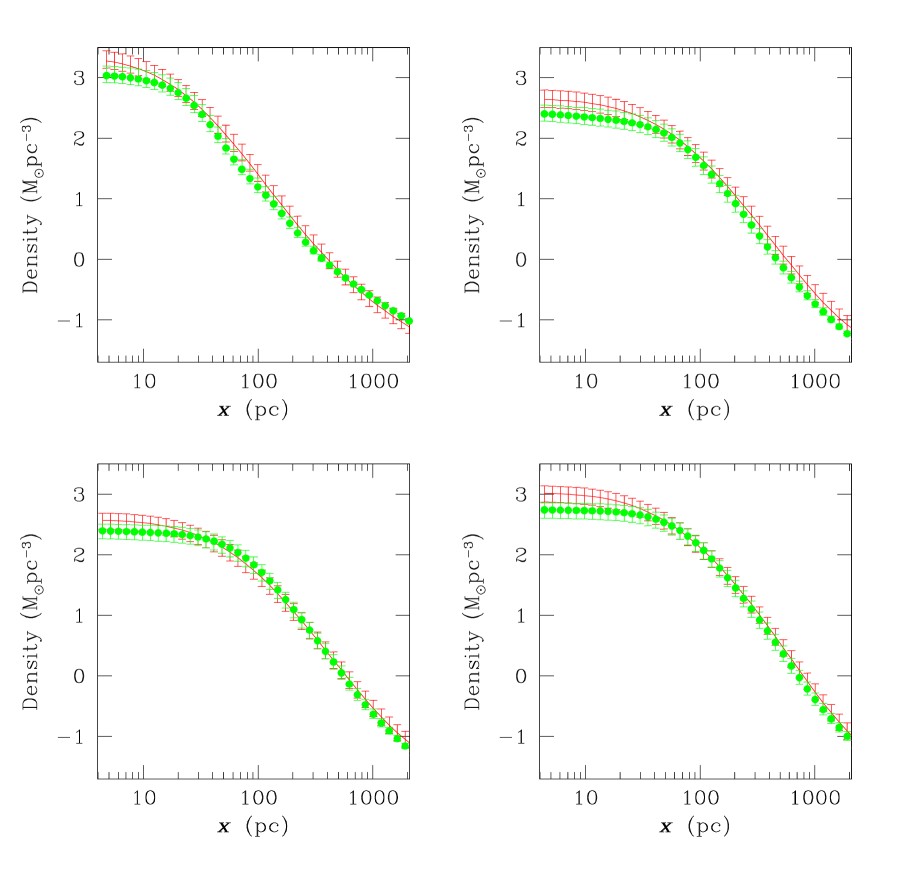
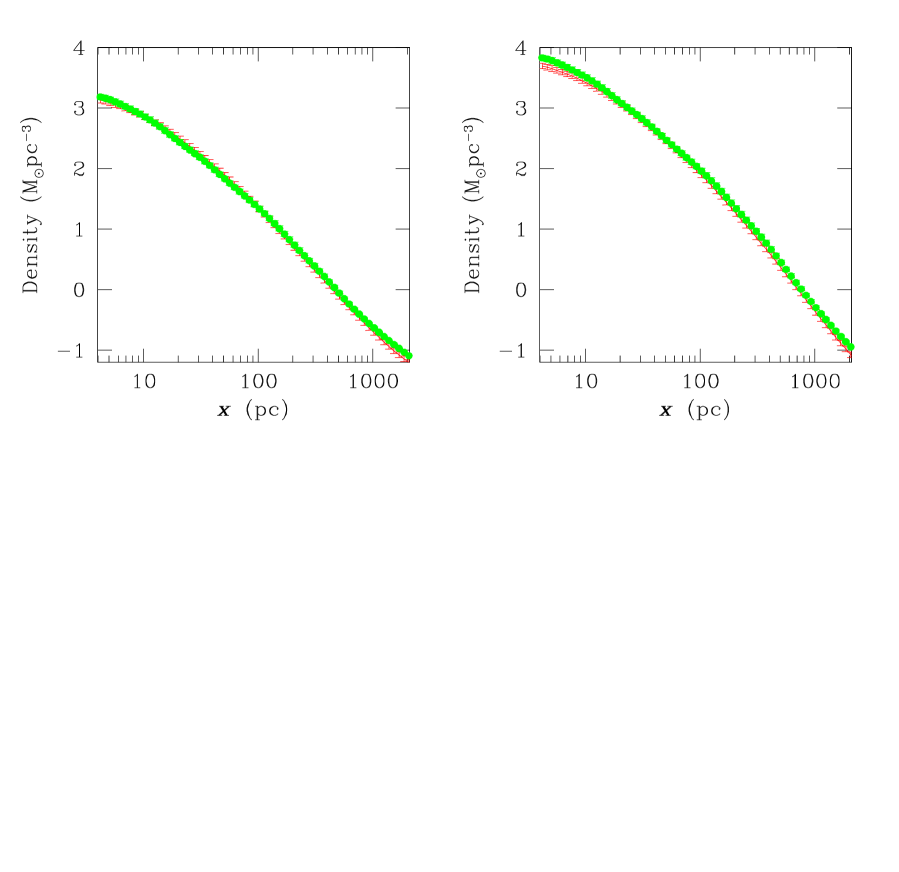
Figure 6 brings out the resemblance between the known mass density distribution along the major axis (in green) and its predicted counterpart (in red), for the Sersic model investigated, for a value of that is picked from the range allowed for a given choice of the estimated central .
5 Allowed galaxies
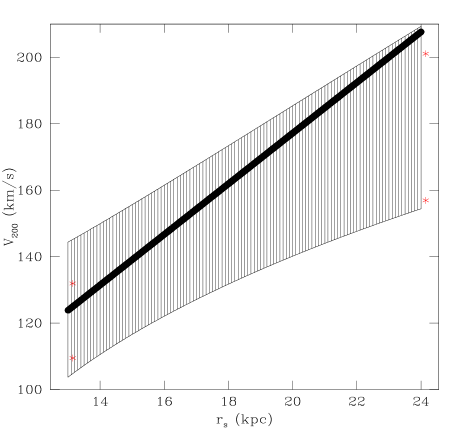
This scheme of characterising the two-step local mass-to-light ratio profile is found to work only as long as the galaxies at hand lie within a certain band in the space, where is the mass scale and is the scale radius that describe the NFW dark halo mass density profile (see Equation 2). This band is translated into a range of the allowed values for the cored galaxies, in the space, (where is the circular velocity at radius ), in Figure 7. The broken line in this figure indicates the state of the NFW halos, as given in ?. The range in allowed for Sersic-type galaxies is slightly more constricted, as compared to the cored galaxies.
To clarify, by these “allowed ranges”, we imply the ranges in and , over which the same and values are valid.
Thus, it is apparent that the mass modelling scheme that is being proposed here is applicable even to systems that may exhibit a significant range in concentration. At the same time, we note that dwarf galaxies which typically have kms-1 cannot be characterised by this formalism.
In addition to these constraints on the and , the galaxies also need to be “ordinary” in the sense that they should, qualitatively speaking, have a lower inner mass-to-light ratio than a higher at higher radii. However, if the galaxy at hand is known to have a central mass condensation from independent measurements (such as M87), the raw two-step profiles discussed above (described by a low and a ) will not be apt. We refer to such galaxies as “not ordinary” in this paper. For such a system, an alternative three-step, local mass-to-light profile can be conjured. In such a configuration, the value of the in the innermost region must be retained as high, while the intermediate range is envisaged to be described by a low . Outside of the second jump radius, the dark matter contribution is expected to kick in; therefore, the mass-to-light ratio in the outermost part should be held at a high value. The values of the in the different parts of such systems are not expected to be given according to the prescriptions mentioned above; nor are the two relevant jump radii in these cases, expected to be given as multiples of in the same way as for “ordinary” galaxies.
In general, the mass modelling of such systems are beyond the scope of the proposed formalism. Nevertheless, in Section 6, we will show how the basic concept behind our proposed mass modelling formalism can be extended to model M87, using whatever we know of the physics of M87, from literature.
6 M87
In this section, we present a mass model of the galaxy M87. We compare our results with the enclosed mass profile put forward by ? and the mass density of M87, suggested by ?.
M87 (NGC 4486) is a cD galaxy that lies near the centre of the Virgo cluster. It has been extensively studied both for the photometry of its stars and its globular cluster system (?) as well as for their kinematics; some of the latest investigations are due to ?, ?. M87 is marked by the existence of a central supermassive black hole (?, ?) and a dearth of dark matter in the outer parts; we configure the details of the raw profile accordingly.
Given that M87 is “not ordinary”, according to the prescription suggested in the previous section, it is expected to require a three step discontinuous raw profile, in which the local in the innermost step is high (in conjunction with the reported central supermassive black hole) and that in the intermediate and outermost steps are expected to be moderate and high respectively. However, given that M87 has been modelled with no dark matter halo in the past (?), with most of its dark matter being that of Virgo, it makes sense for us to maintain the same value of the local in the outer two steps (at least upto the radius to which photometric information is available). Thus, the raw profile is rendered two stepped and we are required to judiciously choose the jump radius that marks the end of the regime where the influence of the central black hole dominates. The details of the choice of this raw profile are discussed below:
-
•
is chosen to be 0.2; the ACS surface brightness profile of M87 indicates a steepening of the profile from about 0.2 inwards.
-
•
Outside the central 0.2, the mass to light ratio is considered to be constant, with a moderately large value of about 10. This is maintained till the end of the radial range to which the photometric data extends (about 100), which is just slightly higher than the of about 96. We find that the allowed range of this intermediate is 6 to 13.
-
•
The observed central line-of-sight velocity dispersion of M87 (?) is about 400kms-1. This translates to an enclosed mass of about 1.6109M⊙. Comparison with photometry implies a local central of about 200.
Now, let us discuss the predicted mass models for M87, against which the recovered profile is checked. ? adopt an orbit modelling approach to infer the mass density, from measurements of velocities of stars (to about 1.5 effective radii) and globular clusters (to about 5 effective radii). The available surface brightness and kinematic observations of the stars and globular clusters over assorted radial ranges were used in this work. ? use the Schwarzschild orbit library method to work with generalised mass models that include a contribution from the luminous matter; this is represented by the luminosity density that is scaled by the . The dark matter density is considered to be NFW type. The fitting is conducted on the joint constraints from the stellar and globular cluster velocity data, in a Jeans equation formalism. In this work, the availability of only one component of the velocity vector (the line-of-sight component), must render a wide range of solutions possible.
The best fit model from ? is presented in the right panel in Figure 8 in green. Even this best fit model is reported to suffer from the ailment that the values of the normalisation of the M87/Virgo mass profiles, as obtained from the stellar and globular data sets separately, are unequal. This could be explained by either a larger, less concentrated halo or by the relaxation of the assumption of sphericity. In fact, the ACSVCS image of M87 shows clearly that the eccentricity in M87 is not zero; the eccentricity is seen to dip sharply in the inner regions and then appears to tend towards a maximum of about 0.4, as radius increases.
The dynamical analysis of the radial velocities of 278 globular clusters of M87 is presented in ?. The total (projected) radial range spanned by the kinematic data set of ? extends from about 36 to about 6.5 effective radii. This kinematic data is then fed into the Jeans equation under the assumption of a spherical geometry. In order to evade the problem of mass-anisotropy degeneracy, ? take the distribution of the total mass of M87 and the Virgo cluster that was deduced by ?. This enclosed mass distribution is shown in black in the left panel of Figure 8. In this model, the dark matter is assigned wholly to the cluster.
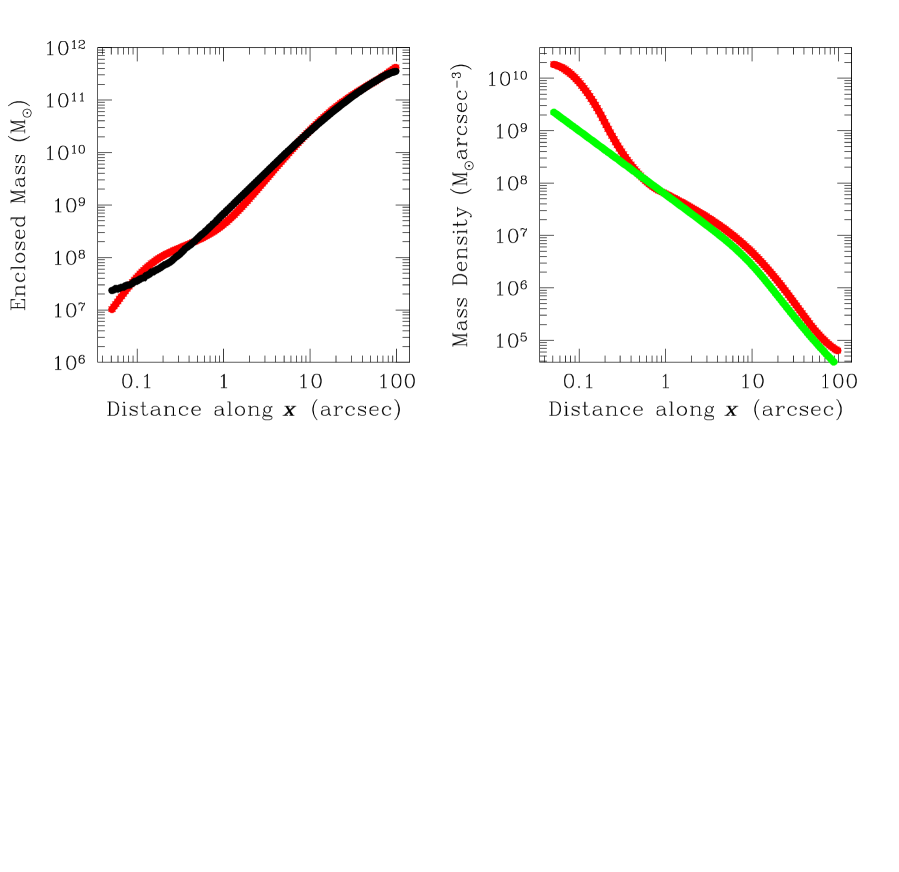
The surface brightness and eccentricity profile of M87, observed as part of the ACS Virgo Cluster Survey were used as inputs to DOPING which recovered a luminosity profile for the galaxy. When the inferred light distribution is scaled by the two step profile discussed above, and the consequent discontinuous mass density distribution is smoothed (according to the smoothing prescription suggested in Section 2.3.4; smoothing filter size corresponds to ). The smoothed mass density profile is used to extract the enclosed mass profile, which is compared to the enclosed mass distribution of M87 that has been predicted by ? (see Figure 8). The comparison appears favourable indeed though the comparison of the recovered mass density to that predicted by ? is less encouraging in the central parts of the galaxy. This discrepancy however does not reflect badly on our mass modelling technique since the density predicted by ? is also in deficit of the enclosed mass predictions of ?, due to the lack of inclusion of a central black hole in their model.
7 Summary and Conclusions
We propose a scheme to retrieve the total mass density to about 3 times the effective radius in ellipticals, using nothing but photometry and the central velocity dispersion: the exact two measurements that are most commonly available for most galaxies. The basic framework of this formalism relies upon the construction of a two-step, discontinuous, local profile, which is chosen to suffer its discontinuity at 3. Here, is the major-axis coordinate equivalent of the effective radius, as defined in terms of the fitting of the observed brightness profile to the de’Vaucouleurs law. Prescriptions are offered for constraining the inner and outer amplitudes of this sought two-step profile. While is found to lie within an allowed range of mass-to-light values for a given estimate of the central mass-to-light in the system, is fixed for a given , for a galaxy of a given shape. The details of the prescriptions are found to differ slightly, depending on whether the observed surface brightness is noted to be cored or Sersic in nature.
This formalism is designed to accommodate for the usual problems that are associated with our lack of knowledge of the state of anisotropy in the system and deviations from sphericity. Thus, the measured central velocity dispersion is implemented in the virial theorem to pin down the (local) central mass-to-light ratio, but the possibility of miscalculating the same due to anisotropy always exists. However, this mistake can be covered for, to some extent, in the sense that as long as the true central mass-to-light ratio () lies within a range above the estimated central (parametrised by ), the recovered mass density profile is found to be compatible with the true distribution. This range is given as 2, the central luminosity density of which is normalised to 100 L⊙pc-3. If on the other hand, the brightness profile is Sersic type, the normalisation factor is 1000 L⊙pc-3 and for the only Sersic model that was explored, the upper bound on the allowed range for is relatively more constricted, viz. 1.65 times . A one-to-one relationship between and exists in both cases.
Such a prescription can fail if the degree of anisotropy in the centre of the system is so high that the virial estimate of the central mass density is rendered different from the true central density by a factor in excess of 2 in the case of cored galaxies and 1.65, for Sersic galaxies. The good news is that when this happens, the formalism can indicate the same; such configurations cannot be handled by the proposed scheme. However, it is unlikely that the galaxy will be this anisotropic at the centre since a careful analysis of a sample of over 2000 galaxies in SDSS indicates that the dynamical mass enclosed with 1 is about 1.82 times the virial mass estimate, as given in Equation 5 (using the result of ?).
An important factor that dictates the success of our mass modelling scheme is smoothness of dispersion profiles in real galaxies. As ? suggested, the largest variations in normalised dispersions occur in galaxies, either in the inner parts () or at radii exceeding 2. In the radial range of , the variations in dispersion profiles is reported to be less than 5. ? suggest that the profile starts to pick up around 0.5-2. This uniform dynamical characteristic of real ellipticals is exploited in the production of the formalism.
7.1 Core Fitting Method
At this point, it merits mention that though one part of the proposed mass modelling technique resembles King’s core fitting method (?, ?) in some way, the whole of the advanced technique is very different from the core fitting method. The resemblance lies in the invoking of the virial theorem in the extraction of the mass that lies enclosed within a pre-fixed radius; in our work, this is the minimum radius () at which a velocity dispersion measure is available. In the implementation of the virial theorem, isotropy and sphericity are assumed, as in the core fitting method.
But the essential difference between the two methods lies in the fact that while the virial estimate of the mass is advanced as the answer in the core-fitting method, in our method, this mass is used to spot the range of allowed values that correspond to this estimate. In other words, given a virial estimate of the mass within , we attempt to decipher the range of values within which the true central (local) lies. The availability of a range in this offers some respite from the difficulties caused by the possible existence of anisotropy, which the core-fitting method is not safeguarded against; in fact, it appears from work done with real galaxies that this respite is realistic indeed. Moreover, our method would forewarn us in case the system is so severely anisotropic that the method would fail. The core-fitting method has no such inbuilt safeguard.
Most importantly, once we have chosen our , (which then fixes ), smoothing is implemented. The smoothed mass density distribution is then found to correspond to a local profile that is found to be different from the choice of , in the inner parts of the galaxy. The whole of the distribution, from to , is rendered affected by the overall smoothing. This is clearly borne by the Figure 4. On the other hand, the in the central parts of the galaxy, as found from the core-fitting method, would of course be just what the virial estimate indicates.
All in all, we can say that our method does invoke the virial theorem to translate velocity dispersion information into an enclosed mass value, as is done in the core-fitting method, but in our technique, we then go ahead to refine that virial estimate in multiple ways, unlike in the core-fitting method. The proposed mass modelling formalism is applicable to aspherical galaxies that are at least as anisotropic in the centre as massive ellipticals in the SDSS, even when these systems bear constant surface brightness cores, and it provides a mass distribution over a radial range extending to about 3 times the effective radius. The core-fitting method is much more constrained in the sense that it provides the mass profile only in the central regions of galaxies that do not harbour a constant surface brightness core and which when aspherical and/or anisotropic, cause the estimated mass distribution to be erroneous.
7.2 The Case of M87
The fundamental motivation for the raw two-stepped local profile to be ascribed a low inner and high outer amplitude is to replicate the anticipated trend of the dark matter kicking in at large radii (3 and higher). But if a system is known (from independent measurements) to harbour a central mass condensation then the innermost radial range should be assigned a high local indeed. Such is the case for the galaxy M87. Additionally, M87 is known to be a cD galaxy lying at the centre of Virgo. Thus, it can be modelled as being bereft of any dark matter, with all the dark matter ascribed to Virgo itself (?). Such information about the reported state of the matter distribution in M87 can motivate us to model this galaxy, using our mass modelling scheme, with a two step profile in which the inner amplitude is high, compared to the rest of the radial range covered by photometry. Once we configure our raw profile in this way, the recovered mass distribution in M87 is found to closely follow the mass models predicted for M87 from earlier studies. Thus, the proposed technique relies upon the inclusion of as much measured information about the galaxy at hand, as is possible.
7.3 Connection between luminous dark matter densities
Once is constrained, is fixed; this correlation between and depends on whether the system is cored or Sersic. A full investigation was done with the cored galaxies that were normalised to a central luminosity density of 100 L⊙pc-3, to suggest that
Similar analysis performed with a toy Sersic brightness profile revealed that is again related to via an exponential decay though a more thorough investigation needs to be undertaken to appreciate the dependence of this relation on the Sersic parameters.
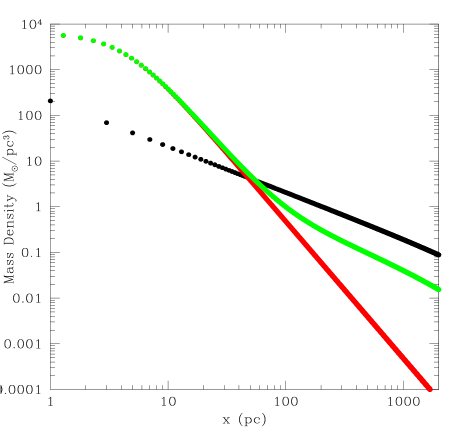
The fact that the local mass at 3 in our toy ellipticals is related uniquely to the mass near the centre, betrays a relationship between the dark matter and luminous matter content in these systems. Given that the total mass density in these models has a contribution from an NFW-type dark halo and times a (cored or Sersic) luminosity density profile, (where is a scalar), such a relationship is not altogether unexpected. As shown in Figure 9, it is clear that in the inner regions () the total mass density is dominated by the shape of the underlying luminosity density profile, while the dark halo predominates in the outer regions (). Thus, when the luminous mass is low, the dark mass is high and the vice versa. This trend manifests itself into the exponential decay of the outer value as the inner is increased. It must be kept in mind that this relationship between and is in the context of the mass-to-light distribution, while the Figure 9 refers to the situation in the smoothed configuration.
Such a fall-off is also expected for the Sersic galaxies, though the exact nature of the trend with an intrinsic scale length (such as the core radius in case of the cored galaxies) would expectedly differ. But of course, that our recovered profiles exhibit this exponential fall-off, indicates the success of our modelling.
7.4 Limitations Outreach
The more pertinent question is, how general is this trend between the local at the centre and at 3. In other words, how convincing is the idea that in general there is a quantifiable connection between the luminous matter density in elliptical galaxies and the dark matter content at approximately 3 times the effective radius?
The answer obviously depends on the genericness of the models that we have consulted in our work. As far as the amplitude of the model luminosity densities are concerned, it has been constrained to a value that is typical of the order of magnitude of the central density of real ellipticals. Also, a range of core radii has been scanned successfully in our cored models. Though a range of Sersic type model brightness profiles have not been scanned, the trends noted with the single model Sersic galaxy that was considered here, appear similar in nature to those found for the cored models. Thus, it seems possible that the inner and outer in the raw two-stepped profile will be connected even in the Sersic case, with the exact nature of this connection given by parameters intrinsic to the brightness distribution.
All this corroborates the generality of our models. At the same time it needs to be appreciated that the success of the procedure depends on the conformity of a real elliptical galaxy to the toy models that were used to set up the rules that connect the inner and outer mass-to-light ratios. In particular, the surface brightness distribution of the real galaxy and the compatibility of its dark halo to the NFW form need to be checked. In fact for each unique family of brightness profiles, a different rule connecting and is expected to exist. In this paper, we presented the same for cored galaxies that were normalised to the same central luminosity density and found a similar trend with one toy Sersic galaxy. An extensive study of toy Sersic galaxies is underway, to form a rule similar to the one prescribed in Equation 7. This proposed project will also include an investigation of the effect of changing the nature of the dark matter distribution in the model galaxies, on this rule. Thus, this method can potentially provide a simple automated way of deciphering mass profiles of a large sample of elliptical galaxies.
Thus one important conclusion of this paper is that a connection exists between the inner luminous matter and the dark matter density at about 3 in cored ellipticals and perhaps also in Sersic galaxies. This notion, though encouraged by intuition, needs to be cultivated better in order to ascertain the physical origin of the accompanying parametrisation.
Similar relationships have been explored in the context of disk galaxies; some of more recent works include contributions from ?, ? and ?. In these studies and the many more that preceeded them, a relationship was noted between the characteristics of the rotation curves and the optical luminosities of disk galaxies. Investigations along similar lines are of course not possible with ellipticals but studies of samples of ellipticals in various catalogues have been undertaken to understand mass distribution in early type systems (?, ?, ?, among others). The mass modelling technique that is advanced in this paper is one way to pursue the same question, over larger radial ranges than are typically covered in these studies (about 3 effective radii as compared to 1).
Given the simplicity of this method and the twosome observational input required, (which are readily provided by most catalogues, including the SDSS), a future project (?) is planned in which the construction of the mass build up in the nearby universe will be attempted.
Acknowledgements
The author is indebted to Michael Merrifield, Chris Conselice and Dolf Michielsen for their helpful comments, and to the anonymous referee whose criticisms and comments helped to shape the work better. The author is funded by a Royal Society Fellowship.
References
- [Bertola et al.¡1993¿] Bertola F., Pizzella A., Persic M., Salucci P., 1993. ApJ, 416, 45L.
- [Binney & Tremaine¡1987¿] Binney J., Tremaine S., 1987. Galactic Dynamics, Princeton University Press Princeton New Jersey.
- [Buote et al.¡2002¿] Buote D. A., Jeltema T. E., Canizares C. R., Garmire G. P., 2002. ApJ, 577, 183.
- [Chakrabarty & Ferrarese¡2006¿] Chakrabarty D., Ferrarese L., 2006. AJ, , submitted to AJ.
- [Chakrabarty & Portegies Zwart¡2004¿] Chakrabarty D., Portegies Zwart S., 2004. AJ, 128, 1046.
- [Chakrabarty & Saha¡2001¿] Chakrabarty D., Saha P., 2001. AJ, 122, 232.
- [Côté et al.¡2001¿] Côté P., McLaughlin D., Hanes D., Bridges T., Geislẽr D., Merritt D., Hesser J., Harris G., Lee M., 2001. ApJ, 559, 828.
- [Côté et al.¡2003¿] Côté P., McLaughlin D. E., Cohen J. G., Blakeslee J. P., 2003. ApJ, 591, 850.
- [Ferrarese et al.¡2006¿] Ferrarese L., Côté P., Jordan A., Peng E. W., Blakeslee J. P., P. S., Mei S., Merritt D., Milosavljević M., Tonry J. L., West M. J., 2006. ApJS, 164, 334.
- [Gebhardt et al.¡2000¿] Gebhardt K., Bender R., Bower G., Dressler A., Faber S. M., Filippenko A. V., Green R., Grillmair C., Ho L. C., Kormendy J., coauthors ., 2000. ApJ, 539, 13L.
- [Genzel et al.¡2000¿] Genzel R., Pichon C., Eckart A., Gerhard O. E., Ott T., 2000. MNRAS, 317, 348.
- [Gerhard et al.¡2001¿] Gerhard O., Kronawitter A., Saglia R. P., Bender R., 2001. AJ, 121, 1936.
- [Hoekstra, Yee & Gladders¡2004¿] Hoekstra H., Yee H. K. C., Gladders M. D., 2004. ApJ, 606, 67.
- [King¡1966¿] King I. R., 1966. AJ, 71, 64.
- [Lintott, Ferreras & Lahav¡2006¿] Lintott C. J., Ferreras I., Lahav O., 2006. ApJ, 648, 826.
- [Macchetto et al.¡1997¿] Macchetto F., Marconi A., Axon D. J., Capetti A., Sparks W., Crane P., 1997. ApJ, 489, 579.
- [Mamon & Łokas¡2005¿] Mamon G. A., Łokas E. L., 2005. MNRAS, 362, 95.
- [McLaughlin¡1999¿] McLaughlin D., 1999. ApJ, 512, L9.
- [Merritt¡1993¿] Merritt D., 1993. ApJ, 413, 79.
- [Merritt¡1996¿] Merritt D., 1996. AJ, 112, 1085.
- [Michielsen & Chakrabarty¡2006¿] Michielsen D., Chakrabarty D., 2006. MNRAS, , in preparation.
- [Napolitano et al.¡2005¿] Napolitano N. R., Capaccioli M., Romanowsky A. J., Douglas N. G., Merrifield M. R., Kuijken K., Arnaboldi M., Gerhard O., Freeman K. C., 2005. MNRAS, 357, 691.
- [Noordermer¡2006¿] Noordermer E., 2006. ApJ, , in preparation.
- [Padmanabhan et al.¡2004¿] Padmanabhan N., Seljak U., Strauss M. A., Blanton M. R., Kauffmann G., Schlegel D. J., Tremonti C., Bahcall, N. A.and Bernardi M., Brinkmann J., Fukugita M., Ivezić ., 2004. New Astronomy, 9, 329.
- [Romanowsky & Kochanek¡2001¿] Romanowsky A. J., Kochanek C. S., 2001. ApJ, 553, 722.
- [Romanowsky et al.¡2003¿] Romanowsky A. J., Douglas D. N., Arnaboldi M., Kuijken K., Merrifield M. R., Napolitano N. R., Capaccioli M., Freeman K. C., 2003. Science, 301, 1696.
- [Romanowsky et al.¡2004¿] Romanowsky A. J., G. D. N., Kuijken K., Merrifield M. R., Arnaboldi A., Napolitano N. R., Merrett H., Capaccioli M., 2004. In: Dark Matter in Galaxies, Proc. IAU Sumposium 220, 165, eds Ryder S., Pisano D. J., Walker M., Freeman K., ASP, San Francisco.
- [Rood et al.¡1972¿] Rood H. J., Page T. L., Kintner E. C., King I. R., 1972. ApJ, 179, 627.
- [Sancisi¡2004¿] Sancisi R., 2004. In: International Astronomical Union Symposium no. 220, 233, eds Ryder S. D., Pisano D. J., Walker M. A., Freeman K., ASP, San Francisco.
- [Strom et al.¡1981¿] Strom S. E., Strom K. M., Wells D. C., Forte J. C., Smith M. G., Harris W. E., 1981. ApJ, 245, 416.
- [van der Marel¡1994¿] van der Marel R. P., 1994. MNRAS, 270, 271.
- [Verheijen¡2001¿] Verheijen M. A. W., 2001. ApJ, 563, 694.
- [Zepf et al.¡2000¿] Zepf S. E., Beasley M. A., Bridges T. J., Hanes, D. A.and Sharples R. M., Ashman K. M., Geisler D., 2000. AJ, 120, 2928.