Multi-Band Bar/Bulge/Disk Image Decomposition of a Thousand Galaxies
Abstract
The structural parameters of bulges, disks and bars of a sample of nearly 1000 nearby galaxies are being determined through sophisticated image decomposition in the , and bands. The sample is carefully drawn from the Sloan Digital Sky Survey Data Release 2 (SDSS DR2), contains 963 galaxies, of which 407 host AGN, and we show that it is representative of the galaxy and AGN populations in the local universe. A large number of other physical properties have also been determined for these galaxies within the SDSS collaboration. With these data, we reinforce several recent studies and find a number of results leading to new insights into how the different galaxy components relate to each other and the extent to which the hosts galaxies of AGN differ from quiescent galaxies.
keywords:
galaxies: active, galaxies: photometry, galaxies: structure1 Sample and Image Decomposition
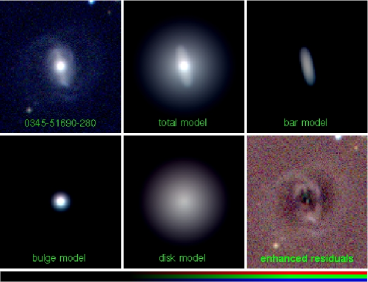
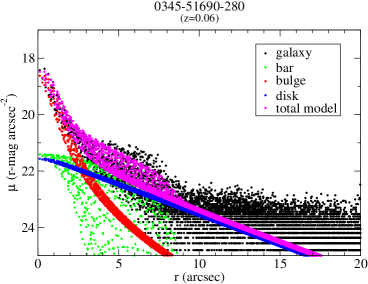
The galaxies in our sample are at and have M⊙. In order to obtain most reliable results, our sample was selected to be suitable for image decomposition: galaxies are close to face-on (), are not morphologically disturbed, and have an apparent diameter larger than . The fits are done with the new version of budda ([de Souza et al. 2004]) and checked individually to avoid wrong results that can arise from automated procedures. The models include up to four components: bulge, disk, bar and central source. This allows fitting galaxies with bars without compromising bulge and disk parameters, and to take into account the contribution from type 1 AGN. Figure 1 shows an illustrative example.
2 First Results
Amongst our first main results, with of the sample analysed, we find that:
-
•
there is a correlation between the effective radius of the bulge and the 4000 Å break index Dn(4000), in the sense that smaller bulges have younger stellar populations (see also [Thomas & Davies 2006]);
-
•
the colours of bulges and bars are strongly correlated for galaxies of all bulge-to-total luminosity ratios (B/T). In fact, bulges and bars have similar colours. We are currently investigating whether this is a result of dust attenuation or colour gradients. We also find a correlation between the colours of disks and bulges that shows the same triangular pattern noted by [Kauffmann et al. (2006)] using ultraviolet colours. Blue bulges are almost always surrounded by blue disks, but galaxies with red bulges can have either blue or red disks. Finally, the correlation between bar and disk colours is weak, even for late-type galaxies, with low values of B/T. Bars are usually redder than their disks;
-
•
there is a gradual increase in B/T and stellar mass from star forming galaxies (B/T ) to composite systems (B/T ) and AGN hosts (B/T );
-
•
the median bar-to-total luminosity ratio is Bar/T regardless of AGN or star formation activity and the total stellar mass of the galaxy; Bar/T ranges from 0.01 to 0.3;
-
•
there is an anti-correlation between the effective radius of the bulge and the accretion rate onto the supermassive black hole in AGN hosts, parameterized as , in the sense that the hosts of the most powerful AGN have smaller bulges (see also [Heckman et al. 2004]). In addition, at a fixed bulge size, the hosts of the most powerful AGN have bluer disks, in consonance with the results in [Kauffmann et al. (2006)];
-
•
the effective radius of the bulge is the only structural parameter that shows a clear correlation with the accretion rate onto the black hole. The bulge Sérsic index and the bulge effective surface brightness show only weak trends. The accretion rate does not depend on any structural parameter of either the disk or the bar.
Acknowledgements.
This work is supported by the Deutsche Forschungsgemeinschaft priority program 1177 (“Witnesses of Cosmic History: Formation and evolution, of galaxies, black holes and their environment”), and the Max Planck Society.References
- [de Souza et al. 2004] de Souza, R.E., Gadotti, D.A. & dos Anjos, S. 2004, ApJS 153, 211
- [Heckman et al. 2004] Heckman, T. et al. 2004, ApJ 613, 109
- [Kauffmann et al. (2006)] Kauffmann, G. et al. 2006, ApJS in press (astro-ph/0609436)
- [Thomas & Davies 2006] Thomas, D. & Davies, R. 2006, MNRAS 366, 510