The rest-frame -band luminosity function of galaxies in clusters to
Abstract
We derive the rest-frame -band luminosity function for galaxies in 32 clusters at using deep m and m imaging from the Spitzer Space Telescope InfraRed Array Camera (IRAC). The luminosity functions approximate the stellar mass function of the cluster galaxies. Their dependence on redshift indicates that massive cluster galaxies (to the characteristic luminosity ) are fully assembled at least at and that little significant accretion takes place at later times. The existence of massive, highly evolved galaxies at these epochs is likely to represent a significant challenge to theories of hierarchical structure formation where such objects are formed by the late accretion of spheroidal systems at .
1 Introduction
Clusters of galaxies are important for studies of galaxy formation and evolution, because they contain a volume limited population of galaxies observed at the same cosmic epoch. They therefore provide a well-defined sample of objects to cosmologically significant lookback times whose member galaxies can be identified by simple counting statistics, without need for extensive spectroscopic surveys or multi-color data.
One important characteristic of early type galaxies in clusters is that they are known to follow tight color-magnitude relations, which appear to be universal and to have very small intrinsic scatter to the highest redshifts yet observed (Visvanathan & Sandage, 1977; Bower et al., 1992; Stanford et al., 1995, 1998; Blakeslee et al., 2003; Lopez-Cruz et al., 2004; Holden et al., 2004; Mei et al., 2006a, b). Together with the conventional interpretation of the color-magnitude relation as a mass-metallicity correlation (e.g., Trager et al. 2000), this implies that the majority of the stellar populations in early-type cluster galaxies were formed via rapid dissipative starbursts at . Fundamental plane studies of high redshift cluster galaxies also support this conclusion, at least for the more massive objects (van Dokkum & Stanford, 2003; Wuyts et al., 2004; Holden et al., 2005), although the low mass galaxies seem to have undergone more extended star formation histories (Poggianti et al., 2001; Nelan et al., 2005; Jørgensen et al., 2005).
Theoretically, the existence of such massive and old galaxies at high redshift should represent a severe challenge to models where galaxies are assembled hierarchically, from a sequence of major mergers at progressively lower redshifts (e.g., Coles 2005; Springel et al. 2005; Baugh 2006 for recent reviews). It is not possible, however, to exclude by spectrophotometry alone, that these galaxies are assembled from sub-units whose star formation has already ceased, but which are not accreted until later times (similar to the so-called ‘dry’ mergers – van Dokkum et al. 1999; Tran et al. 2005). This is assumed to be the main channel by which spheroids grow at in the hierarchical scenario.
On the other hand, if galaxies are formed via mergers, we should observe a steady decrease of the mean stellar mass in galaxies as we go to higher lookback times and the most massive members of the merger tree branch into ever smaller twigs (De Lucia et al., 2006; Maulbetsch et al., 2006). While it is generally difficult to measure galaxy masses, the -band luminosity function is believed to provide an adequate surrogate (Kauffmann & Charlot, 1998), as the rest frame or luminosity of galaxies is seen to correlate well with stellar and even dynamical mass for local samples (Gavazzi et al., 1996; Bell & de Jong, 2001) and even for high redshift galaxies (Drory et al., 2004; Papovich et al., 2005; Caputi et al., 2006).
In our previous work (De Propris et al., 1999) we showed that the observed (ground-based) -band luminosity of galaxies in clusters was consistent with pure passive evolution of objects formed at high redshift and argued that this implied that the majority of the stellar mass was completely assembled by at least . More recent luminosity function studies have essentially confirmed and extended this picture of early galaxy assembly in clusters (Kajisawa et al. 2000; Nakata et al. 2001; Massarotti et al. 2003; Kodama & Bower 2003; Toft, Soucail & Hjorth 2003; Ellis & Jones 2004; Toft et al. 2004; Bremer et al. 2006; Lin et al. 2006; Strazzullo et al. 2006). Andreon (2006) recently derived a composite 3.6m luminosity function for galaxies in clusters in the XMM-LSS survey (at a mean redshift of 0.5), finding that the results are consistent with the previous ground-based results.
Ideally, we would wish to carry out this experiment in the rest frame -band, as even the ground-based -band starts starts to sample the rest-frame optical at . The Spitzer Space Telescope (Werner et al., 2004) InfraRed Array Camera (Fazio et al., 2004a) is now capable of obtaining panoramic () images at m with Jy sensitivity and allows us to study the rest-frame -band luminosity function of cluster galaxies at high redshift.
Here, we present a study of 32 clusters up to in both the m and m bands and derive the evolution of the rest-frame -band galaxy luminosity function, which is a close proxy for the stellar mass function. We adopt the cosmological parameters , and H km s-1 Mpc-1.
2 Data Reduction and Photometry
The sample consists of 32 clusters at . Data were obtained with IRAC in all four filters, using 5 dithered frames of 200s each. Here we discuss observations in the m and m filters, which map more closely to the rest-frame -band at the redshifts of our clusters.
Table 1 shows a list of clusters and some relevant properties. Most of the sample comes from the ROSAT Deep Cluster Survey (RDCS – Rosati et al. 1998), while a few others derive from other X-ray or optical surveys (see table for details), but the target selection is somewhat heterogeneous, especially for the higher redshift objects. On the other hand, De Propris et al. (2003) and Popesso et al. (2005) have shown that the -band galaxy luminosity function does not depend on cluster properties such as the velocity dispersion, Bautz-Morgan type or richness and De Propris et al. (1999) found no difference in the ground-based -band luminosity function of clusters selected by density and X-ray luminosity.
The IRAC data were reduced following standard procedures. The raw (BCD) data were first corrected for known IRAC artifacts associated with bright stars (mux-bleed and column pulldown). Then the SSC (Spitzer Science Centre) MOPEX software was used to mosaic the individual frames into a registered mosaic, with cosmic rays removed. This mosaiced image for each cluster and for each band has a pixel scale which is 1.414 times smaller than the original IRAC pixel scale, and the orientation rotated by .
Photometry was carried out using the Source Extractor software (Bertin & Arnouts, 1996). We experimented with various values for the background level and the deblending threshold, because Spitzer images have relatively poor angular resolution ( FWHM for stellar sources) and because our fields are moderately crowded.
In order to deal with the moderate crowding, we checked that the poorer resolution of Spitzer data does not significantly affect our detection and photometry. We verified the detections visually, both on the original image and on the aperture image produced by Sextractor. We also compared photometry in , and Kron apertures, extrapolated to total magnitudes, to check that objects were properly deblended. These tests provide confidence that our photometry is not significantly affected by the crowding, although to fully address this issue will require higher resolution imaging.
3 Number Counts for Cluster Galaxies
We chose to measure magnitudes in fixed (radius) apertures, which were calibrated on to the Vega system and extrapolated to infinity following Fazio et al. (2004b) to produce total magnitudes. This is done for consistency with the apertures used by Fazio et al. (2004b) to derive galaxy number counts in IRAC bands, which we use for background subtraction. We then counted objects (stars and galaxies) in 0.5 magnitude wide bins within a circular aperture of radius 1 Mpc, centred on the brightest cluster galaxy (where the cluster density is higher with respect to background). These systems tend to lie at or near the peak in galaxy density and the centre of the X-ray isophotes. Ideally, we would wish to choose an aperture based on the cluster structural parameters (e.g., ) but the IRAC field size is not sufficiently large to derive a reliable profile for the cluster galaxy distribution. Since it is unlikely that the few bright galaxies at large cluster-centric radii may affect the luminosity function parameters significantly, and since there is little evidence that the luminosity function varies with distance from the cluster centre, at least for bright galaxies (De Propris et al. 2003, Lin, Mohr & Stanford 2004, Popesso et al. 2005), our choice of a 1 Mpc aperture should not affect our conclusions.
We estimated the contribution of background galaxies to the observed counts by using the m and m counts of Fazio et al. (2004b). We fitted a low-order polynomial to the literature counts to smooth the effects of large scale structure along the lines of sight of the background fields. Errors were assumed to be Poissonian, while the clustering contribution was calculated following Huang et al. (1997) and Driver et al. (2003). The Poisson errors for the cluster counts and the background contribution and the clustering errors for the field contribution were then added in quadrature as appropriate.
Because of the low resolution of Spitzer data, we are not able to discriminate easily between stars and galaxies. There are no published star count models for Spitzer passbands. We estimated the stellar contribution using the predicted band counts from the Besançon model of the Galaxy (Robin et al., 2003). These give a good fit to the star counts reported by Fazio et al. (2004b) in the Extended Groth Strip and QSO 1700 fields.
Table 2 shows the raw number counts, estimated background contribution, stellar contamination and corrected number of (statistical) cluster members to the limiting apparent magnitude we use for both IRAC bands. The limiting magnitude is designed to reach the same absolute magnitude in all clusters (in two broad redshift ranges – see discussion below), such that the cluster counts in the faintest bin are still significantly above the predicted contamination. At the same time, the brighter magnitude limit (typically around 18th magnitude) reduces the effect of crowding, which is most significant for the fainter galaxies. This limit is found to lie below the knee of the luminosity function and in the regime where the counts are fitted by a power law.
There are some objects where the level of contamination from foreground stars is high or which have low number counts. These objects are identified in Table 2 and not used in our analysis. In practice, we choose objects where the residual cluster counts (after removal of background galaxies and stars) are higher than 50 in the m band for the sample (where this band is closer to the rest-frame ) and larger than 25 for the sample in the m band (i.e., where this passband better probes the rest-frame ) - Cl0848.9+4452 is an exception to this, as we have only 1/4 of the field of other clusters. We remark that there is no evidence for the actual existence of our highest redshift target (QSO1215-00), suggesting that the structure identified by Liu et al. (2000) consists of a small group or filament.
The actual counts for each cluster suffer from small number statistics. Rather than recovering the luminosity function from Bayesian methods (e.g., Andreon, Punzi & Grado 2005) we use composite luminosity functions, in order to average errors out (c.f. Andreon 2006). We create composite luminosity functions for clusters in two redshift bins, at and , in both bands, following the procedure described by Colless (1989). We bin galaxies in 0.5 magnitudes wide absolute magnitude bins in rest-frame , adopting the cosmology specified above and a -correction derived using the models of Bruzual & Charlot (2003) to transform from the observed IRAC bands to rest-frame . We choose to sample these two redshift bins for the following reasons. Most previous studies, starting from De Propris et al. (1999) have studied clusters at ; only recently have adequate cluster samples at become available (e.g., Toft et al. 2003, 2004; Strazzullo et al. 2006). The two redshift bins we study sample the rest frame -band luminosity function of galaxies in these two regimes, i.e. both the reasonably well studied sample and the more recent clusters at higher redshift. Furthermore, the m band maps closely to rest frame for the interval, while the m band does the same for the regime.
The -correction used above assumes a solar-metallicity single stellar population formed at and with star formation declining exponentially with an e-folding time ) of 0.1 Gyr, and is computed independently for each Spitzer band, which is thus transformed to rest-frame . This is done (rather than more complex approaches using both IRAC bands to derive the rest-frame luminosity) to present the data more directly and with a minumum of model dependencies. The -corrections used are presented in Table 3 (the full version is available electronically, while we only show the first ten lines of the table for guidance here). We experimented with several ‘reasonable’ values of from instantaneous star formation to 1 Gyr e-folding time bursts and found that this makes little difference to the actual value of the -correction.
The resulting composite luminosity functions are fitted with a Schechter function, using a downhill simplex algorithm. Figure 1 shows the data in each bin and the best fitting luminosity functions. Table 4 shows the derived values for the luminosity function in both bands. The errors in are marginal 1 errors derived by fixing the values of all other parameters at their ‘best’ value. The derived is also shown in Table 4, but we caution that the fit to the faint-end slope is very uncertain.
4 Discussion
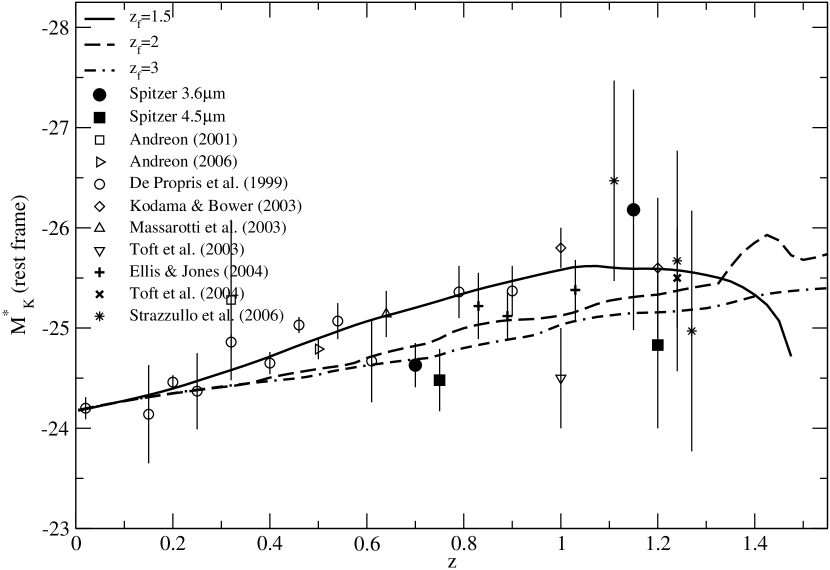
Figure 2 shows the rest-frame band for our composite clusters, together with previous ground-based band data, corrected to rest-frame following the same procedure as above, and a Bruzual & Charlot (2003) model, with solar metallicity (Salpeter Initial Mass Function and Padova 1994 isochrones, as recommended by Bruzual & Charlot 2003) and variable formation epoch, with Gyr. The actual of choice of makes a difference only to the level of a few hundreds of magnitudes. Note that we are not attempting to actually fit models to the data shown in Fig. 2, but we are showing models with representative star formation histories to obtain upper limits to the epoch of mass assembly for these cluster galaxies.
The results shown in Fig. 2 imply that the majority of the stellar mass in elliptical galaxies is already assembled at least at : this is a strong upper limit to the epoch of galaxy formation in that the majority of the merger episodes (if any) must have taken place prior to this epoch. Taken at face value, these Spitzer data may indicate that the epoch of star formation in these objects is somewhat more recent () than indicated by some previous studies of the color-magnitude relation (Stanford et al., 1995, 1998; Blakeslee et al., 2003; Holden et al., 2004; Mei et al., 2006a, b; Holden et al., 2006) and the fundamental plane (Wuyts et al. 2004, but see Jørgensen et al. 2005). This may be due to the fact that, at , the population includes a fraction of lenticular galaxies, whose star formation histories are more extended than the brighter elliptical galaxies. Otherwise, our results are consistent with recent work (e.g. Holden et al. 2006) showing that massive ellipticals are in place at but are more general, as we make no morphological selection.
The latest hierarchical models (e.g., De Lucia et al. 2006), including AGN feedback, succeed in pushing back the epoch of major star formation to for the most massive objects, but still require most of the actual mass assembly to take place through dry mergers at later epochs; 50% of the mass in more massive galaxies () is assembled at , while the lower mass objects () may be formed at higher redshifts. This is not what we observe here, where the vast majority of the stellar mass in massive (approximately or greater, equivalent to a mass of , using the calibration shown in Gavazzi et al. 1996, which corresponds more closely to the virial mass - using stellar masses this is approximately ) galaxies appears to be in place at .
One possible caveat is that the theoretical models refer to the average ‘field’ environment, while we are observing massive clusters where the main process of hierarchical merging and collapse may have taken place at earlier epochs, as they lie in overdense regions. However, Maulbetsch et al. (2006) use a high-resolution N-body simulation to simulate how the mass assembly histories of galaxy-size haloes depend on environment and show that at the mass aggregation rate is 4 times higher than at present, and independent of environment, while galaxies in the densest (cluster-like) environments at undergo more rapid mass accretion. This suggests that we should be witnessing a much stronger evolution of the mean galaxy mass than observed here, even for cluster environments.
Our results are therefore largely inconsistent with the hierarchical picture. Not only are the stellar populations of these galaxies formed at high redshift (see Introduction), but they are also assembled into galaxies at comparatively high lookback times, arguing that star formation takes place in situ, in a manner reminiscent of the earlier monolithic collapse picture. Recently, it has been shown that this behavior largely holds for field ellipticals as well, at least to (Roseboom et al., 2006; Wake et al., 2006). Similarly, -selected studies in the field have also found a similar anti-hierarchical behavior (e.g., Cimatti et al. 2004 from the survey – see also the review by Renzini 2006 for the observed ‘top down’ buildup of massive ellipticals as opposed to the theoretically favored ‘bottom up’ scenario).
Because the power spectrum of density fluctuations in the Universe at the time of recombination is tilted to low masses in the scenario, hierarchical accretion is a necessary consequence of the hypothesis that galaxies are formed within cold dark matter haloes. The evidence presented here poses a severe challenge to the hierarchical formation scenario in that the observations show the opposite behavior to the theoretical predictions, with the more massive galaxies being already present at a lookback time of 65% of the Hubble time.
Note added in proof: D. Stern (priv. comm.) has obtained a deep Chandra image of QSO1215-00 and finds no evidence of diffuse X-ray emission.
Acknowledgements
We would like to acknowledge the anonymous referee for an informative report that helped make the paper clearer. We also thank Steve Willner for some comments on this paper. This work is based on observations made with the Spitzer Space Telescope, which is operated by the Jet Propulsion Laboratory, California Institute of Technology, under a contract with NASA. RDP acknowledges support from a PPARC grant while at the University of Bristol. SAS’s work was performed under the auspices of the U. S. Department of Energy, National Nuclear Security Administration by the University of California Lawrence Livermore National Laboratory under contract No. W-7405-Eng-48.
References
- (1)
- Andreon (2001) Andreon, S. 2001, ApJ, 547, 623
- Andreon et al. (2005) Andreon, S., Punzi, G., Grado, A. 2005, MNRAS, 360, 727
- Andreon (2006) Andreon, S. 2006, A&A, 448, 447
- Baugh (2006) Baugh, C. M. 2006, Rep. Prog. Phys. 69, 3101
- Bell & de Jong (2001) Bell, E. F. & de Jong, R. S. 2001, ApJ, 550, 212
- Bertin & Arnouts (1996) Bertin, E. & Arnouts, S. 1996, A&AS, 117, 393
- Blakeslee et al. (2003) Blakeslee, J. P. et al. 2003, ApJ, 596, L143
- Bower et al. (1992) Bower, R. G., Lucey, J. R., Ellis, R. S. 1992, MNRAS, 254, 601
- Bremer et al. (2006) Bremer, M. N. et al. 2006, MNRAS, 371, 1427
- Bruzual & Charlot (2003) Bruzual, G. & Charlot, S. 2003, MNRAS, 344, 1000
- Caputi et al. (2006) Caputi, K. I. et al. 2006, ApJ, 637, 727
- Cimatti et al. (2004) Cimatti, A. et al. 2004, Nature, 430, 184
- Coles (2005) Coles, P. 2005, Nature, 433, 248
- Colless (1989) Colless, M. M. 1989, MNRAS, 237, 799
- Deltorn et al. (1997) Deltorn, J.-M., Le Fevre, O., Crampton, D., Dickinson, M. 1997, ApJ, 483, L21
- De Lucia et al. (2006) De Lucia, G., Springel, V., White, S. D. M., Croton, D., Kauffmann, G, 2006, MNRAS, 366, 499
- De Propris et al. (1998) De Propris, R., Eisenhardt, P. R., Stanford, S. A., Dickinson, M. 1998, ApJ, 503, L45
- De Propris et al. (1999) De Propris, R., Stanford, S. A., Eisenhardt, P. R., Dickinson, M., Elston, R. 1999, AJ, 118, 719
- De Propris et al. (2003) De Propris, R. et al. 2003, MNRAS, 342, 725
- Dickinson (1995) Dickinson, M. 1995, in Galaxies in the Young Universe, ed. H. Hippelein, K. Meisenheimer, H.-J. Röser p. 144 (Berlin: Springer)
- Driver et al. (2003) Driver, S. P., Odewahn, S. C. Echevarria, L., Cohen, S. H., Windhorst, R. A., Phillipps, S., Couch, W. J. 2003, AJ, 126, 2662
- Drory et al. (2004) Drory, N., Bender, R., Feulner, G., Hopp, U., Maraston, C., Snigula, J., Hill, G. J. 2004, ApJ, 608, 742
- Ebeling et al. (2001) Ebeling, H., Jones, L. R., Fairley, B. W., Perlman, E.. Scharf, C., Horner, D. 2001, ApJ, 548, L23
- Ellis & Jones (2004) Ellis, S. C. & Jones, L. R. 2004, MNRAS, 348, 165
- Fazio et al. (2004a) Fazio, G. G. et al. 2004a, ApJS, 154, 10
- Fazio et al. (2004b) Fazio, G. G. et al. 2004b, ApJS, 154, 39
- Gavazzi et al. (1996) Gavazzi, G., Pierini, D., Boselli, A. 1996, A&A, 312, 297
- Gioia et al. (1990) Gioia, I. M., Maccacaro, T., Schild, R. E., Wolter, A., Stocke, J. T., Morris, S. L., Henry, J. P. 1990, ApJS, 72, 567
- Gunn et al. (1986) Gunn, J. E., Hoessel, J. G., Oke, J. B. 1986, ApJ, 306, 30
- Hattori et al. (1997) Hattori, M. et al. 1997, Nature, 388, 146
- Henry et al. (1997) Henry, J. P. et al. 1997, AJ, 114, 1293
- Holden et al. (2004) Holden, B. P., Stanford, S. A., Eisenhardt, P. R., Dickinson, M. 2004, AJ, 127, 2484
- Holden et al. (2005) Holden, B. P. et al. 2005, ApJ, 607, L83
- Holden et al. (2006) Holden, B. P. et al. 2006, ApJ, 642, L123
- Huang et al. (1997) Huang, J.-S., Cowie, L. L., Gardner, J. P., Hu, E. M., Songaila, A., Wainscoat, R. J. 1997, ApJ, 476, 12
- Jørgensen et al. (2005) Jørgensen, I., Bergmann, M., Davies, R., Barr, J., Takamiya, M., Crampton, D. 2005, AJ, 129, 1249
- Kajisawa et al. (2000) Kajisawa, M. et al. 2000, PASJ, 52, 61
- Kauffmann & Charlot (1998) Kauffmann, G. & Charlot, S. 1998, MNRAS, 295, L27
- Kodama & Bower (2003) Kodama, T. & Bower, R. G. 2003, MNRAS, 346, 1
- Lin et al. (2004) Lin, Y.-T., Mohr, J. J., Stanford, S. A. 2004, ApJ, 610, 745
- Lin et al. (2006) Lin, Y.-T., Mohr, J. J., Gonzalez, A. H., Stanford, S. A. 2006, ApJ, 650, L99
- Liu et al. (2000) Liu, M. C., Dey, A., Graham, J. R., Bundy, K. A., Steidel, C., Adelberger, K., Dickinson, M. 2000, AJ, 119, 2556
- Lopez-Cruz et al. (2004) Lopez-Cruz, O., Barkhouse, W., Yee, H. K. C. 2004, ApJ, 614, 679
- Maulbetsch et al. (2006) Maulbetsch, C., Avila-Reese, V., Colín, P., Gottlöber, S., Khalatyan, A., Steinmetz, M. 2006, ApJ, submitted, (astro-ph 0606360)
- Massarotti et al. (2003) Massarotti, M., Busarello, G., La Barbera, F., Merluzzi, P. 2003, A&A, 404, 75
- Mei et al. (2006a) Mei, S. et al. 2006a, ApJ, 639, 81
- Mei et al. (2006b) Mei, S. et al. 2006b, ApJ, 644, 759
- Nakata et al. (2001) Nakata, F. et al. 2001, PASJ, 53, 1139
- Nelan et al. (2005) Nelan, J. et al. 2005, ApJ, 632, 137
- Papovich et al. (2005) Papovich, C. et al. 2005, ApJ, 640, 92
- Poggianti et al. (2001) Poggianti, B. M. et al. 2001, ApJ, 563, 118
- Popesso et al. (2005) Popesso, P., Böhringer, H., Voges, W., Romaniello, M. 2005, A&A, 433, 415
- Popesso et al. (2006) Popesso, P., Biviano, A. Böhringer, H., Romaniello, M. 2006, A&A, 445, 29
- Renzini (2006) Renzini, A. 2006, ARA&A, 44, 141
- Robin et al. (2003) Robin, A. C., Reylé, S., Derrière, S., Picaud, S. 2003, A&A, 409, 523
- Romer et al. (2000) Romer, A. K. et al. 2000, ApJS, 126, 209
- Rosati et al. (1998) Rosati, P., della Ceca, R., Norman, C., Giacconi, R. 1998, ApJ, 492, L21
- Roseboom et al. (2006) Roseboom, I. et al. 2006, MNRAS, 373, 349
- Springel et al. (2005) Springel, V. et al. 2005, Nature, 435, 629
- Stanford et al. (1995) Stanford, S. A., Eisenhardt, P. R., Dickinson, M. 1995, ApJ, 450, 512
- Stanford et al. (1998) Stanford, S. A., Eisenhardt, P. R., Dickinson, M. 1998, ApJ, 492, 461
- Strazzullo et al. (2006) Strazzullo, V, et al. 2006, A&A, 450, 909
- Toft et al. (2003) Toft, S., Soucail, G., Hjorth, J, 2003, MNRAS, 344, 337
- Toft et al. (2004) Toft, S. et al. 2004, A&A, 422, 29
- Trager et al. (2000) Trager, S., Faber, S., Worthey, G., Gonzalez, J. 2000, AJ, 120, 165
- Tran et al. (2005) Tran, K.-V. H., van Dokkum, P. G., Franx, M., Illingworth, G. D., Kelson, D. D., Förster-Schreiber, N. M. 2005, ApJ, 627, L25
- van Dokkum et al. (1999) van Dokkum, P. G. et al. 1999, ApJ, 520, L95
- van Dokkum & Stanford (2003) van Dokkum, P. G. & Stanford, S. A. 2003, ApJ, 585, 78
- Visvanathan & Sandage (1977) Visvanathan, N. & Sandage, A. 1977, ApJ, 216, 214
- Wake et al. (2006) Wake, D. A. et al. 2006, MNRAS, 372, 537
- Werner et al. (2004) Werner, M. W. et al. 2004, ApJS, 154, 1
- Wuyts et al. (2004) Wuyts, S., van Dokkum, P. G., Kelson, D. D., Franx, M., Illingworth, G. D. 2004, ApJ, 605, 677
 |
 |
 |
 |
| Cluster | RA (J2000) | Dec. (J2000) | Redshift | Reference |
|---|---|---|---|---|
| RJ1120+43 | 11:20:07.5 | +43:18:05.0 | 0.60 | Romer et al. 2000 |
| RDCS1634.5+5724 | 16:34:27.6 | +57:22:51.8 | 0.61 | Rosati et al. 1998 |
| RDCS0046.3+8531 | 00:46:19.7 | +85:31:01.3 | 0.62 | ” |
| RDCS0440.5-1630 | 04:40:28.4 | :30:08.0 | 0.62 | ” |
| RDCS0542.8-4100 | 05:42:50.2 | :00:07.0 | 0.64 | ” |
| MS1610+66 | 16:10:47.8 | +66:08:41.0 | 0.65 | Gioia et al. 1990 |
| RDCS1936.0-4640 | 19:36:06.6 | :40:03.6 | 0.65 | Rosati et al. 1998 |
| RDCS0047.3+8506 | 00:47:14.8 | +85:06:02.0 | 0.66 | ” |
| RDCS2313.6+1415 | 23:13:34.5 | +14:15:15.5 | 0.67 | ” |
| RDCS2038.5-0125 | 20:38:29.1 | :25:11.7 | 0.68 | ” |
| RDCS2236.7-2609 | 22:36:42.7 | :09:30.0 | 0.70 | ” |
| RDCS2303.7+0846 | 23:02:47.5 | +08:44:07.4 | 0.73 | ” |
| GHO1322+30 | 13:24:48.2 | +30:11:14.0 | 0.75 | Gunn, Hoessel & Oke 1986 |
| RDCS1517.9+3127 | 15:17:56.3 | +31:27:27.0 | 0.75 | Rosati et al. 1998 |
| MS1137+66 | 11:40:22.3 | +66:08:15.0 | 0.78 | Gioia et al. 1990 |
| RDCS1350.8+6007 | 13:50:46.1 | +60:07:09.5 | 0.80 | Rosati et al. 1998 |
| RDCS0035.9+8513 | 00:35:55.2 | +85:13:20.0 | 0.81 | ” |
| RDCS1317.4+2911 | 13:17:21.4 | +29:11:25.0 | 0.81 | ” |
| RJ1716+67 | 17:16:49.6 | +67:08:30.0 | 0.81 | Henry et al. 1997 |
| RDCS0152.7-1357 | 01:52:43.7 | :57:21.0 | 0.83 | Rosati et al. 1998 |
| RDCS0337.4-3457 | 03:37:24.7 | :57:29.0 | 0.84 | ” |
| RJ1226+33 | 12:26:54.0 | +33:32:00.0 | 0.89 | Ebeling et al. 2001 |
| GHO1604+4304 | 16:04:23.2 | +43:04:44.0 | 0.90 | Gunn, Hoessel & Oke 1986 |
| 3C184 | 07:39:24.5 | +70:23:11.0 | 1.00 | Deltorn et al. 1997 |
| MG 2019.3+1127 | 20:19:18.0 | +11:27:10.0 | 1.00 | Hattori et al. 1997 |
| RDCS0910.7+5422 | 09:10:45.0 | +54:22:02.0 | 1.11 | Rosati et al. 1998 |
| 3C210 | 08:58:09.9 | +27:50:52.0 | 1.16 | J.-M. Deltorn, priv. comm. |
| 3C324 | 15:49:48.9 | +21:25:38.0 | 1.21 | Dickinson 1995 |
| RDCS1252.9-2927 | 12:52:54.2 | :27:07.0 | 1.24 | Rosati et al. 1998 |
| RDCS0848.9+4452 | 08:48:56.2 | +44:52:00.0 | 1.26 | ” |
| RDCS0848.6+4453 | 08:48:34.2 | +44:53:35.0 | 1.27 | ” |
| QSO1215-00 | 12:15:49.8 | -00:34:34.0 | 1.31 | Liu et al. 2000 |
| Cluster | ||||||||||
|---|---|---|---|---|---|---|---|---|---|---|
| 3.6m | 3.6m | 3.6m | 3.6m | 3.6m | 4.5m | 4.5m | 4.5m | 4.5m | 4.5m | |
| RJ1120+43 | 17.34 | 120 | 34.6 | 6.4 | 80.0 | 17.32 | 168 | 71.4 | 6.4 | 90.2 |
| CL1634+57a | 17.36 | 75 | 48.0 | 14.4 | 12.6 | 17.37 | 112 | 74.8 | 22.5 | 14.7 |
| CL0046+85a | 17.37 | 131 | 52.4 | 35.5 | 43.1 | 17.40 | 177 | 94.6 | 39.0 | 43.4 |
| CL0440-16 | 17.23 | 115 | 47.8 | 15.9 | 51.3 | 17.40 | 138 | 72.0 | 16.5 | 49.5 |
| CL0542-41 | 17.40 | 161 | 47.3 | 26.5 | 87.2 | 17.43 | 189 | 74.7 | 22.3 | 92.0 |
| MS1610+66 | 17.45 | 121 | 49.1 | 12.3 | 59.6 | 17.44 | 170 | 73.2 | 14.2 | 82.6 |
| CL1936-46a | 17.45 | 134 | 53.0 | 89.3 | 17.44 | 164 | 75.1 | 89.2 | ||
| CL0047+85a | 17.49 | 133 | 53.0 | 38.2 | 44.2 | 17.53 | 147 | 75.1 | 29.3 | 42.6 |
| CL2313+14 | 17.53 | 123 | 58.5 | 14.6 | 49.9 | 17.54 | 148 | 84.8 | 16.5 | 46.8 |
| CL2038-01 | 17.57 | 183 | 58.9 | 14.7 | 109.4 | 17.58 | 191 | 87.4 | 16.6 | 87.0 |
| CL2236-26 | 17.64 | 121 | 58.7 | 10.4 | 51.9 | 17.62 | 150 | 88.4 | 16.4 | 50.0 |
| CL2303+08a | 17.27 | 73 | 24.0 | 12.8 | 36.2 | 17.69 | 126 | 88.0 | 20.7 | 25.3 |
| CL1322+30 | 17.83 | 134 | 74.0 | 5.2 | 54.7 | 17.71 | 157 | 92.2 | 2.2 | 62.6 |
| CL1517+31a | 17.67 | 105 | 59.0 | 9.7 | 36.3 | 17.71 | 117 | 69.4 | 9.9 | 37.7 |
| MS1137+66 | 17.74 | 126 | 63.7 | 7.1 | 55.2 | 17.77 | 167 | 94.0 | 7.9 | 65.1 |
| CL1350+60 | 17.78 | 139 | 63.7 | 6.3 | 69.0 | 17.79 | 181 | 95.3 | 7.0 | 78.7 |
| CL0035+85 | 17.81 | 154 | 64.4 | 28.2 | 61.4 | 17.82 | 177 | 96.3 | 30.9 | 49.8 |
| CL1317+29 | 17.81 | 114 | 64.7 | 5.3 | 44.0 | 17.82 | 139 | 95.9 | 5.2 | 37.9 |
| RJ1716+67 | 17.81 | 167 | 64.4 | 19.8 | 82.8 | 17.82 | 184 | 97.3 | 22.2 | 64.5 |
| CL0152-13 | 17.85 | 161 | 67.1 | 6.0 | 87.9 | 17.82 | 189 | 97.5 | 6.8 | 84.7 |
| CL0337-34a | 17.88 | 106 | 67.7 | 12.8 | 25.5 | 17.84 | 144 | 97.0 | 14.6 | 32.4 |
| RJ1226+33 | 17.97 | 129 | 70.5 | 4.7 | 53.8 | 17.85 | 143 | 93.5 | 5.2 | 44.3 |
| GHO1604+4304a | 17.97 | 112 | 69.9 | 11.6 | 30.5 | 17.91 | 132 | 96.2 | 11.8 | 24.0 |
| 3C184a | 17.16 | 72 | 57.7 | 11.2 | 3.1 | 17.02 | 51 | 34.6 | 11.3 | 5.1 |
| AXJ2019.3+1127a | 17.16 | 146 | 69.8 | 75.6 | 0.6 | 17.02 | 134 | 35.0 | 98.0 | 1.0 |
| CL0910+54 | 17.37 | 59 | 33.7 | 5.8 | 19.5 | 17.12 | 72 | 38.7 | 5.1 | 28.2 |
| 3C210 | 17.32 | 62 | 29.1 | 20.7 | 12.2 | 17.18 | 74 | 40.7 | 6.1 | 27.2 |
| 3C324 | 17.43 | 71 | 35.1 | 8.5 | 27.4 | 17.24 | 73 | 41.6 | 8.7 | 22.7 |
| CL1252-29 | 17.41 | 102 | 35.1 | 15.8 | 39.0 | 17.27 | 93 | 45.9 | 16.0 | 37.1 |
| CL0848.9+4452b | 17.54 | 39 | 8.6 | 1.7 | 34.7 | 17.30 | 21 | 11.1 | 1.7 | 9.3 |
| CL0848.6+4453 | 17.54 | 69 | 34.4 | 6.5 | 28.1 | 17.30 | 79 | 46.3 | 6.7 | 26 |
| QSO1215-00aa Low number counts | 17.75 | 55 | 46.2 | 4.8 | 4.0 | 17.36 | 48 | 45.4 | 4.4 |
| Redshift | ||
|---|---|---|
| 0.01 | ||
| 0.025 | ||
| 0.05 | ||
| 0.075 | ||
| 0.1 | ||
| 0.125 | ||
| 0.15 | ||
| 0.175 | ||
| 0.2 | ||
| 0.225 |
| Redshift | (m) | (m) | ||
|---|---|---|---|---|
| 0.75 | ||||
| 1.15 |