The Inner Rim of YSO Disks: Effects of dust grain evolution.
Abstract
Dust-grain growth and settling are the first steps towards planet formation. An understanding of dust physics is therefore integral to a complete theory of the planet formation process. In this paper, we explore the possibility of using the dust evaporation front in YSO disks (‘the inner rim’) as a probe of the dust physics operating in circumstellar disks. The geometry of the rim depends sensitively on the composition and spatial distribution of dust. Using radiative transfer and hydrostatic equilibrium calculations we demonstrate that dust growth and settling can curve the evaporation front dramatically (from a cylindrical radius of about 0.5 AU in the disk mid-plane to 1.2 AU in the disk upper layers for an A0 star). We compute synthetic images and interferometric visibilities for our representative rim models and show that the current generation of near-IR long-baseline interferometers (VLTI, CHARA) can strongly constrain the dust properties of circumstellar disks, shedding light on the relatively poorly understood processes of grain growth, settling and turbulent mixing.
1 Introduction
Advances in long-baseline near-infrared interferometry have made it possible to study the inner regions of circumstellar disks at sub-AU scales. Early results (Millan-Gabet et al. 1999, 2001; Tuthill et al. 2001; Monnier & Millan-Gabet 2002) have shown that the dust disk gets truncated at a finite radius (determined by the luminosity of the central star and dust sublimation temperature) within which the temperature is too high for dust to survive. The truncated disk forms a ‘rim’ (Natta et al. 2001; Dullemond et al. 2001, hereafter DDN01) that subtends a significant solid-angle around the star and intercepts stellar photons, re-radiating predominantly in the near-IR. This rim naturally explains the near-IR excess observed in Herbig Ae systems.
Despite its success in accounting for the near-IR excess, the vertical rim model introduced in DDN01 has had a few weaknesses from the very outset. The flux received from a vertical rim is highly viewing-angle dependent, since the projected line-of-sight area of the rim changes rapidly with inclination angle. This implies that the near-IR spectral energy distributions (SEDs) of Herbig Ae/Be stars should be a strong function of inclination angle, but observations show that most Herbig Ae stars have similar near-IR excesses, independent of their inferred inclination angles (Natta et al. 2001; Dominik et al. 2003). Furthermore, the surface brightness distribution of a vertical rim will become highly asymmetric at inclination angles different from face-on. This asymmetry should be detectable by interferometers in the form of a closure-phase signal (Monnier 2000, and references therein), but recent studies (Monnier et al. 2006) do not detect significant closure-phase signals indicating that the geometry of the inner rim is not a vertical wall.
It appears that a mechanism that curves the inner rim is needed. Isella & Natta (2005) (hereafter IN05) studied the impact of density-dependent dust sublimation temperatures on the structure of the rim. Close to the mid-plane, where the densities are high, the dust sublimation temperatures are also high (Pollack et al. 1994), while as the densities begin to fall rapidly in the vertical direction the sublimation temperatures drop. The IN05 calculations show that this causes the inner rim to curve away from the surface of the star. Isella et al. (2006) found that a curved-rim model provides a substantially better fit to the visibilities and near-IR SEDs of a few Herbig Ae systems.
In this paper we look at another mechanism that could curve the rim on larger scales than the ones produced by a density-dependent dust sublimation model—namely, dust growth and settling. In the absence of strong turbulence, dust grains will settle towards the disk mid-plane with large grains settling lower and having a smaller scale height than small grains. Dust grains will also grow rapidly in the mid-plane due to the much higher densities (Dubrulle et al. 1995; Dullemond & Dominik 2004; Tanaka et al. 2005). The opacity in the mid-plane is thus dominated by large grains whereas small grains dominate the opacity higher in the disk photosphere. This transition in the nature of the opacity source along with dust sublimation curves the inner rim as described in Section 4. Near-IR interferometers with baselines several hundred meters long (e.g. CHARA, VLTI) can distinguish between the model presented in this paper and the IN05 model, shedding light on dust physics operating at sub-AU scales.
We have computed the structure of the dust evaporation front in a self-consistent manner for the first time in a 2-D geometry (photon scattering has not been included; for effects of scattering on the disk structure and SED see Dullemond & Natta 2003) using the radiative transfer code torus (Harries 2000). In the following section we describe the radiative transfer code, while in section 3 we perform a consistency check by comparing the results for a torus generated density-dependent dust sublimation model with IN05 results. In Section 4 we present results for the dust segregation model, followed by a summary of the results and conclusions in Section 5.
2 The Monte Carlo Radiative Transfer Code - TORUS
2.1 Description of grid and disk structure calculations
The calculations in this paper were performed using the torus Monte-Carlo radiative-transfer code (Harries 2000; Harries et al. 2004; Kurosawa et al. 2004). Radiative equilibrium is computed using Lucy’s (Lucy 1999) algorithm on a two-dimensional, cylindrical-cartesian adaptive-mesh grid. Storing the opacity and temperature information on an adaptive mesh has particular advantages for the problem considered here, since the accurate determination of temperatures and subsequent SEDs requires an adequate resolution of the effective disk photosphere, whose position is changing spatially both as the dust is sublimated and as the vertical structure of the disk changes as it is iterated towards hydrostatic equilibrium. Using adaptive-mesh refinement (AMR) we are able to subdivide cells near the disk photosphere as the calculation proceeds, ensuring the resolution is maintained at each step.
The initial density structure for the disk calculations is based on the canonical description of the -disk developed by Shakura & Sunyaev (1973), viz
| (1) |
where is the radial distance in the mid-plane, is some characteristic radius, is the distance perpendicular to the mid-plane, and is the scaleheight, given by
| (2) |
with parameters of and , giving a radial density dependence of the surface density of . The AMR mesh is divided such that the cells are logarithmically spaced in the radial direction and that there are at least 7 cells in the vertical direction per disk scale height . A sweep of the grid is then made to split cells further around the ( is optical depth calculated at 5500 Å) surface using the following algorithm: for each pair of adjacent AMR cells the individual optical depths across the cells are calculated ( and say, with referring to the more optically thick of the two). The more optically thick cell is subdivided providing that and , where and are parameters (typically 0.1 and 0.5 respectively). Should any cell in the grid be subdivided, the sweep is repeated until no new cells are added to the mesh.
Once the temperature (we assume that the disk is in local thermodynamic equilibrium and gas and dust are thermally coupled) and dust sublimation (see next section) structures have converged using the Lucy algorithm, the vertical disk structure is modified via the equation of hydrostatic equilibrium following a similar algorithm to that detailed by Walker et al. (2004). Briefly, and assuming disk mass is negligible compared to the central star, the equation of hydrostatic equilibrium is
| (3) |
where is the pressure and is the vertical component of the stellar gravity. Adopting an ideal gas equation of state (with for a standard molecular hydrogen-helium mixture) we get
| (4) |
The above equation can be solved for numerically on the AMR mesh since the vertical temperature structure is known from the radiative-equilibrium calculation. The vertical density structure is then renormalized to conserve the radial surface density profile detailed above. A self-consistent calculation for dust sublimation (see §2.2) and disk temperature followed by a hydrostatic equilibrium calculation is repeated until the disk density structure has converged. Convergence is typically achieved in four iterations. Images and SEDs are subsequently calculated using a separate Monte Carlo algorithm based on the dust emissivities and opacities (Harries 2000).
2.2 Implementation of Dust Sublimation.
In the models discussed here the shape of the inner rim is controlled by dust sublimation. Typical mid-plane densities in the dust sublimation region are of the order of g cm-3 in Herbig disks. In the mid-plane, an optical depth of unity for visible light photons (measured radially inward into the disk from the rim edge) corresponds to a length scale of AU. Therefore if we started sublimation runs with a grid that had the full dust opacity present, convergence towards equilibrium rim shape would be extremely slow. This is very similar to the problem encountered in photoionization codes, where neutral hydrogen opacity to ionizing photons is so large that starting from a neutral grid would take an impractical amount of CPU time for the Strömgren sphere to propagate outwards (Wood et al. 2004).
The solution that we adopt is also analogous to the one used in photoionization codes (Wood et al. 2004). The dust content is first reduced to a very low value in the computational grid for the circumstellar disk, to make each of the grid cells optically thin. Stellar photons then propagate through the disk and the temperature of grid cells is determined. Dust is added to cells that are cooler than the sublimation temperature in small steps of . The step size is a of (computed at 5500Å) for the first five dust growth steps. The step size is then increased logarithmically, first to , then to and so on until the appropriate gas to dust ratio is reached in each grid cell. The grid cell temperatures are recomputed after every dust growth step and the process is repeated until the shape of the dust sublimation region converges.
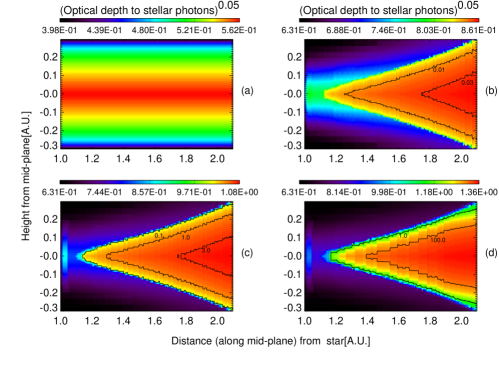
Figure 1 illustrates the dust-growth process in our computational scheme. The color scheme shows integrated optical depth, measured along lines perpendicular to the disk mid-plane. Panel-(a) is a grid for which the optical depth across each cell is . Panel-(b) is a cross section of the grid after the first dust growth step where across each cell is now . The cells have a of across them in panel-(c). The optical depth across each of the cells that lie away from the rim surface is 10 in panel-(d), whereas cells at the outer surface of the rim have been smoothed to resolve the surface. The geometry of the rim can considered to be ‘sublimation converged’ in panel-(d). Any further addition of dust does not significantly change the distance of the rim surface from the star. An appropriate amount of dust is put into each of the cells to reach a predetermined gas to dust ratio in the final dust growth steps. A hydrostatic equilibrium calculation as described in §2.1 is then performed. The dust growth and hydrostatic equilibrium calculations are repeated until convergence for the entire disk structure is reached (typically 4 iterations). In the next section we describe checks that ensure that this process gives accurate results.
3 Code testing against IN05 results
IN05 calculated inner rim models with astronomical silicate dust (Weingartner & Draine 2001), where the shape of the rim is set by the fact that the evaporation temperature of dust depends on gas density (Pollack et al. 1994). In this model, silicate grains sublimate at a higher temperature compared to other grains and hence fix the rim location. For silicate dust, the evaporation temperature can be parameterized as
| (5) |
where , and is the density of gas in g cm-3 (see IN05 eq. [16]). IN05 showed that this dependence of on gas density curves the inner rim.
In order to test the numerical scheme described in §2.2 we compared torus results for the rim with the IN05 results (kindly provided by A. Isella). Table 1 describes the properties of the star and the circumstellar disk used in the comparisons. Figure 2 shows the shape of the rim for large (1.2m) and small (0.1m) grains. The rim here is defined as the surface (for = 5500Å), calculated along radial lines from the central star towards the disk. Figure 3 compares the fraction of stellar luminosity re-emitted by the rim in infrared wavelengths (integrated over 1.25–7m) as computed by IN05 and torus.
Figures 2 and 3 show that that the torus results are consistent with the IN05 calculations at better than 15% level, giving us confidence in our Monte Carlo (MC) computations. We note that benchmark comparisons for MC codes, studying radiative transfer in optically thick disks (Pascucci et al. 2004), show a similar level of agreement among the various MC codes.
4 Rim curvature due to grain growth/settling
4.1 Model Description
The rim in the IN05 model is curved because of a density-dependent dust-evaporation temperature. In this section we describe an alternative model in which the dust sublimation temperature is kept fixed at 1400 K and rim curvature arises entirely because of dust growth and settling.
Small grains are much less efficient at cooling than large grains. If only single-sized grains are present, then at a given distance from the star, small grains will have a higher temperature than large grains. Under the assumption of a good temperature coupling between gas and dust (at densities characteristic of the rim region, this is a good approximation even in the disk photosphere; Kamp & Dullemond 2004), a mixture of small and large grains will be hotter than the case where only large grains are present. Combined with dust sublimation, this means that the location and shape of the inner rim will change depending on the relative fraction of small and large grains.
A number of observational (D’Alessio et al. 2001, 2006; Chiang et al. 2001; Rettig et al. 2006) and theoretical (Dullemond & Dominik 2004; Tanaka et al. 2005) results have shown that dust properties in circumstellar disks evolve with time. Small grains tend to coagulate into larger grains and settle towards the disk mid-plane, with the evolution of dust grain sizes occurring most rapidly in the disk mid-plane where the densities are high. In the absence of strong turbulence (the nature and strength of turbulence in circumstellar disks is not well understood), large grains will have a smaller scale-height than small grains. Thus grain growth and settling provide a natural means for changing the fraction of large and small grains as a function of height (‘dust segregation’) from the disk mid-plane. This will curve the rim as described in the previous paragraph.
As an illustration, we look at a model (henceforth ‘dust segregation model’) with silicate dust (Weingartner & Draine 2001). In order to simulate dust settling we fix the large (1.2m) grain scale height to be 60% of the gas scale height. We do not settle the small grains (0.1m) and their scale height is fixed to be the same as the gas scale height. As grains grow, the net mass of small grains decreases, while the net mass of large grains increases: we fix the mass of large grains to be 9 times the mass of small grains. All the the dust mass resides in the 1.2 & 0.1 m grain components and total mass of dust in the disk is chosen to be 1/100th of the total gas mass. The rim gets curved over a wide range of parameter choices. The curvature can be made stronger by increasing the relative fraction of small grains.
The above description leads to the following expressions for dust density:
| (6) |
| (7) |
where is the density of 1.2m grains, is the density of 0.1m grains, is the gas density in the mid-plane, is distance perpendicular to the disk mid-plane and is the gas scale height. The star and disk parameters are chosen as in Table 1 (the parameters are the same as in the IN05 models of section 3).
4.2 Geometry of the Dust Segregation Rim
4.2.1 Rim Shape
Figure 2 shows the shape of the inner rim for the dust segregation model. The curvature of the rim depends on the relative density fractions of large and small grains and the width depends on the sizes of the two dust components. A major finding here is that the dust segregation model can curve the rim on much larger scales than a density-dependent dust sublimation temperature (IN05) model. The surface is nearly vertical at the inner edge of the dust segregation model because of the fixed, density-independent dust sublimation temperature.
4.2.2 Analytic Estimate for Rim Shape
The most important dust parameter that determines the rim shape is , defined as the ratio of Planck mean opacities at the dust sublimation temperature and the stellar effective temperature (IN05). Using equations (6) and (7) and values of Planck mean opacities for 0.1m and 1.2m grains, (see appendix for a more general expression) for the dust segregation model is given by
| (8) |
Figure 4a shows as a function of mid-plane height. Corresponding to this , an effective dust size which has the same as the dust mixture, is plotted in Figure 4b.
A crude estimate for the rim shape in the dust segregation model can be obtained analytically. The dust destruction radius (see Calvet et al. 1991; Isella et al. 2006) is
| (9) |
is the dust evaporation temperature, is luminosity of the star in solar units and is a dimensionless diffuse heating term. characterizes the optical thickness of the rim to its own thermal emission.
The gas scale height at is estimated to be (see eqs. [7] and [8] from Chiang & Goldreich 1997)
| (10) |
where is the temperature of the bulk of the gas (assumed to be isothermal) and is mass of the star in solar masses.
Combining equations (8), (9), and (10), substituting for stellar parameters from Table 1 and setting K, the height of the evaporation front (see appendix for a general result) as a function of distance from the star along the disk mid-plane becomes
| (11) |
Figure 2 shows an analytic estimate for the rim shape (we assume a gas temperature of 1000 K and have set , Calvet et al. 1991). The analytic rim agrees with the torus dust segregation rim at the 30% level. The match at the inner edge of the rim can be improved by tuning the diffuse heating parameter , but the match at the outer edge remains poor because the analytic estimate is not self consistent and does not take into account the transition between the rim and the ‘shadow’ (see section §4.3.2) region beyond it.
4.3 Observables
4.3.1 SED
Figure 5 shows the infrared emission from the inner rim and the outer flared-disk component. There is significant emission over the stellar blackbody (denoted by the continuous line) from 1.5m onwards. The strength of the rim emission is approximately determined by the temperatures along the rim at optical depths of 2/3 (calculated at the wavelength of emission). Figure 3 in the IN05 paper shows that at a given optical depth, the small grain rim has a lower temperature than the large grain rim. Because of this temperature difference, near-IR emission in the small grain model gains strength at longer wavelengths compared to the large-grain and dust-segregation models.
4.3.2 Images and Visibilities
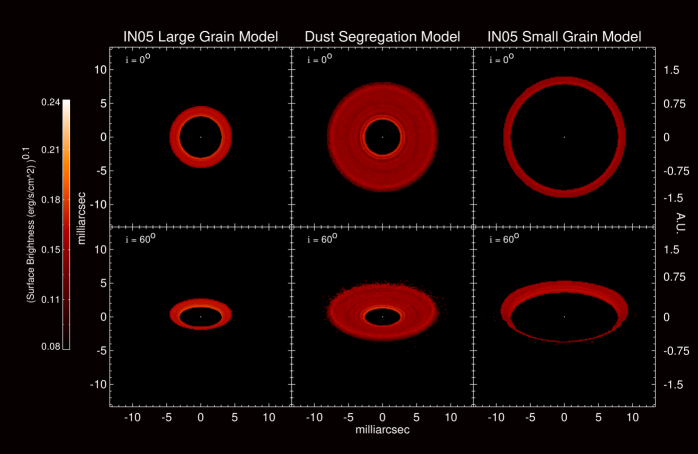
In order to illustrate the differences between the IN05 and dust segregation models we have computed synthetic images and visibilities for the different models. At 2.2m, all the emission comes from the rim and the central star. The panels in Figure 6 show 2.2m rim surface brightness for two inclination angles. As discussed previously, and is evident in Figure 6, the dust segregation rim is thicker than the IN05 rims. The dust segregation models also distinguish themselves observationally from the IN05 rims by their visibility curves. Figure 7 shows plots of 2.2m visibilities calculated along the disk major and minor axes. The visibilities at long baselines are more oscillatory in the IN05 models. The IN05 rims are also more skewed at large inclination angles which would give them a stronger closure phase signal (Monnier et al. 2006).
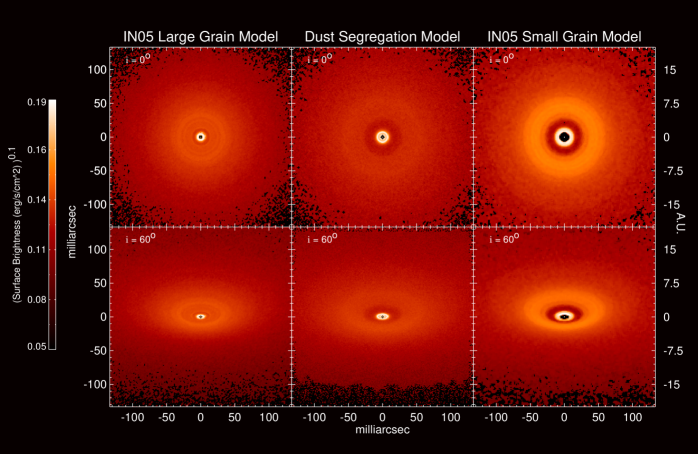
At 10.7m, emission comes from two distinct regions of the circumstellar disk as seen in Figure 8. The rim has a high surface brightness at 10.7m, but only contributes about 30-50% of the integrated light (more precisely 38% in the large grain model, 55% in the dust segregation model and 32% in the small grain model). In contrast to 2.2m emission, a large fraction of the emission at 10.7m comes from the flared disk (Kenyon & Hartmann 1987; Chiang & Goldreich 1997) region on larger scales. Between the inner rim and the flared disk, there is a ‘shadow region’ (Dullemond et al. 2001) which is not illuminated by the star directly. As discussed in van Boekel et al. (2005), the two distinct regions of emission cause a knee in the visibility curves (Figure 9). The size and shape of the knee is affected both by the inner rim as well as the flared disk structure (van Boekel et al. 2005).
van Boekel et al. (2004) studied the silicate feature in Herbig disks using mid-infrared interferometry (with VLTI-MIDI), and showed that dust on AU scales in Herbig disks has undergone significantly more thermal processing as compared to the dust at tens of AU scale. The discussion in this section demonstrates that the present generation of long-baseline near- and mid-infrared interferometers can be used to distinguish between inner-rim models, thus providing information on dust processes that take place on even smaller scales (sub-AU).
5 Discussion
The DDN01 model was introduced to explain the near-IR excess observed in Herbig Ae systems. The near-IR excess in this model comes from a vertical inner dust rim which is frontally illuminated by the central star. As discussed in section 1, the emission from a vertical rim geometry becomes highly skewed even at moderate line of sight inclination angles of the disk. Recent closure phase results on YSOs by Monnier et al. (2006) do not find any evidence for the large skewness in near-IR emission predicted by the DDN01 model. The Monnier et al. (2006) results favor the existence of curved inner dust rims and discount the vertical inner wall of DDN01. The first and only detailed calculation existing in current literature for rim curvature was performed by IN05, where the rim gets curved because of a density dependence of dust sublimation temperatures. Initial fits to data (Isella et al. 2006) seem to suggest that the curved rim-model provides a better fit to the visibilities and near-IR SEDs of a few Herbig Ae systems, although detailed comparisons have not been made yet.
In this paper we introduced a new mechanism based on dust growth and settling to curve the inner rim. As a consequence of growth and settling, opacity in the rim mid-plane will be dominated by large grains whereas small grains dominate the opacity higher up in the disk photosphere. Large grains can exist much closer to the star than small grains since they cool more efficiently (grain settling in the inner rim with large grains dominating the mid-plane opacity may be needed to explain near-IR SED and interferometry data on VVSer; Pontoppidan et al. 2006). A variation in grain size with disk scale height in the inner rim causes the rim to curve as shown in Figure 2. This curvature is on a much larger scale than the curvature produced in the IN05 models. Figures 7 and 9 show that the two models can be distinguished based on their visibility curves.
In the dust segregation model that we studied in section 4.1, the effects of dust growth and sedimentation on rim structure were calculated assuming that the dust sublimation temperature is independent of density. But in reality, both dust evolution and the density dependence of dust evaporation temperatures (INO5 model) probably simultaneously play a role in determining rim structure. We have shown that in the absence of strong turbulence the rim shape is predominantly determined by grain growth and settling. Adding a density dependence to dust sublimation temperatures will lower rim height (see Fig. 2) and extend it further into the disk by just a few tenths of an AU: a small perturbation compared to the effect of dust segregation on rim shape.
Calculations in this paper do not take into account effects of gas on dust rim geometry. Gas can affect the structure and location of the rim through accretion heating and by providing a source of opacity to stellar photons within the dust destruction radius. Akeson et al. (2005b) have shown that gas accretion heating might contribute significantly to the near-IR excess observed in some TTauri stars and play an important role in fixing the location of the dust destruction radius in these systems. Eisner et al. (2006) argue that emission from gas within the inner rim is needed to explain spectrally dispersed near-IR interferometry data on Herbig Ae/Be systems. The effects of gas on dust rim structure and observed near-IR excesses in YSOs is not well understood. Some theoretical efforts (see for e.g. Muzerolle et al. 2004) have been made in this direction but further progress would require detailed modeling of the relevant gas physics.
The dust rim in YSOs is a unique test-bed for theories of grain evolution. A number of observational results (D’Alessio et al. 2001, 2006; Chiang et al. 2001; Rettig et al. 2006) have found evidence for dust growth and settling in the outer regions (tens of AU scale) of YSO disks. In this work we show that long baseline near & mid-IR interferometry provide an opportunity for similar studies on the inner rim at sub-AU scale. Furthermore, if the gas within the inner rim were to emit significantly in the near-IR (gas emission is not well constrained and preliminary results from CHARA on AB Aur suggest that this might be important) , then the baselines of CHARA( 300m) are capable of partially resolving the hot gas emission, at-least for a few Herbig systems. Combined with accretion line diagnostics (Muzerolle et al. 2004), near-IR interferometry could help pin down the structure of the inner gas disk.
In the future, we will compare SED and interferometry data with our model predictions for the inner rim. This will constrain dust growth, settling and turbulent mixing parameters that recent theoretical simulations (Johansen & Klahr 2005; Fromang & Papaloizou 2006; Turner et al. 2006) have begun to predict. These simulations show that dust grains up to 100 microns in size are well mixed with gas within one scale height. In the extreme case of gas and dust being well mixed at all scale heights, the rim shape will be controlled entirely by the density dependence of dust evaporation temperatures. Long-baseline near-IR interferometry can distinguish between various dust mixing scenarios and furthermore, it might even be possible to observe the time evolution of grain sedimentation processes by examining the shape of the inner rim as a function of stellar age. Detailed comparisons between model predictions and data will also provide insight into the role played by gas.
6 Summary and Conclusions
We have described a Monte Carlo approach to calculating the structure of the inner rim in protoplanetary disks. The obvious advantage of this method over an analytic approach is that it allows for a self-consistent determination of the entire disk structure. Any effects of spatially varying dust properties on disk structure (and the resulting effects on SEDs and visibilities) can also be easily studied.
We have shown that dust growth and sedimentation may play a dominant role in determining the structure of the inner rim. The difference in cooling properties between grains of different sizes, combined with sublimation and a vertical gradient in dust sizes in the disk, leads to inner rims that are extremely curved (over scales 0.7 AU in cylindrical radius for an A0 star, see Figure 2). Synthetic images (Figures 6 & 8) and visibilities (Figures 7 & 9) for the rim models have been computed, highlighting differences between various theoretical models.
The inner rim dominates near-IR emission from circumstellar disks. Studies in the near-IR thus isolate the rim from rest of the disk and are therefore extremely powerful tools for characterizing rim properties. In the last decade or so, near-IR interferometers (Millan-Gabet et al. 1999, 2001; Eisner et al. 2003, 2004; Akeson et al. 2005b, a) have been used to determine the sizes of inner rims in a number of Herbig Ae/Be and TTauri stars. This has helped in establishing a tight correlation between the radii of the rims and the luminosities of the central stars (Monnier & Millan-Gabet 2002; Monnier et al. 2005). The current generation of near-IR interferometers (CHARA, VLTI) are capable of taking the next natural step—determining the geometry of the inner rims. As shown in this paper and IN05, the geometry of the inner rim is tied to multiple dust properties such as grain evolution, grain sedimentation (which depends on the strength of turbulence), and dust sublimation temperatures (IN05). Once the inner rim shape is constrained, mid-IR interferometry (as seen in Figure 8, both the rim and the flared disk region emit in the mid IR) can be used to assess the geometry of the outer, flared-disk component.
A significant number of Herbig Ae/Be stars have multi-wavelength (near-IR, mid-IR and mm-interferometry, and spectroscopy over a large wavelength range) data available. In the near future we will try to generate disk models that simultaneously fit interferometry and spectral data over multiple wavelengths for a small sample of stars. This will be a stringent test for current disk models and should help alleviate model degeneracy that plagues single-wavelength studies.
Appendix A Appendix
Here, we derive a general analytic formula for the rim shape of a dust segregation model (a case with specific numerical values for parameters, was discussed in section §4.2.2).
Let the densities of the two dust components in the circumstellar disk be given by
| (A1) |
| (A2) |
where and are the densities of large and small grains respectively and is the gas density in the mid-plane. and are normalization factors for the dust densities, is the height from the disk mid-plane, is the gas scale height and and are the scale heights for large and small grains as fractions of the gas scale height.
The ratio of Planck mean opacities at the dust evaporation temperature and the stellar effective temperature - , then becomes
| (A3) |
where and are Planck mean opacities for large and small grains at the specified temperatures, is the dust evaporation temperature and is the stellar effective temperature.
Neglecting local accretion heating, the dust destruction radius (see Isella et al. 2006; Calvet et al. 1991) is
| (A4) |
is luminosity of the star in solar units. B is a dimensionless diffuse heating term, characterizing the rim optical depth to its own thermal emission.
The gas scale height at is estimated to be (see eqs. [7] and [8] from Chiang & Goldreich 1997)
| (A5) |
where is the temperature of the bulk of the gas (assumed to be isothermal) and is mass of the star in solar masses.
Combining equations (A3), (A4), and (A5), the height of the evaporation front as a function of distance along the disk mid-plane from the star becomes
| (A6) |
where and are dimensionless terms given by
| (A7) |
| (A8) |
References
- Akeson et al. (2005a) Akeson, R. L., Boden, A. F., Monnier, J. D., Millan-Gabet, R., Beichman,C., Beletic, J., Calvet, N., Hartmann, L., Hillenbrand, L., Koresko, C., Sargent, A. & Tannirkulam, A. 2005b ApJ, 635, 1173
- Akeson et al. (2005b) Akeson, R. L., Walker, C. H., Wood, K., Eisner, J. A., Scire, E., Penprase, B., Ciardi, D. R., van Belle, G. T., Whitney, B. & Bjorkman, J. E. 2005a, ApJ, 622, 440
- van Boekel et al. (2004) van Boekel, R., Min, M., Leinert, Ch., Waters, L. B. F. M., Richichi, A., Chesneau, O., Dominik, C., Jaffe, W., Dutrey, A., Graser, U., Henning, Th., de Jong, J., Köhler, R., de Koter, A., Lopez, B., Malbet, F., Morel, S., Paresce, F., Perrin, G., Preibisch, Th., Pryzgodda, F., Schöller, M. & Wittkowski, M. 2004, Nature, 432, 479
- van Boekel et al. (2005) van Boekel, R., Dullemond, C. P. & Dominik, C. 2005, A&A, 441, 563
- Calvet et al. (1991) Calvet, N., Patino, A., Magris, C. G. & D’Alessio, P. 1991, ApJ, 380, 617
- Chiang et al. (2001) Chiang, E. I., Joung, M. K., Creech-Eakman, M. J., Qi, C., Kessler, J. E., Blake, G. A. & van Dishoeck, E. F. 2001, ApJ, 547, 1077
- Chiang & Goldreich (1997) Chiang, E., I. & Goldreich, P. 1997, ApJ, 490, 368
- D’Alessio et al. (2006) D’Alessio, P., Calvet, N., Hartmann, L., Franco-Hernandez, R. & Servin, H. 2006, ApJ, 638, 314
- D’Alessio et al. (2001) D’Alessio, P., Calvet, N. & Hartmann, L. 2001, ApJ, 553, 321
- Dominik et al. (2003) Dominik, C., Dullemond, C. P., Waters, L. B. F. M. & Walch, S. 2003, A&A, 398, 607
- Dubrulle et al. (1995) Dubrulle, B., Morfill, G., & Sterzik, M. 1995, Icarus, 114, 237
- Dullemond & Dominik (2004) Dullemond, C. P. & Dominik, C. 2004, A&A, 421, 1075
- Dullemond & Natta (2003) Dullemond, C. P. & Natta, A. 2003, A&A, 408, 161
- Dullemond et al. (2001) Dullemond, C. P., Dominik, C. & Natta, A. 2001, ApJ, 560, 957
- Eisner et al. (2003) Eisner, J. A., Lane, B. F., Akeson, R. L., Hillenbrand, L. A. & Sargent, A. I. 2003, ApJ, 588, 360
- Eisner et al. (2004) Eisner, J. A., Lane, B. F., Hillenbrand, L. A., Akeson, R. L. & Sargent, A. I. 2004, ApJ, 613, 1049
- Eisner et al. (2006) Eisner, J. A., Chiang, E. I., Lane, B. F. & Akeson, R. L. 2006, in press.
- Fromang & Papaloizou (2006) Fromang, S. & Papaloizou, J. 2006, A&A, 452, 751
- Harries (2000) Harries, T. J. 2000, MNRAS, 315, 722
- Harries et al. (2004) Harries, T. J., Monnier, J. D., Symington, N. H. & Kurosawa, R. 2004, MNRAS, 350, 565
- Johansen & Klahr (2005) Johansen, A.& Klahr, H. 2005, ApJ, 634, 1353
- Kurosawa et al. (2004) Kurosawa, R., Harries, T. J., Bate, M. R. & Symington, N. H. 2004, MNRAS, 351, 1134
- (23) Isella, A. & Natta, A. 2005, A&A, 438, 899
- Isella et al. (2006) Isella, A., Testi, L. & Natta, A. 2006, A&A, 451, 951
- Kamp & Dullemond (2004) Kamp, I. & Dullemond, C. P. 2004, ApJ, 615, 991
- Kenyon & Hartmann (1987) Kenyon, S. & Hartmann, L. 1987, ApJ, 323, 714
- Lucy (1999) Lucy, L. B. 1999, A&A, 344, 282
- Millan-Gabet et al. (2001) Millan-Gabet, R., Schloerb, F. P. & Traub, W. A. 2001, ApJ, 546, 358
- Millan-Gabet et al. (1999) Millan-Gabet, R., Schloerb, F. P., Traub, W. A., Malbet, F., Berger, J. P. & Bregman, J. D. 1999, ApJ, 513, L131
- Monnier et al. (2006) Monnier, J. D., Berger, J. P., Millan-Gabet, R., Traub, W. A., Schloerb, F. P., Pedretti, E., Benisty, M., Carleton, N. P., Haguenauer, P., Kern, P., Labeye, P., Lacasse, M. G., Malbet, F., Perraut, K., Pearlman, M. & Zhao, M. 2006, ApJ, 647, 444
- Monnier et al. (2005) Monnier, J. D., Millan-Gabet, R., Billmeier, R., Akeson, R. L., Wallace, D., Berger, J. P., Calvet, N., D’Alessio, P., Danchi, W. C., Hartmann, L. & 24 coauthors, 2005, ApJ, 624, 832
- Monnier (2000) Monnier, J. D., Principles of LongBaseline Stellar Interferometry, Course notes from the 1999 Michelson Summer School, Edited by P. R. Lawson (JPL Publication) 2000, 9, 203
- Monnier & Millan-Gabet (2002) Monnier, J. D. & Millan-Gabet, R. 2002, ApJ, 579, 694
- Muzerolle et al. (2004) Muzerolle, J., D’Alessio, P., Calvet, N., & Hartmann, L. 2004, ApJ, 617, 406
- Natta et al. (2001) Natta, A., Prusti, T., Neri, R., Wooden, D., Grinin, V. P. & Mannings, V. 2001, A&A, 371, 186
- Pollack et al. (1994) Pollack, J. B., Hollenbach, D., Beckwith, S., Simonelli, P. D., Roush, T. & Fong, W. 1994, ApJ, 421, 615
- Pontoppidan et al. (2006) Pontoppidan, K. M., Dullemond, C. P., Blake, G. A., Adwin Boogert, A. C., van Dishoeck, E. F., Evans, N. J., Kessler-Silacci, J. & Lahuis, F. 2006, ApJ, in press.
- Rettig et al. (2006) Rettig, T., Brittain, S., Simon, T., Gibb, E., Balsara, D. S., Tilley, D. A. & Kulesa, C. 2006, ApJ, 646, 342
- Shakura & Sunyaev (1973) Shakura, N. I. & Sunyaev, R. A. 1973, A&A, 24, 337
- Tanaka et al. (2005) Tanaka, H., Himeno Y., & Ida, S. 2005, ApJ, 625, 414
- Turner et al. (2006) Turner, N. J, Willacy, K., Bryden, G. & Yorke. H. W. 2006, ApJ, 639, 1218
- Tuthill et al. (2001) Tuthill, P. G., Monnier, J. D. & Danchi, W. C. 2001, Nature, 409, 1012
- Walker et al. (2004) Walker, C., Wood, K., Lada, C. J., Robitaille, T., Bjorkman, J. E. & Whitney, B. 2004, MNRAS, 351, 607
- Weingartner & Draine (2001) Weingartner, J. C. & Draine, B. T. 2001, ApJ, 548, 296
- Wood et al. (2004) Wood, K., Mathis, J., S. & Ercolano, B. 2004, MNRAS, 348, 1337
| Star | Circumstellar Disk | |||||
|---|---|---|---|---|---|---|
| Mass | 2.5 | Surface Density | ||||
| Disk outer-Radius | 200 AU | |||||
| Luminosity | 47 | Mass | 3.8 | |||
| Distance | 150 pc | |||||