Properties of the Radio-Emitting Gas Around SgrA*
Abstract
We show that the radial profiles of the temperature and density of the electrons as well as the magnetic field strength around the massive black hole at the Galactic center, Sgr A* , may be constrained directly from existing radio data without any need to make prior assumptions about the dynamics of the emitting gas. The observed spectrum and wavelength-dependent angular size of Sgr A* indicate that the synchrotron emission originates from an optically-thick plasma of quasi-thermal electrons. We find that the electron temperature rises above the virial temperature within tens of Schwarzschild radii from the black hole, suggesting that the emitting plasma may be outflowing. Constraints on the electron density profile are derived from polarization measurements. Our best-fit results differ from expectations based on existing theoretical models. However, these models cannot be ruled out as of yet due to uncertainties in the source size measurements. Our constraints could tighten considerably with future improvements in the size determination and simultaneous polarization measurements at multiple wavelengths.
I I. Introduction
The supermassive black hole at the Galactic center, Sgr A* , occupies the largest angle on the sky among all known black holes. Its extended image provides an excellent opportunity to study the physics of low-luminosity accretion flows.
The bolometric luminosity of Sgr A* is orders of magnitude smaller than the Eddington limit for its black hole mass of . Over the past decade various theoretical models have been proposed to explain the low luminosity of Sgr A* despite the large gas reservoir from stellar winds in its vicinity. Among the early models invoked was an Advection Dominated Accretion Flow (ADAF) involving hot protons and cold electrons with a low radiative efficiency at the Bondi accretion rate of Narayan et al. (1998). Subsequently, the detection of linear polarization was used to set an upper limit on the electron density near the black hole, which ruled out the original ADAF proposal Quataert & Gruzinov (2000a); Agol (2000); Macquart et al. (2006) and favored shallower density profiles with a lower accretion rate such as in a Convection Dominated Accretion Flow (CDAF) Quataert & Gruzinov (2000b). Later variants of the ADAF model allowed for outflows, namely mass loss from the inflowing gas Blandford & Begelman (1999). Most recently, an improved Radiatively Inefficient Accretion Flow (RIAF) model was proposed, involving substantial mass loss (although the outflowing mass is ignored in calculating the radio emission), a non-thermal component of electrons, and different electron and proton temperatures. Other models associated the radio emission with a jet Yuan et al. (2002) or a compact torus near the black hole Liu & Melia (2003).
In parallel to these modelling developments, the data on Sgr A* has improved dramatically over the past few years. The latest observations include new determinations of the size, spectral luminosity, polarization and rotation measure of the source as a function of wavelength Shen et al. (2005); Krichbaum et al. (2006); Marrone et al. (2007); Yuan (2006). With the rich data set that is now available, it is timely to remove any theoretical prejudice and ask: what does the data alone tell us about the properties of the radiating gas? In addressing this minimal question here, we deviate from past practice of modelers who made assumptions about the dynamics of the accreting gas before interpreting the observational data on Sgr A* . We avoid dynamical assumptions and attempt to constrain the properties of the radio-emitting gas directly from the data itself.
As discussed in detail in § II below, the measurements of the source size at different radio wavelengths provide crucial constraints on the properties of the gas surrounding Sgr A* . Current size measurements are unfortunately subject to large error bars, which in turn imply large uncertainties in the inferred gas properties. Our analysis provides an estimate of the spatial dependence of gas properties based on current measurements, adopting a frequency dependent size with (Shen et al., 2005; Krichbaum et al., 2006). Our methodology demonstrates how more accurate measurements may be used to obtain better constraints with no model-dependent assumptions about the dynamics of the gas.
In the different subsections of § II we apply our approach to various aspects of the data on Sgr A* that are currently available. We compare our results to previous work in § III. Finally, § IV summarizes our main conclusions.
II II. Empirical Constraints
II.1 II.1. Radio Spectrum and Size: Data
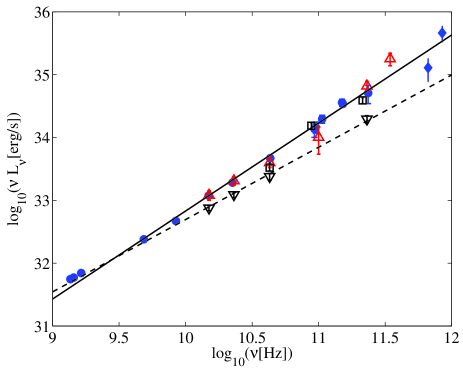
The spectral luminosity of SgrA* is time dependent. As illustrated in Fig. 1, the observed specific luminosity per unit frequency at the brighter emission epochs Falcke et al. (1998); Zhao et al. (2003) is well described by a power-law form in the frequency range of 3–1000 GHz,
| (1) |
where . Since the flux measured at the times used for size determination is close to the brighter emission values, we will use this power-law index in our phenomenological discussion.
We note that at low frequencies GHz the observed flux somewhat exceeds the flux given by Eq. (1) [equivalently, fitting a power-law only to the data at GHz would result in a fit that under-predicts the flux at higher frequencies (as indicated by the dashed line in Fig. 1), i.e. in a ”sub-mm excess”]. This deviation is of no significance to the analysis below, which focuses on higher frequencies, GHz. It does imply, however, that in applying our simple analytic results to the lowest observed frequencies, some minor quantitative modifications would need to be introduced. As explained below, we argue that the radio flux is dominated at different frequencies by plasma located at different radii. The deviation from Eq. (1) below GHz implies therefore that the gas temperature and magnetic field strength at large radii, cm, differ slightly from those obtained using our simple power-law scalings, which are based on Eq. (1).
As demonstrated in § II.2 below, measurements of the size of Sgr A* at various radio wavelengths provide important constraints on the emitting gas Shen et al. (2005); Bower (2006); Krichbaum et al. (2006). For a black hole mass of Eckart et al. (2004), the radial scale is set by the Schwarzschild radius of , which corresponds to an angle of 0.01 mas on the sky at our adopted distance of kpc. Table I presents the latest data from Krichbaum et al. (2006) and compares the inferred brightness temperature to the virial temperature 111For an optically thick source with a top-hat intensity distribution, the full-width at half-maximum (FWHM) of a Gaussian which contains the same flux fraction as the top-hat within the FWHM size is times the source diameter. We use this result when interprating the values quoted by Krichbaum et al. (2006) for the geometric mean of FWHM of the major and minor axes of the image of Sgr A* .. The brightness temperature 222Throughout the paper, we set Boltzmann’s constant to unity and express temperatures in energy units. at a radius from Sgr A* where the emissivity at an observed frequency peaks, is defined through the relation
| (2) |
where the geometric coefficient is the ratio between the emission surface area and the area of a sphere of radius ( for a sphere and for a two-sided disk with the same radius). We conservatively assume that the surface area scales as since this provides the lowest brightness temperature (which, as we will show, is already above the virial temperature at large radii). We define the virial temperature by equating the thermal kinetic energy of the plasma to half of the gravitational potential energy per proton,
| (3) |
where is the proton mass. (Note that the “escape temperature” at which the thermal kinetic energy of the plasma exceeds its gravitational potential energy is .) Using Eq. (1) and we obtain
| (4) |
| (5) |
where . Table I shows that must be close to at , and that there is preliminary evidence that increases with radius.
Shen et al. (2005) infer a power-law dependence of the intrinsic size of Sgr A* on wavelength of , with . For our phenomenological analysis we use
| (6) |
with , implying
| (7) |
| [mm] | [MeV] | [MeV] | |||
|---|---|---|---|---|---|
| 1.4 | 2.1 | ||||
| 3.4 | 0.88 | ||||
| 7 | 0.43 |
II.2 II.2. Radio Spectrum and Size: Implications
The observed radio luminosity originates most likely from synchrotron emission by relativistic electrons Goldston et al. (2005). The frequency dependence of source size implies that the emission cannot originate from an optically-thin plasma. To see this, consider the electrons at dominating the emission at a frequency . If the optical depth is small, then these electrons would produce a spectrum at , close to the observed spectrum at these frequencies. This implies that the emission at would be dominated by electrons at , which is inconsistent with the frequency dependence of source size. We therefore conclude that the optical depth for synchrotron self-absorption satisfies . For a similar reason, the characteristic synchrotron emission frequency of the electrons at [dominating the emission at a frequency ] must satisfy . If then for these electrons would produce a flux at , inconsistent with the observed spectrum, and for these electrons would produce a flux at , dominating the emission at in conflict with the frequency dependence of source size.
We therefore conclude that radiation at different radii is dominated by electrons with and that . Next, we argue that the electron energy distribution may be characterized by a single energy or an effective temperature . That is, we show that the energy distribution of electrons cannot be highly non-thermal. Consider, for example, a power-law distribution of electron energies, . Such a distribution would be consistent with observations provided that (rather than ), since otherwise the flux emitted by electrons at would extend beyond as , exceeding the observed flux. For , at , and the value of is constrained by the ratio between the far-infrared luminosity, erg/s at a frequency Hz Genzel et al. (2003); Ghez et al. (2004), and the radio luminosity, erg/s at Hz, to be . This large power-law index implies that only a small fraction of the total energy can be carried by electrons of energy exceeding that of the electrons dominating the radio emission. Moreover, we will show in § II.3 that the extension of such a power-law to electron energies much below that of the electrons dominating the radio emission would imply a very large rotation measure, inconsistent with observations 333One may postulate, of course, a power-law distribution with , which cuts off just above the energy of the electrons we observe (so as to avoid over producing the Hz flux). However, such a cut-off would be physically unnatural.. These constraints are satisfied by recent RIAF models Yuan et al. (2004); Yuan (2006) which associate only a small fraction of the total electron energy with a power-law component. However, our simple analysis shows that if thermal emission at different frequencies originates at different radii to account for the observed spectrum and size measurements, then there is no need for an ad-hoc non-thermal component.
Since the emission originates from an optically thick plasma, the characteristic temperature (energy) of the electrons dominating the radiation is
| (8) |
The electron temperature has to satisfy
| (9) |
where is the electron mass and we used the relation in which angular brackets denote an average over a relativistic Maxwellian of temperature . Based on Eqs. (6) and (5) this requirement implies
| (10) |
In deriving this result we have not used the inferred source size but only the fact that it is frequency dependent. Using the size estimate in Eq. (7) and , we then get
| (11) |
The scaling of the observed radiation frequency on emission radius implies MeV. In order for the synchrotron model to hold down to GHz, the electrons must remain relativistic, i.e. the condition must hold, implying or . It therefore appears that the value of Shen et al. (2005) is preferred over the alternative suggestion for higher values Bower (2006).
The results in Eqs. (7), (8) and (11) have several important implications. First, is close to at , and increases with radius approximately as for 444Note that for , which might still be consistent with observations Bower (2006), , but then which is physically implausible.. This implies that the gas cannot be confined to a thin disk and the flow geometry must be quasi-spherical. Moreover the radio-emitting gas is not likely to be flowing in but rather flowing out since its thermal kinetic energy exceeds the gravitational binding energy beyond a radius of a few tens of Schwarzschild radii (). Our conclusions would only be strengthened if the emitting plasma follows a jet geometry for which the surface area scales as with [see the discussion following Eq. (2)].
Finally, we note that the plasma under consideration is collisionless as the Coulomb collision time is much longer than the dynamical time of the gas s. However, collective plasma effects should operate Sharma et al. (2006) since the inverse of the plasma frequency or electron gyro-frequency are much shorter than the dynamical time. We use the term “temperature” in our discussion to characterize the typical electron energy even if the electron distribution function happens to be non-Maxwellian.
II.3 II.3. Density constraints: Opacity, Rotation Measure and Circular Polarization
The optical depth to synchrotron self-absorption is
| (12) |
giving
| (13) |
and
| (14) |
For the optical depth increases with radius, . In order to ensure that , it is sufficient to require that this condition will hold at , implying .
The relativistic rotation measure of a fluid of electrons with a thermal Lorentz factor and density threaded by a coherent magnetic field , is given by Quataert & Gruzinov (2000a). As long as is coherent, we may express this rotation measure in terms of as
| (15) | |||||
| (16) |
where we substituted . For , the rotation measure scales as and may be either decreasing or increasing with . In the latter case, the rotation measure is dominated at all frequencies by the same outermost electron shell, while in the former case it is dominated by electrons near the radius where radiation is emitted (and so it is expected to be larger for higher frequencies or smaller radii). The observed rotation measure of at a frequency of Hz (Ref. Marrone et al., 2007, and references therein), implies for a coherent -field that
| (17) |
Marrone et al. (2007) report measurements at Hz and Hz. While there is an indication that the rotation measure is higher at the higher frequency by a factor of few (see their Table I) the observations at the two frequencies are not simultaneous, and since the source is variable the differences may be due to variability. If the rotation measure differences are real and not due to the temporal variability, Eq. (16) requires
| (18) |
with the density decreasing with at least as steeply as . For this density (and ), the magnetic field and thermal energy densities are comparable at and . A turbulent magnetic field would generate a random walk in the net rotation measure and so the electron density inferred from the observations would increase by the square-root of the number of field reversals (coherent patches) along the region where the originates. The large linear polarization observed at frequencies GHz for Sgr A* implies that the inferred magnetic field is not highly tangled in the innermost region. The low level of linear polarization at lower frequencies is consistent with the notion that the emission at different frequencies originates from different radii.
For the electrons become mildly relativistic at cm, where the emission is predicted to peak around GHz. This may account for the circular polarization observed at these low frequencies Bower et al. (1999); Sault & Macquart (1999); Bower (2003).
Finally, we note that (as mentioned in § II.2) the observed excludes a power-law extension of the electron energy distribution, with , down to energies significantly lower than . The contribution of lower energy electrons to the rotation measure is proportional to . Using Eq. (15) and denoting by the minimum electron Lorentz factor we have , which implies for that the rotation measure would exceed the observed value of for .
II.4 II.4. Equipartition and Entropy
The equipartition ratio between the magnetic energy density and the thermal energy density of the electrons scales as
| (19) |
and the entropy scales as
| (20) |
Requiring uniform entropy and equipartition fraction gives which is surprisingly within the range inferred by Shen et al. (2005). This special value yields the scalings , , and . Substituting these power-law scalings in Eq. (16) implies that the rotation measure is nearly independent of emission radius or observed frequency. This result can be tested by future observations that would monitor the time dependence of at different frequencies Marrone (2007). A similar time dependence at different frequencies would imply that the rotation measure is dominated by a common outer shell.
III III. Comparison with earlier work
The RIAF models generically predict that the radio emission is dominated by thermal electrons near the innermost stable circular orbit (ISCO) in the central region of the accretion disk (Yuan et al., 2003). The radio spectrum produced in this model by the thermal electrons is inconsistent with the observed spectrum, which is well described by the power-law form in Eq. (1). A power-law electron component is therefore added to the thermal RIAF component in an ad-hoc manner, where the spectral index and normalization of the power-law component are tailored to match the low frequency radio data Yuan et al. (2004); Yuan (2006). We have pointed out in § II.2 that the size measurements indicate that the source size is frequency dependent, implying that the radiation is dominated at different frequencies by electrons at different locations. This in turn suggests that the observed spectrum reflects the spatial dependence of electron temperature rather than the energy distribution of the electrons at a single radius.
Since the emission of radiation in RIAF models is dominated by the innermost region of the disk, at cm, the observed size is dominated in these models by foreground interstellar scattering at all frequencies. The addition of a power-law electron component to these models increases slightly the intrinsic source size Yuan et al. (2006), but does not change the requirement that the measured source size will be dominated at all frequencies by interstellar medium scattering. These results appear to be at odds with the latest size measurements which indicate that the intrinsic size is resolved well beyond the expected level of interstellar image broadening at mm Krichbaum et al. (2006) and that the intrinsic size is smaller at higher frequencies.
As mentioned in the Introduction, existing size measurements are subject to large uncertainties. While our best-fit profiles disfavor existing models, such models cannot be ruled out based on current data. Future, more accurate, measurements will allow us to draw more decisive conclusions. Our current analysis underlines the importance of future improvements in the size measurements, and provides a methodology for interpreting future results.
IV IV. Summary
We have shown in § II.2 that measurements of the spectrum and of the wavelength-dependent size of the radio emission from Sgr A* indicate that this emission is dominated by optically-thick quasi-thermal plasma, and that the observed spectrum reflects the spatial dependence of the electron temperature (rather than the energy distribution of electrons at some particular radius). We have derived the electron temperature and magnetic field profiles [Eqs. (8) and (11)], and found that the electron temperature increases above the virial temperature beyond a distance of a few tens of Schwarzschild radii from the black hole. The observed rotation measure was then used to constrain the density profile [Eqs. (17) and (18)]. The low density inferred for the gas near Sgr A* could in principle be accounted for by winds from the innermost S-stars Loeb (2004). Although we have not proposed a dynamical model for the plasma, we have pointed out in § II.4 that observations are consistent with an isentropic gas profile and equipartition magnetic field.
Our results imply that the radio emitting gas cannot be confined to a thin disk and the flow geometry must be geometrically thick. Moreover, the radio-emitting gas is not likely to be inflowing but rather outflowing, since its thermal kinetic energy exceeds the gravitational binding energy beyond a radius of a few tens of Schwarzschild radii [, see Table I and Eq. (7)]. There may also be a colder accreting component that is sub-dominant in terms of its synchrotron emission. Such a component would likely be confined to a thinner disk geometry that would have only a limited effect on the rotation measure of the radiation emitted by the hot outflowing atmosphere above it. (However, if the cold component is optically-thick then it would make the image of SgrA* asymmetric at a level that would depend on the inclination of the disk. The resulting frequency dependence of the image centroid location could be constrained by observations.) An electron temperature profile which does not decline with increasing radius as fast as the virial temperature does, would be consistent with an adiabatic outflow in which the electrons are hotter than the protons because their relativistic temperature declines with decreasing density as with an adiabatic index () that is smaller than that of the protons (5/3). Heat conduction could also help to flatten the electron temperature profile Tanaka & Menou (2006).
The large uncertainty in the inferred source size, reflected by the large uncertainty in the index of the relation , translates to a large uncertainty in the temperature and magnetic field profiles, as implied by Eqs. (11) and (8). Our preliminary conclusions from existing data differ from current theoretical models Yuan (2006), although not at a statistically robust level. These potential discrepancies provide added incentive to obtain better data through future observations.
Finally, we note that the uncertainty in the determination of the density profiles is related not only to uncertainties in the source size measurements, but also to the lack of simultaneous multi-frequency measurements of the rotation measure (§ II.3). An accurate determination of the density profile would require therefore not only accurate size measurements, but also simultaneous multi-frequency measurements of the rotation measure. Ultimately, direct imaging of Sgr A* with a Very Large Baseline Array at sub-mm wavelengths Falcke et al. (2000); Broderick & Loeb (2006); Shen (2005) would resolve the accretion flow near the black hole ISCO and unravel unambiguously the properties of the emitting gas there.
Acknowledgments
We thank Avery Broderick, Dan Marrone, and an anonymous referee for useful comments on the manuscript. A.L. thanks the Weizmann Institute for its kind hospitality when this work was conducted. This work was supported in part by ISF and Minerva grants (E. W.) and the BSF foundation (A. L.).
References
- Agol (2000) Agol, E. 2000, ApJ Lett., 538, L121
- Blandford & Begelman (1999) Blandford, R. D., & Begelman, M. C. 1999, MNRAS, 303, L1
- Bower et al. (1999) Bower, G. C., Falcke, H., & Backer, D. C. 1999, ApJ Lett., 523, L29
- Bower (2003) Bower, G. C. 2003, Astrophys. & Space Sci., 288, 69
- Bower (2006) Bower, G. C. 2006, Journal of Physics Conference Series, 54, 370; Bower, G. C., Goss, W. M., Falcke, H., Backer, D. C., & Lithwick, Y. 2006, ApJ Lett., 648, L127
- Broderick & Loeb (2006) Broderick, A. E., & Loeb, A. 2006, Journal of Physics Conference Series, 54, 448 [astro-ph/0607279]; 2006, MNRAS, 367, 905
- Eckart et al. (2004) Eckart, A., Genzel, R., & Schödel, R. 2004, Progress of Theoretical Physics Supplement, 155, 159
- Falcke et al. (1998) Falcke, H., Goss, W. M., Matsuo, H., Teuben, P., Zhao, J.-H., & Zylka, R. 1998, ApJ, 499, 731
- Falcke et al. (2000) Falcke, H., Melia, F., & Agol, E. 2000, ApJ Lett., 528, L13
- Genzel et al. (2003) Genzel, R., Schödel, R., Ott, T., Eckart, A., Alexander, T., Lacombe, F., Rouan, D., & Aschenbach, B. 2003, Nature (London), 425, 934
- Ghez et al. (2004) Ghez, A. M., et al. 2004, ApJ Lett., 601, L159
- Goldston et al. (2005) Goldston, J. E., Quataert, E., & Igumenshchev, I. V. 2005, ApJ, 621, 785
- Krichbaum et al. (1998) Krichbaum, T. P., et al. 1998, A& A, 335, L106
- Krichbaum et al. (2006) Krichbaum, T. P., Graham, D. A., Bremer, M., Alef, W., Witzel, A., Zensus, J. A., & Eckart, A. 2006, Journal of Physics Conference Series, 54, 328 [astro-ph/0607072]
- Liu & Melia (2003) Liu, S., & Melia, F. 2003, Astronomische Nachrichten Supplement, 324, 475
- Loeb (2004) Loeb, A. 2004, MNRAS, 350, 725
- Macquart et al. (2006) Macquart, J.-P., Bower, G. C., Wright, M. C. H., Backer, D. C., & Falcke, H. 2006, ApJ Lett., 646, L111
- Marrone et al. (2007) Marrone, D. P., Moran, J. M., Zhao, J.-H., & Rao, R. 2007, ApJ Lett., 654, L57
- Marrone (2007) Marrone, D. P. 2007, private communication
- Tanaka & Menou (2006) Gruzinov, A. 2008, preprint astro-ph/9809265; Tanaka, T., & Menou, K. 2006, ApJ, 649, 345
- Narayan et al. (1998) Narayan, R., Mahadevan, R., & Quataert, E. 1998, Theory of Black Hole Accretion Disks, 148; Quataert, E., Narayan, R., & Reid, M. J. 1999, ApJ Lett., 517, L101
- Quataert & Gruzinov (2000a) Quataert, E., & Gruzinov, A. 2000, ApJ, 545, 842
- Quataert & Gruzinov (2000b) Quataert, E., & Gruzinov, A. 2000, ApJ, 539, 809; Narayan, R., Igumenshchev, I. V., & Abramowicz, M. A. 2000, ApJ, 539, 798
- Sault & Macquart (1999) Sault, R. J., & Macquart, J.-P. 1999, ApJ Lett., 526, L85
- Serabyn et al. (1997) Serabyn, E., Carlstrom, J., Lay, O., Lis, D. C., Hunter, T. R., & Lacy, J. H. 1997, ApJ Lett., 490, L77
- Sharma et al. (2006) Sharma, P., Hammett, G. W., Quataert, E., & Stone, J. M. 2006, ApJ, 637, 952
- Shen et al. (2005) Shen, Z.-Q., Lo, K. Y., Liang, M.-C., Ho, P. T. P., & Zhao, J.-H. 2005, Nature (London), 438, 62
- Shen (2005) Shen, Z.-Q. 2005, Journal of Korean Astronomical Society, 38, 261
- Yuan (2006) Yuan, F. 2006, Journal of Physics Conference Series, 54, 427 [astro-ph/0607123]
- Yuan et al. (2002) Yuan, F., Markoff, S., & Falcke, H. 2002, A& A, 383, 854; Falcke, H. & Markoff, S. 2000, Astron. & Astrophys., 362, 113
- Yuan et al. (2003) Yuan, F., Quataert, E., & Narayan, R. 2003, ApJ, 598, 301
- Yuan et al. (2004) Yuan, F., Quataert, E., & Narayan, R. 2004, ApJ, 606, 894
- Yuan et al. (2006) Yuan, F., Shen, Z.-Q., & Huang, L. 2006, ApJ Lett., 642, L45
- Zhao et al. (2003) Zhao, J.-H., Young, K. H., Herrnstein, R. M., Ho, P. T. P., Tsutsumi, T., Lo, K. Y., Goss, W. M., & Bower, G. C. 2003, ApJ Lett., 586, L29
- Zylka et al. (1995) Zylka, R., Mezger, P. G., Ward-Thompson, D., Duschl, W. J., & Lesch, H. 1995, A& A, 297, 83