∎
Tel.: +41-22-379-2166, Fax: +41-22-379-2133
22email: Marc.Audard@obs.unige.ch 33institutetext: S. Skinner 44institutetext: University of Colorado 55institutetext: M. Güdel 66institutetext: Paul Scherrer Institut 77institutetext: T. Lanz 88institutetext: University of Maryland 99institutetext: F. Paerels 1010institutetext: Columbia University 1111institutetext: H. Arce 1212institutetext: American Museum of Natural History
A Mid-Infrared Spitzer Study of the Herbig Be Star R Mon and the Associated HH 39 Herbig-Haro Object
Abstract
We report on initial results of our Spitzer Cycle 2 program to observe the young massive star R Mon and its associated HH 39 Herbig-Haro object in the mid-infrared. Our program used all instruments on-board Spitzer to obtain deep images with IRAC of the HH 39 complex and of R Mon and its surroundings, a deep image of HH 39 at 24 and 70 m with MIPS, and mid-infrared spectra with the SH, LH, and LL modules of IRS. The aim of this program is to study the physical links in a young massive star between accretion disk, outflows and jets, and shocks in the associated HH object. Our preliminary analysis reveals that several knots of HH 39 are clearly detected in most IRAC bands. In IRAC4 (8 m), diffuse emission, probably from PAHs, appears as foreground emission covering the HH 39 emission. The HH 39 knots are detected at 24 microns, despite the fact that dust continuum emission covers the knots and shows the same structure as observed with IRAC4. The IRS spectra of HH 39 show weak evidence of [Ne II] 12.8 m and 0–0 S(1) H2 17.0 m lines. A more detailed analysis is, however, required due to the faintness of the Herbig-Haro knots. Finally, we obtained the SH and MIPS SED spectra of R Mon. A PAH emission feature at 11.3 m is detected on top of the strong continuum; although no strong emission or absorption lines are observed, we will seek to detect faint lines. The combined IRAC, IRS, and MIPS data of the R Mon/HH 39 system will help us to understand circumstellar disk processing, and the connection between jets, outflows, and HH objects.
Keywords:
Herbig Be star Herbig-Haro Object Accretion Infrared Spitzerpacs:
95.85.Gn 95.85.Hp 97.10.Bt 97.10.Gz 97.21.+a 97.82.Jw1 Introduction
Herbig Ae/Be stars (hereafter HAEBEs; Herbig, 1960) form a class of massive, young stars with high luminosities () and with a strong infrared (IR) excess due to circumstellar dust (Waters and Waelkens, 1998). The spectral energy distribution (SED) of HAEBEs can be explained by circumstellar envelopes with polycyclic aromatic hydrocarbons (PAHs; , , , and m; Brooke et al., 1993; Meeus et al., 2001), and by dust emission from amorphous or crystalline silicate bands ( m) or molecular and atomic transitions. Accretion disks and outflows in the less massive classical T Tau stars (CTTS) are intimately connected, thus the presence of outflows in some HAEBEs suggests that disks could be present as well (e.g., Corcoran and Ray, 1998a). Corcoran and Ray (1998b) also found that the wind mass-loss rate correlates with the IR excess over orders of magnitude in luminosity and from to when using both CTTS and HAEBEs. Outflows in HAEBEs are times faster ( km s-1) than in CTTS, but generally show similar collimation (), although the fraction of poorly collimated outflows in HAEBEs () is larger (e.g., Mundt and Ray, 1994). Complex shocks occur at the interface between the jet and the molecular material (Draine, 1980), heating up the gas which in turn cools down radiatively. This gas is detected as Herbig-Haro objects (HH) in excited lines in the optical, in the near-IR (e.g., ro-vibrational lines around 2 m), and in the mid-IR ([O i] 63 m; Nisini et al., 1997; Liseau et al., 1997; Molinari et al., 2000).
2 The R Mon and HH 39 System
The Herbig Be star R Mon ( pc) is associated with NGC 2261, a reflection nebula that gradually faints with increasing wavelength (Close et al., 1997). A bipolar outflow and a high-velocity jet ( km s-1) pointing toward the nearby HH 39 knots (, ) were detected (Cantó et al., 1981; Brugel et al., 1984; Movsessian et al., 2002). Evidence for a circumstellar disk is substantiated as well (e.g., Beckwith et al., 1986; Fuente et al., 2003; Fuente et al., 2006). A faint CTTS companion at a separation of and with flux of 34 mJy is mentioned by Close et al. (1997) and Weigelt et al. (2002). The HH 39 cluster of knots covers an area about (Fig. 1; Jones and Herbig, 1982; Walsh and Malin, 1985), and the northernmost knot, knot A, is believed to be the working surface of the jet (Schwartz and Schultz, 1992).
Near-IR spectra of R Mon exist mostly in the m range with low () spectral power (Kelly et al., 1994; Reipurth and Aspin, 1997; Porter et al., 1998). ISO neither observed R Mon nor HH 39. The IRAS LRS spectrum ( m) of R Mon is classified as an “unusual spectrum showing a flat continuum with unusual features” (Chen et al., 2000). Aspin et al. (1988) and Yamashita et al. (1989) claimed to detect an extended emission eastward of R Mon, but it remained undetected by Close et al. (1997) with IRTF at 3.16 m down to mJy arcsec-2 (CVF filter with an exposure of 60 s).
3 Spitzer observations
We have obtained 4.2 hrs of Spitzer time to study the R Mon/HH 39 system. Our program (PID 20034) uses all instruments: IRAC and MIPS images of HH 39; IRAC images of R Mon and its jets; IRS spectra of R Mon, its jets, and several of the HH 39 knots; and MIPS SED of R Mon. The observations were taken at different epochs, spanning from October 2005 to April 2006.
3.1 The Herbig-Haro object HH 39
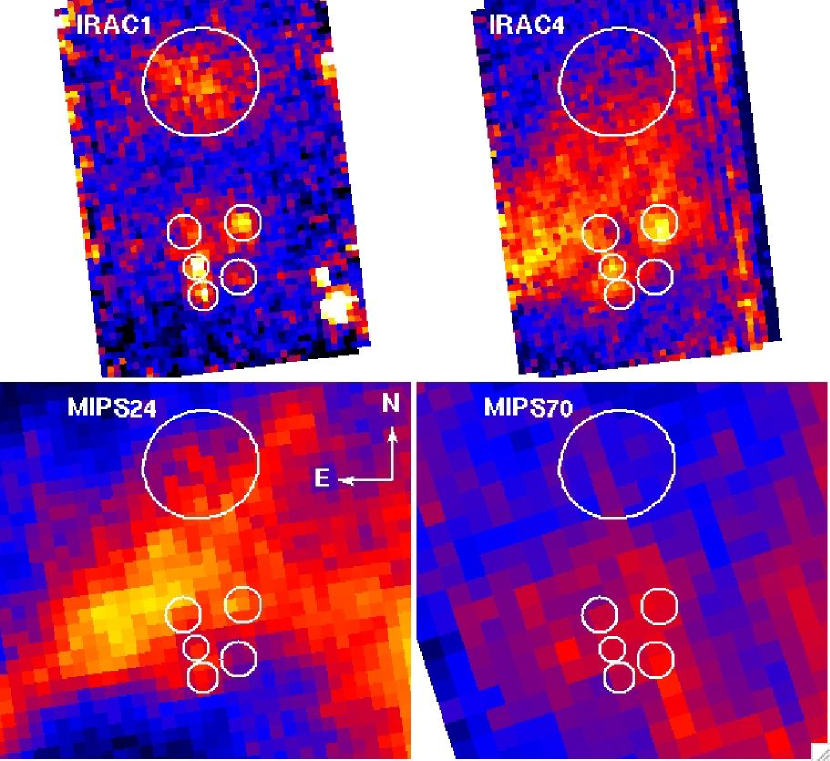
Fig. 1 (left) shows the contour profiles of the Herbig-Haro object HH 39 see in the R band (from Walsh and Malin, 1985). Several knots are labeled, and in particular knot A has been identified as the working surface of the jet onto the surrounding molecular material. The right panel of fig. 1 shows a 3-color IRAC image of HH 39 (red = 3.6 m, green = 4.5 m, blue = 5.8 m). Several knots are clearly detected in the mid-infrared. Fig. 2 shows false-color images of the HH 39 knots in each of the four IRAC bands. Knots D, G, C, and E are clearly detected in all IRAC bands, and knot H is tentatively detected. A diffuse emission is observed near the position of knot A in IRAC1 only. The feature could be due to H2 lines or 3.3 m PAH. Since this feature is not detected in IRAC2, this is a “PAH”-free band, it is very likely that PAHs contribute to the diffuse emission near knot A. H2 lines, on the other hand, most likely contribute to the emission in knots D, G, C, and E. Supporting evidence comes from a faint 0–0 S(1) rotational H2 line detected in the IRS spectra at 17.03 m of the bright knots ( W cm-2). In contrast, IRS spectra of knots A+A′ do not show evidence of H2 line emission in excess of the nearby continuum. Note that faint [Ne II] emission at 12.81 m is measured in the bright knots and at the position of knots A+A′ (of the order of W cm-2). At 8 m, the bright knots are barely visible on top of a diffuse emission that sweeps in through the knots. This extended emission is likely of due to PAHs (7.7 m) and is also seen in the dust continuum 24 m MIPS image (Fig. 3 and 4). Its origin is unclear but it could be the upper wall of the NGC 2261 reflection nebula cavity.
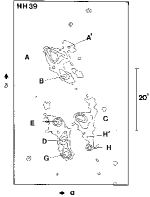
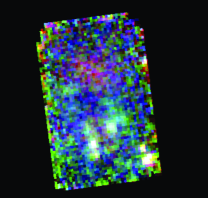
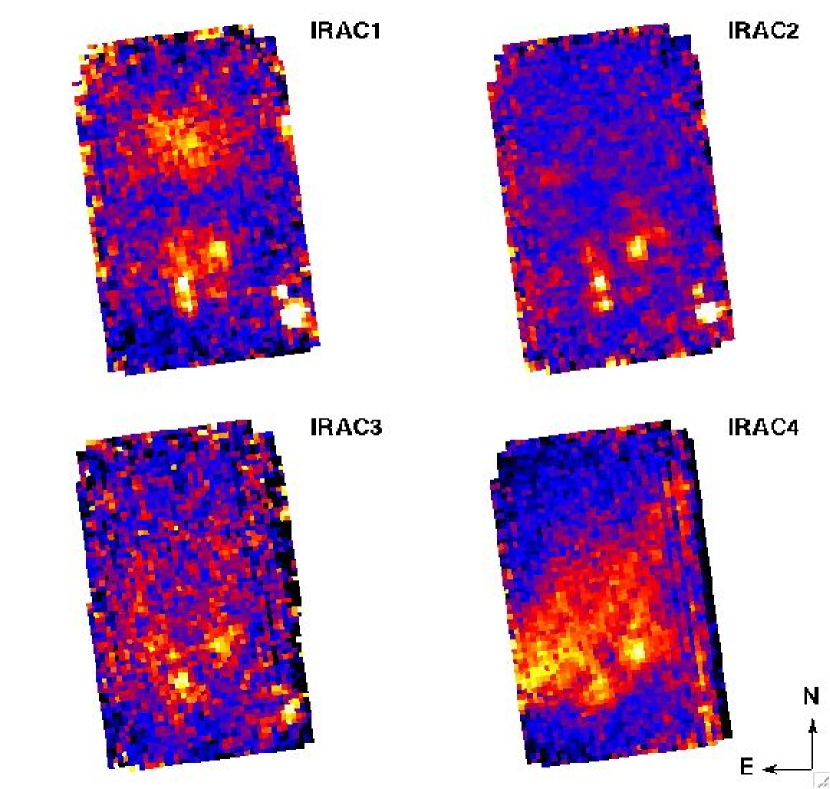
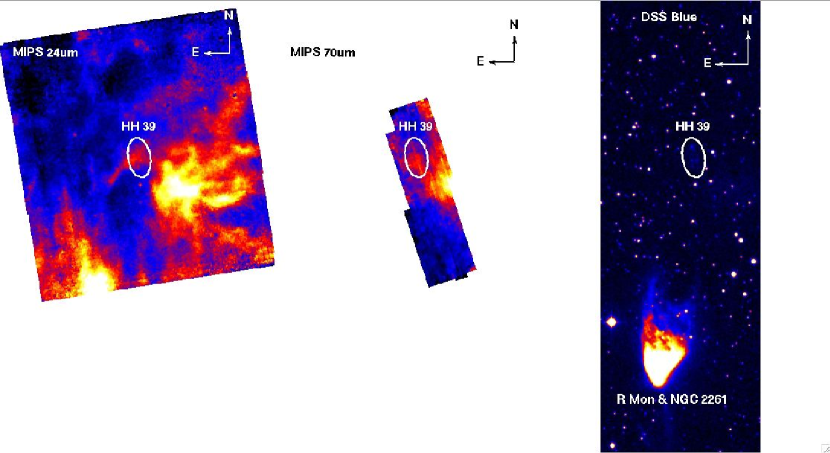
Fig. 3 shows the MIPS images of the HH 39 region at 24 and 70 m together with an optical Deep Sky Survey image. Dust continuum emission is detected across the HH 39 knots, in particular at 24 m. Nevertheless faint HH 39 knots are also detected at 24 m (Fig. 4), but there is no clear evidence of the knots in the 70 m image. On the other hand, it should be reminded that the FWHM PRF at 70 m is 18′′, i.e., about the distance from knot A to the group of knots (G, D, E, C, H). Therefore, since the MIPS 70 m image does not, apparently, observe the same diffuse emission as at 24 m or 8 m, it is possible that the faint emission at the position of the cluster of knots is in fact partially due to [O I] 63 m line emission from the knots.
Emission from the upper part of NGC 2261 is also detected in MIPS at 24 m. The bright emission SW of HH 39 is the IR source IRAS 06362+0853. There is no evidence for diffuse emission in 2MASS around IRAS 06362+0853, suggesting that it is of interstellar cirrus nature. Surface flux densities at 24 m are around 42 MJy sr-1 for the “blue” color regions and go up to 43.1 MJy sr-1 across HH 39. Peak surface flux densities for IRAS 06362+0853 are about 44.4 MJy sr-1 and 46.7 MJy sr-1 for the dust emission of NGC 2261. At 70 m, “blue” regions are about MJy sr-1, whereas the emission across HH 39 is MJy sr-1, and MJy sr-1 near IRAS 06362+0853. The SPOT background estimates are 37.6 MJy sr-1 (zodi) and 2.96 MJy sr-1 (ISM) at 24 m and 10.8 MJy sr-1 (zodi), 21.9 MJy sr-1 (ISM), and 0.2 MJy sr-1 (cosmic) at 70 m. The surface flux densities in the “blue” regions are of similar values as the estimated total.
3.2 R Mon
Fig. 5 shows the IRAC images of the Herbig Be star R Mon and its immediate surroundings. Note that IRAC2 could not be used, even in sub-array mode, due to R Mon’s brightness at 4.5 m. The main goal of these observations was to detect any faint emission from the jets (NS direction) or from the circumstellar disk (EW direction). In particular, we aimed to determine whether a faint eastward extended emission feature detected by Aspin et al. (1988) and Yamashita et al. (1989), but undetected by Close et al. (1997), could indeed be detected with the highly sensitive IRAC detectors.
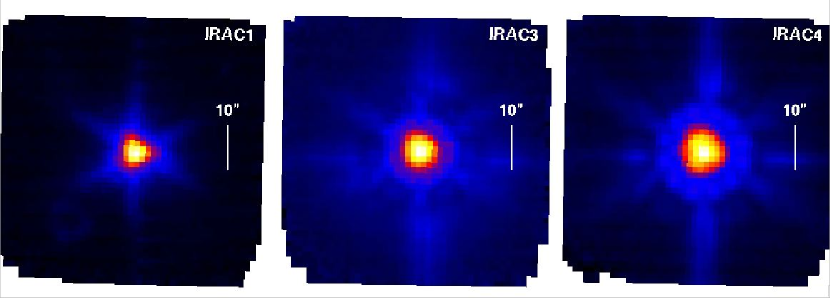
The total (zodi and cirrus) background flux densities are , , MJy sr-1 (based on SPOT). However, the brightness of R Mon is such that the PRF illuminates the full sub-array detector. Aperture photometry (with a radius of 10 pixels = , requiring no aperture correction), the total flux densities for R Mon are Jy, Jy, and Jy in IRAC 1, 3, and 4, respectively. The estimated background fluxes over a circle of 10 pixel radius are negligible (, , Jy) compared to R Mon’s brightness and the RMS uncertainties. Note that the above fluxes include any contribution from R Mon B, separated from R Mon by 0.7′′ (Close et al., 1997). However, in comparison with R Mon, the companion is expected to contribute negligibly ( Jy in JHK′; Close et al., 1997). The next step will be to subtract the PRF of R Mon to possibly detect emission from the disk and the jets. We will need to create IRAC sub-array PRFs from sub-array data of stars observed, e.g., in the FEPS program.
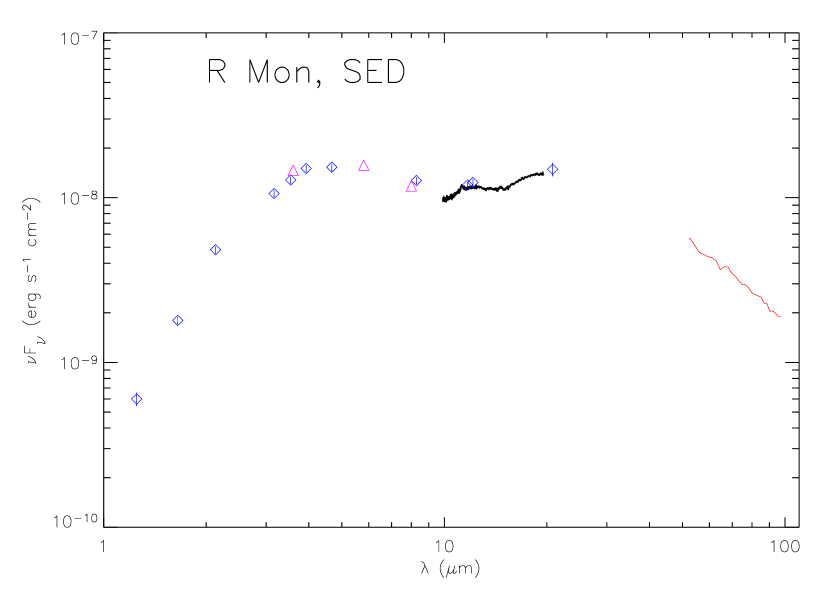
Finally, Fig. 6 shows the IRS SH spectrum of R Mon (top) and its raw SED from 1 to 100 m (bottom). For the latter, we used IRAC fluxes, the IRS SH spectrum, and the MIPS SED and complemented them with values from the literature (Close et al., 1997; and MSX). The IRS SH spectrum shows a clear PAH feature at m and other faint features might be present as well. A detailed analysis is ongoing to remove instrumental effects (e.g., defringing).

Acknowledgements.
This work is based on observations made with the Spitzer Space Telescope, which is operated by the Jet Propulsion Laboratory, California Institute of Technology under a contract with NASA. Support for this work was provided by NASA through an award (JPLCIT 1275416) issued by JPL/Caltech. MA also acknowledges support from a Swiss National Science Foundation Professorship (PP002–110504).References
- (1) Aspin, C., et al.: A&A 197, 242 (1988)
- (2) Beckwith, S., et al.: ApJ 309, 755 (1986)
- (3) Brooke, T. Y., Tokunaga, A. T., & Strom, S. E.: AJ 106, 656 (1993)
- (4) Brugel, E. W., Mundt, R., & Buehrke, T.: ApJ 287, L73 (1984)
- (5) Cantó, J., et al.: ApJ 244, 102 (1981)
- (6) Chen, P. S., Wang, X. H., & He, J. H.: Ap&SS 271, 259 (2000)
- (7) Close, L. M. et al.: ApJ 489, 210 (1997)
- (8) Corcoran, M. & Ray, T. P.: A&A 336, 535 (1998a)
- (9) Corcoran, M. & Ray, T. P.: A&A 331, 147 (1998b)
- (10) Draine, B. T.: ApJ, 241, 1021 (1980)
- (11) Fuente, A., et al.: ApJ 598, L39 (2003)
- (12) Fuente, A., Alonso-Albi, T., Bachiller, R., Natta, A., Testi, L., Neri, R., & Planesas, P.: ApJ, 649, L119 (2006)
- (13) Herbig, G. H.: ApJS 4, 337 (1960)
- (14) Jones, B. F. & Herbig, G. H.: AJ 87, 1223 (1982)
- (15) Kelly, D. M., Rieke, G. H., & Campbell, B.: ApJ 425, 231 (1994)
- (16) Liseau, R., et al.: in IAU Symp. 182: Herbig-Haro Flows and the Birth of Stars, 182, 111 (1997)
- (17) Meeus, G., et al.: A&A 365, 476 (2001)
- (18) Molinari, S. et al.: ApJ 538, 698 (2000)
- (19) Movsessian, T. A., Magakian, T. Y., & Afanasiev, V. L.: A&A 390, L5 (2002)
- (20) Mundt, R. & Ray, T. P.: in ASP Conf. Ser. 62: The Nature and Evolutionary Status of Herbig Ae/Be Stars, 237 (1994)
- (21) Nisini, B. et al.: A&A 315, L321 (1996)
- (22) Porter, J. M., Drew, J. E., & Lumsden, S. L.: A&A 332, 999 (1998)
- (23) Reipurth, B. & Aspin, C.: AJ 114, 2700 (1997)
- (24) Schwartz, R. D. & Schultz, A. S. B.: AJ 104, 220 (1992)
- (25) Walsh, J. R. & Malin, D. F.: MNRAS 217, 31 (1985)
- (26) Waters, L. B. F. M. & Waelkens, C.: ARA&A 36, 233 (1998)
- (27) Weigelt, G., et al.: A&A 392, 937 (2002)
- (28) Yamashita, T., et al.: ApJ 336, 832 (1989)