Narrow–line AGN in the ISO–2MASS Survey ††thanks: Based on observations made with ESO telescopes at La Silla and Paranal (IDs 072.B-0144, 075.A-0345, and 075.A-0374), with the 4-m Blanco telescope at Cerro Tololo Inter–American Observatory (CTIO is part of the National Optical Astronomy Observatories, which are operated by the Association of Universities for Research in Astronomy, under contract with the National Science Foundation), with the 2.2-m telescope at the Centro Astronómico Hispano Alemán (CAHA) Calar Alto, operated jointly by the Max–Planck Institut für Astronomie and the Instituto de Astrofísica de Andalucía (CSIC), with the 1.9-m telescope at the South African Astrophysical Observatory (SAAO), and with the Spitzer Space Telescope, which is operated by the Jet Propulsion Laboratory, California Institute of Technology under a contract with NASA.
Abstract
Context. A long–standing challenge of observational AGN research is to find type 2 quasars, the luminous analogues of Seyfert–2 galaxies.
Aims. We search for luminous narrow–line type 2 AGN, characterise their properties, and compare them with broad–line type 1 AGN.
Methods. Combining the ISOCAM parallel survey at 6.7m with 2MASS, we have selected AGN via near–mid–infrared colours caused by the hot nuclear dust emission. We performed spectroscopy in the optical and, for a subset of the sample, also in the mid–infrared with Spitzer.
Results. We find nine type 2 AGN at redshift , three of them have even quasar–like [O iii] luminosities. At the given redshift and luminosity range the number of type 2 AGN is at least as high as that of type 1s. At we did not find type 2 AGN, probably because the hottest dust emission, still covered by the NIR filters, is obscured. The optical spectra of the type 2 host galaxies show young and old stellar populations. Only one object is an ultraluminous infrared galaxy with starburst. The 5–38 m spectra of the two type 2 sources observed show a strong continuum with PAH emission in one case and silicate absorption in the other case.
Conclusions. The near–mid–infrared selection is a successful strategy to find luminous type 2 AGN at low . The objects exhibit a large range of properties so that it is difficult to infer details by means of popular SED fitting with simple average templates.
Key Words.:
Galaxies: active – quasars: general – Infrared: galaxies1 Introduction
According to the AGN unification scheme type 2 quasars are misaligned type 1s, so that the central powerhouse is hidden behind a dusty torus seen edge-on (Antonucci antonucci93 (1993)). While among radio–loud AGN Spitzer spectroscopy could show that the powerful FR II radio galaxies contain quasar–like nuclei (Haas et al. haas05 (2005), Ogle et al. ogle06 (2006)), the detection of radio–quiet type 2 quasars requires other strategies. Hard X–ray surveys turned out to be successful (Norman et al. norman02 (2002)), but may be hampered by considerable extinction (Vignali et al. vignali04 (2004)). In the optical, using the Sloan Digital Sky Survey (SDSS), type 2 quasar candidates have been found in galaxies with narrow permitted emission lines and high [O III]5007 equivalent widths (Zakamska et al. zakamska03 (2003)) and were confirmed by spectropolarimetry (Zakamska et al. zakamska05 (2005)).
An alternative approach is to look for the characteristic near– and mid–infrared reemission of the hiding dust heated by the strong radiation field of the AGN. While several such searches were started using 3.6 – 8.0 m data from the Spitzer Space Telescope (e.g. Lacy et al. 2004a ), at 24 m (e.g. Alonso–Herrero et al. alonso06 (2006)), and as a combination of 24 m and radio data (Martinez–Sansigre et al. martinez05 (2005), Weedman et al. weedman06 (2006)), we have utilised the ISO–2MASS AGN survey. The results on the 24 type 1 AGN have been presented by Leipski et al. (leipski05 (2005)). Here, we report about the nine type 2 AGN. We use a –cosmology with , = 0.27, and = 0.73 throughout the paper.
2 Data

We combined the ISOCAM Parallel Survey at 6.7 m (Cesarsky et al. cesarsky96 (1996), Siebenmorgen et al. siebenmorgen96 (1996), Ott et al. ott05 (2006)) with 2MASS (Skrutskie et al. skrutskie06 (2006)) in order to search for AGN largely independent of dust obscuration. At high galactic latitudes (b20 deg) the ISOCAM Parallel Survey covers a total effective area of 10 deg2. We initially considered the sources down to F6.7μm 1 mJy with MIR, NIR, and optical photometry available. Then 77 AGN candidates were selected by their red colours, and (Vega system). The colour criteria were determined by comparison with suitable samples of various astronomical sources. The details of the ISO–2MASS sample selection and the begin of the spectroscopic follow–up observations are described by Haas et al. (haas04 (2004)). Meanwhile, we completed the optical spectroscopy for testing the AGN nature. Sources with a Balmer emission line FWHMs 3000 km s-1 are identified as type 1 AGN and presented in Leipski et al. (leipski05 (2005)).
The optical spectra of the type 2 AGN were obtained at several telescopes Tab. 1). The instrument setups have been chosen to provide a reasonable combination of spectral resolution and wavelength coverage. All spectra were obtained in long–slit mode using slit widths of 1–15″, depending on the seeing conditions. The data reduction and analysis was performed using Eso/Midas version 04FEBpl1.0 with standard procedures including bias subtraction, flatfielding, cosmic ray removal, wavelength and flux calibration.
We have obtained low–resolution 5–38 m spectra using IRS (Houck et al. houck04 (2004)) aboard the Spitzer Space Telescope (Werner et al. werner04 (2004)) for a random sub–sample of 10 out of the 77 IR-selected AGN candidates. During completion of the optical spectroscopy of the entire sample, two of the sources observed with IRS turned out to be type 2 AGN. Their MIR spectra are presented in this paper. The IRS integration times were 260s in SL1 and SL2 and 2120s in LL1 and LL2. The two different nod positions were subtracted to remove the background and the resulting frames were averaged. The averaged spectra were extracted and calibrated using Spice with standard procedures and the orders were merged using custom IDL procedures. During this process no significant offsets between the different orders were recognized.
| 2MASS (J2000.0) | redshift | F6.7μm | telescope | nominal resolution | |||||
|---|---|---|---|---|---|---|---|---|---|
| mag | mag | mag | [mJy] | [] | [] | Å/px | |||
| J015204652232015 | 0.113 | 16.613 | 16.159 | 15.642 | 0.89 | 0.13 | – | CAHA | 4.59 |
| J022514322437154 | 0.104 | 15.790 | 15.125 | 14.519 | 2.92 | 0.35 | – | SAAO | 2.30 |
| J044114053734369111Detected with IRAS: F25μm=100 mJy, F60μm=950 mJy,F100μm=1600 mJy. | 0.236 | 16.629 | 15.521 | 14.797 | 3.96 | 4.98 | 0.85 | NTT | 3.54 |
| J110958613720374 | 0.173 | 16.521 | 15.613 | 14.863 | 2.00 | 0.38 | 0.07 | VLT | 2.64 |
| J123241141112587 | 0.249 | 16.772 | 15.474 | 14.261 | 7.12 | 1.35 | 0.18 | NTT | 3.54 |
| J145632960847490 | 0.079 | 16.460 | 15.882 | 15.374 | 1.69 | 0.04 | 0.02 | NTT | 3.54 |
| J175823315125419 | 0.201 | 16.742 | 16.180 | 15.774 | 1.26 | 0.79 | – | CAHA | 4.63 |
| J191105536742507 | 0.171 | 17.755 | 15.683 | 14.483 | 3.73 | 11.28 | – | CAHA | 4.59 |
| J220906023257505 | 0.425 | 16.701 | 15.778 | 15.134 | 1.92 | 13.76 | 3.81 | CTIO | 1.21 |
3 Results and discussion
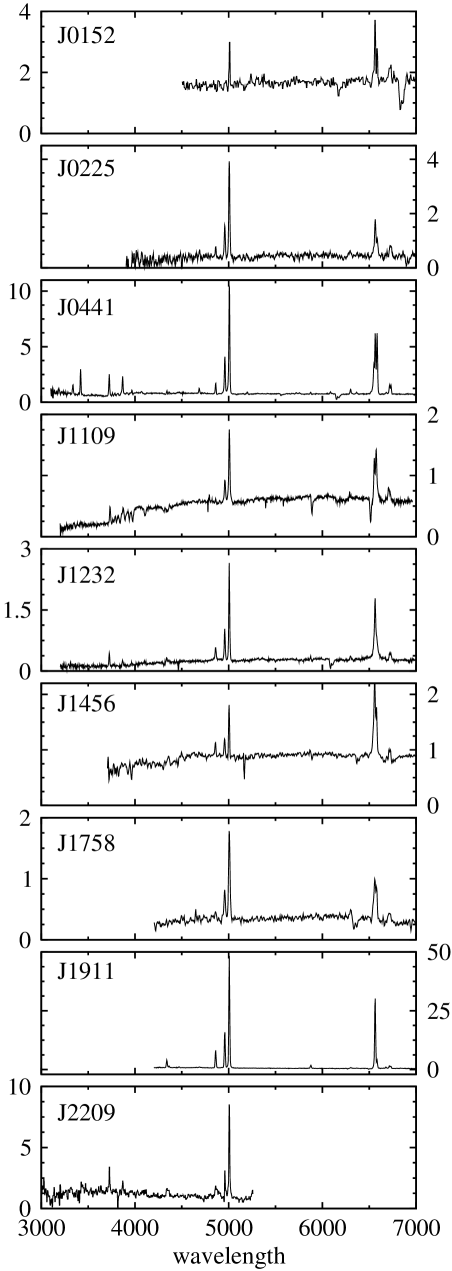
Fig. 8 shows the optical spectra of the 9 type 2 AGN. They were distinguished from the emission–line galaxies in the diagnostic line–ratio diagrams (Baldwin et al. baldwin81 (1981)), using the dividing lines of Kewley et al. (kewley01 (2001); Tab. 2). This procedure yields nine type 2 AGN (Tab. 1). Three of the type 2 objects can be regarded as type 2 QSOs with [O iii] luminosities greater than (according to the criterion of Zakamska et al. zakamska03 (2003); Tab. 1). In addition to the red sources, the ISO–2MASS sample contains 56 blue sources with and . For 24 of them we have obtained spectroscopy (randomly chosen). Only one source (J17582331+5125419) turns out to be a type 2 AGN. It may actually belong to the red sample, since it has only an upper limit in and, thus, a lower limit (Tab. 1).
None of the sources is listed in NED as X–ray source and only two have detected radio emission ( 1 mJy from FIRST for J123241141112587 and 38 mJy from NVSS for J110958613720374).
| 2MASS (J2000.0) | log | log | |
|---|---|---|---|
| J015204652232015a | 1.38 | 0.24 | |
| J022514322437154 | 0.96 | 0.28 | |
| J044114053734369b | 1.04 | 0.03 | |
| J110958613720374b | 1.22 | 0.11 | |
| J123241141112587 | 0.84 | 0.43 | |
| J145632960847490 | 0.55 | 0.19 | |
| J175823315125419 | 0.98 | 0.08 | |
| J191105536742507 | 0.80 | 0.91 | |
| J220906023257505 | 0.85 | – | – |
-
a
For this source the H line could not be identified within the noise. We only give an upper limit on the H flux and, thus, a lower limit on .
-
b
These objects show Balmer absorption. Since we do not correct for the stellar population, the H flux is a lower limit and, thus, the is given as an upper limit.
The emission–line fluxes of the type 2 AGN were determined by fitting gaussians to major emission lines. We did not correct the spectra for the underlying stellar continuum. Thus, for objects with strong young-to-intermediate age stellar populations (J0441, J1109) the fluxes especially of H are likely to be underestimated. When we account for this effect, it does not change the classification of the objects. The dominant source of uncertainty in deriving the line fluxes is the placement of the continuum next to the emission line. Following Bennert et al. (2006a ; 2006b ) we therefore estimated the errors of the flux measurements as the product of the root–mean square deviation of the local continuum and the FWHM of the line. We assumed a minimum error in the flux measurement of at least 5% though. The flux values and the corresponding errors are given in Tab. 3.
| 2MASS (J2000.0) | [O ii] | ([O ii]) | H | (H) | [O iii] | ([O iii]) | H | (H) | [N ii] | ([N ii]) |
|---|---|---|---|---|---|---|---|---|---|---|
| % | % | % | % | 6583 | % | |||||
| J015204652232015 | – | – | 0.66 | – | 15.75 | 6 | 25.52 | 5 | 14.85 | 9 |
| J022514322437154 | – | – | 5.42 | 20 | 49.67 | 5 | 19.83 | 7 | 10.39 | 13 |
| J044114053734369 | 19.88 | 5 | 10.58 | 5 | 117.10 | 5 | 69.01 | 5 | 73.43 | 5 |
| J110958613720374 | 3.23 | 6 | 1.07 | 15 | 17.89 | 5 | 12.95 | 5 | 10.04 | 5 |
| J123241141112587 | 3.70 | 10 | 4.04 | 6 | 28.11 | 5 | 24.01 | 5 | 8.82 | 5 |
| J145632960847490 | 4.73 | 20 | 3.15 | 13 | 11.11 | 5 | 22.65 | 5 | 14.51 | 5 |
| J175823315125419 | – | – | 2.80 | 25 | 26.55 | 5 | 11.46 | 7 | 9.46 | 8 |
| J191105536742507 | – | – | 85.71 | 5 | 546.35 | 5 | 365.36 | 5 | 44.53 | 5 |
| J220906023257505222While this object lacks measurements of H and [N ii] used for the diagnostic line-ratio diagrams, its high [O iii]/H and [O iii]/[O ii] ratios as well as its redshift and [O iii] luminosity strongly suggests that this objects harbours an AGN. | 22.74 | 13 | 11.59 | 15 | 82.14 | 5 | – | – | – | – |

3.1 Type 2 properties
The ISO–2MASS type 2 AGN show a wide range of properties. This is not surprising because according to the unification scheme any details of the host galaxy can be well discerned in type 2 AGN since the outshining nucleus is shielded by the dust torus. In the following we discuss two type 2 objects in detail for which optical as well as MIR spectroscopy is available (J044114053734369, hereafter called J0441 and J123241141112587, hereafter called J1232). Both share the prominent optical emission lines from the narrow–line region (NLR), but the signatures of the host galaxies are rather different (Fig. 2).
3.1.1 J0441
The optical spectrum of J0441 (Fig. 1, upper left) shows a blue continuum with prominent optical emission lines. The emission lines include e.g. strong [Ne v] emission, what is commonly used as a tracer for an active nucleus. Besides the emission lines, the spectrum of J0441 clearly shows absorption lines, especially higher order Balmer absorption (Fig. 2). The spectrum indicates a strong contribution of a moderately young (few hundred megayears) stellar population. This young population is superposed on an older population (indicated by the presence of absorption features like Ca II K; Fig. 2).

That star formation is still ongoing is supported by the strong far–infrared (FIR) emission visible in the Spitzer MIR spectrum (Fig. 1, upper right). The star formation is also indicated by the presence of PAH emission. This emission, although clearly detected, is of low equivalent width due to a strong NIR and MIR continuum probably caused by the AGN. Compared with the starburst galaxy M 82 (Sloan et al. sloan03 (2003)), the continuum of J0441 is stronger at 5–20 m, but similar at 20–30 m, while equivalent widths of the PAH features are much larger in M 82 (Fig. 3). The prominent type 2 AGN/ULIRG Mrk 273 has intermediate PAH strength and a very steep slope towards FIR wavelengths, most likely due to vigorous starbursts (Fig. 3). J0441 is the only ISO–2MASS type 2 AGN which we detected on IRAS–ADDSCANs yielding LFIR according to Sanders et al. (sanders96 (1996), their Tab. 1). Thus, J0441 qualifies as a type 2 AGN/ULIRG. Its MIR luminosity at 15 m of erg s-1 places this object among MIR strong sources that are most likely AGN powered (Ogle et al. ogle06 (2006)).

Notably, the MIR spectrum resembles that of the FIR luminous dust rich broad–line quasar Mrk 1014 (Armus et al. armus04 (2004); Fig. 4) and possibly is an intermediate case between Mrk 1014 and Mrk 273, both showing FIR signatures of dust-enshrouded starbursts accompanying the AGN to varying degree. In the comparison with the type 1 source Mrk 1014 (Fig. 4) the spectra match well at wavelengths greater than m. Below this wavelength the type 2 source has a significant flux deficit which steadily increases towards shorter wavelengths. We will address this issue further in §3.2.
Measuring the emission–line fluxes in the MIR spectrum of J0441 (Tab. 4) and comparing the flux ratios with those given in Sturm et al. (sturm02 (2002)) we see that this source falls between AGN and starburst dominated objects. While it may therefore be classified as a composite object from the MIR line ratios alone, the optical line ratios, the [O iii] luminosity, and the MIR (15 m) luminosity is actually dominated by the AGN in this type 2 QSO.
3.1.2 J1232
In the optical, J1232 displays a red continuum (Fig. 1, lower left). There are only very few clear absorption lines present with Ca II K being the most prominent (Fig. 2). No clear absorption signature can be identified in the spectrum of J1232, neither a Balmer jump nor a 4000 Å break. This indicates that most stellar features may have been diluted by a non–stellar continuum. Since Ca II K is visible and higher order Balmer absorption lines are not, it is unlikely that the young stellar population is strong in this object. This is supported by the flat 15–30 m spectrum and the low IRAS–ADDSCAN 3 upper limit ( mJy), i.e. little amounts of dust heated by young stars (Fig. 1, lower right). The 15 m luminosity of erg s-1 demonstrates that the MIR emission is powered by a hidden AGN (Ogle et al. ogle06 (2006)).
[Ne v] is not detected in the optical whereas it was even stronger than [O ii] in J0441. This can be caused by obscuration of the regions where [Ne v] is emitted, i.e. the inner regions of the NLR with the necessary high–energy photons. In comparison with J0441, the [Ne v] emitting region will be more compact because of the less powerful central engine (as traced by e.g. the MIR luminosity or the [O iii] luminosity).
| [Ne v] | [Ne iii] | [Ne ii] | [Ne v] | [Ne iii] | [Ne v] |
|---|---|---|---|---|---|
| Å | Å | m | m | m | m |
| 23.9 | 17.5 | 147.0 | 79.5 | 266.0 | 113.0 |
Note: Flux for [O iv] m: 244.0.
Remarkably, we see broad emission–line components at the bases of H and H (Fig. 2), indicating that J1232 has to be classified as a type 1.8 according to Osterbrock (osterbrock77 (1977)). This also indicates that the central region of the AGN is either viewed under an intermediate angle by grazing the torus edge and allowing some emission from the BLR to be visible or that light from the BLR is scattered into the line of sight. If scattered, then we expect to see also the featureless continuum (FC) from the active nucleus (e.g. Cid Fernandes et al. cid04 (2004)). In this case, the scattered FC dilutes the absorption lines, especially in the blue where the FC is stronger and the scattering efficiency is larger. But the optical continuum of J1232 is red despite the contribution of an intrinsically blue FC suggesting considerable dust reddening. This is confirmed by an emission–line ratio of Hα/ corresponding to (see Tab. 2).

We estimate also from the 9.7 m silicate absorption in the MIR spectra, almost the only clearly discernable feature besides the continuum (Fig. 1). The estimated depth of the silicate feature is sensitive to the placement of the continuum. Varying this placement allows us to estimate an uncertainty of the obscuration derived from the silicate trough. We get a range of using (Krügel kruegel03 (2003)) or, alternatively, using (Draine et al. draine03 (2003)).
Since the estimated is only an average value for the NLR, the difference in the values indicates that the absorption for the NLR gas and the MIR continuum takes place at different regions in the galaxy. Since most of the NLR emission comes from scales large compared to the MIR continuum emitter, we suggest that the silicate absorption mainly arises from dust which is concentrated towards the centre of the galaxy. The NLR emission and the MIR continuum is additionally absorbed by ambient dust in the host galaxy. Such a dust distribution fits well with our findings that the emission of highly ionised gas in the inner parts of the NLR is significantly obscured by dust.
3.2 Comparison of type 1 and type 2 objects
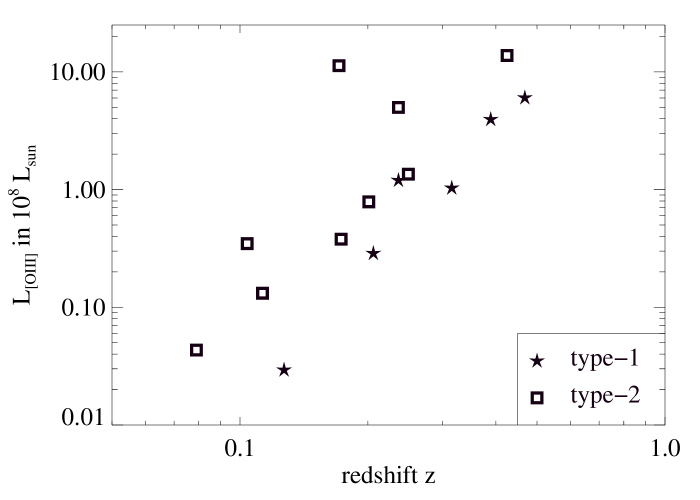
For surveys relying on isotropic properties, e.g. using 178 MHz radio fluxes (Laing et al. laing83 (1983), Spinrad et al. spinrad85 (1985)) or FIR data (Keel et al. keel05 (2005)), the number ratio of type 1 to type 2 AGN turns out to be . Surveys in the MIR using the four Spitzer IRAC filters find also a ratio of (e.g. Lacy et al. lacy07 (2007)). At redshift we find 12 and 9 type 1 and type 2 ISO-2MASS-AGN, respectively (Fig. 5). At higher redshift () in fact no narrow–line ISO-2MASS-AGN has been found, but 12 type 1 AGN. The deficit of type 2 AGN suggests that, in contrast to the original expectations, our near-mid-infrared AGN selection strategy is more affected by extinction and hence not isotropic.
To understand this behaviour in more detail, we first consider the origin of the different parts of the SED of type 2 objects. The dust emission seen in the NIR most likely originates at the inner surface of the obscuring torus that is heated by the central engine. In type 2 objects the torus is thought to be inclined such that the central engine is hidden from our direct view. While at a sufficient amount of warm–to–hot dust (K) may be visible, at only the very hottest (K) and inner–most dust is observable in the NIR filters. The extinction of the most central and hottest dust emission by the torus or the torus edge leads to a loss in magnitude and the source shifts below our magnitude cutoff ( mag). Also, the relative contribution of the host galaxy increases at shorter wavelengths, leading to a bluer colour for a redshifted source. Since none of the 24 spectroscopically studied ISO–2MASS sources with and proper detection in and is a type 2 AGN, we conclude that the NIR magnitude limit is the main reason for the lack of high– type 2 AGN in the ISO–2MASS sample.
If the hottest dust emission in type 2s is affected by obscuration, then such AGN have to be intrinsically more luminous than type 1 objects to be selected by our survey. We test this picture by assuming that the luminosity of the [O iii] emission line is a good measure for the total luminosity of the central engine. This was possible for the nine type 2s and for six type 1s with and mag. The [O iii] luminosity distribution shows no difference between type 1 and type 2 AGN (Figs. 6 and 7). However, from Fig. 6 we see that the type 2 sources have systematically higher [O iii] luminosities at a given redshift. If the [O iii] luminosity is in fact proportional to the total luminosity of the AGN, this means that our type 2 sources are more luminous than equally distant type 1s. This is in fact remarkable if parts of the NLR emission is indeed obscured as suggested by Haas et al. (haas05 (2005)). Then type 2 AGN would tend to show less [O iii] than type 1 sources of comparable intrinsic luminosity. This would further increase the discrepancy observed here, since we would underestimate the [O iii] luminosity and, thus, the total luminosity of our type 2 sources.
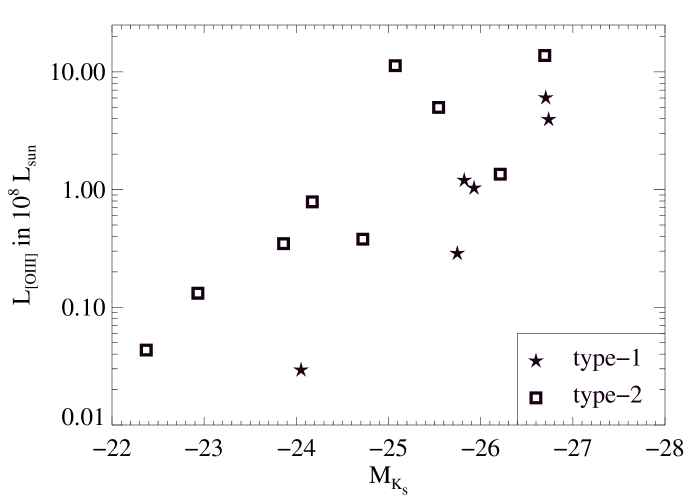
In addition, the luminosity at a given L is systematically lower for type 2 sources than for type 1s (Fig. 7). This supports the idea that type 2 AGN suffer from obscuration also in the NIR. To compensate for obscured radiation they need to have a more luminous central engine to reach our magnitude limit. Performing a linear least–square fit to either distributions in Fig. 7 we estimate the difference between the two types of AGN in M to mag at a given [O iii] luminosity. These 1.3 mag in corresponds roughly to mag (Rieke & Lebofsky rieke85 (1985)).
The difference of type 1s and type 2s in the NIR/MIR can also be seen in Fig. 4. The MIR spectra of a type 1 and a type 2 QSO are similar at MIR to FIR wavelengths but show an increasing discrepancy for m. The type 2 spectrum has a considerable flux deficit towards the NIR compared to the type 1 that is assumed to have a largely unobscured line-of-sight towards the innermost regions of the AGN. However, torus models predict obscuration even at longer MIR wavelengths (e.g. Pier and Krolik pier92 (1992)) and observations indicate that the torus is still affecting radiation at 24 m (Shi et al. shi05 (2005)) and becomes optically thin at m (Keel et al. keel94 (1994); Shi et al. shi05 (2005)). That the type 1 and type 2 MIR spectra look similar even at wavelengths as small as 20 m indicates that at these wavelengths the dust is rather heated by extended starbursts/star formation than coming from a nuclear and potentially (self–)obscuring torus. Note that around 18 m the type 1 object shows additional flux over the type 2 source, likely due to silicate emission powered by the active nucleus. At shorter MIR wavelengths the dust emission is powered by the AGN and the obscuration of the torus is clearly visible. As shown above this trend continues toward the NIR.
4 Conclusions
We present a study of NIR/MIR selected type 2 AGN found via the ISO–2MASS AGN survey. The optical spectra of the objects reveal different types of host galaxies. At least three sources are sufficiently luminous to be classified as type 2 QSOs. The Spitzer MIR spectra of two sources show very different features suggestive of a strong starburst contribution in one case and displaying continuum emission with strong silicate absorption in the other.
In comparison with the ISO-2MASS type 1 sources we find a clear trend for type 2 sources to be obscured even in the NIR. This obscuration seems to continue into the MIR wavelength range as well.
The flux deficit in the NIR compared to intrinsically luminous type 1 objects is identified as the reason for the lack of type 2 sources at in our survey. This also results in our detected type 2 sources being intrinsically more luminous than type 1 sources at comparable redshifts.
Acknowledgements.
This work was supported by Sonderforschungsbereich SFB 591 “Universelles Verhalten gleichgewichtsferner Plasmen” der Deutschen Forschungsgemeinschaft, and by Nordrhein–Westfälische Akademie der Wissenschaften. We are grateful to Vassilis Charmandaris for kindly providing us with the IRS spectrum of Mrk 1014. We thank the anonymous referee for his detailed suggestions.References
- (1) Alonso–Herrero, A., Pérez–González, P.G., Alexander, D.M., et al. 2006, ApJ, 640, 167
- (2) Antonucci, R. R. J. 1993, ARA&A, 31, 473
- (3) Armus, L., Charmandaris, V., Spoon, H., et al. 2004, ApJS, 154, 178
- (4) Baldwin, J. A., Phillips, M. M., Terlevich, R., 1981, PASP 93, 5
- (5) Bennert, N., Jungwiert, B., Komossa, S., Haas, M., Chini, R. 2006, A&A, 446, 919
- (6) Bennert, N., Jungwiert, B., Komossa, S., Haas, M., Chini, R. 2006, A&A, 456, 953
- (7) Cesarsky, C. J., Abergel, A., Agnese, P., et al. 1996, A&A, 315, L32
- (8) Cid Fernandes, R., Gu, Q., Melnick, J., et al. 2004, MNRAS, 355, 273
- (9) Draine, B. T. 2003, ARA&A, 41, 241
- (10) Haas, M., Siebenmorgen, R., Leipski, C., et al. 2004, A&A, 419, L49
- (11) Haas, M., Siebenmorgen, R., Schulz, B., et al. 2005, A&A, 442, L39
- (12) Houck J.R., Roellig T.L., van Cleve et al. 2004, ApJS, 154, 18
- (13) Keel, C. W.., de Grijp, M. H. K., Miley, G. K., Zheng, W. 1994, A&A, 283, 791
- (14) Keel, W. C., Irby, B. K., May, A., et al. 2005, ApJS, 158, 139
- (15) Kewley, L., Dopita, M., Sutherland, R., et al. 2001, ApJ, 556, 121
- (16) Krügel, E. 2003. The Physics of Interstellar Dust (Bristol: Institute of Physics Publishing)
- (17) Lacy, M., Storrie–Lombardi, L., Sajina, et al. 2004, ApJS, 154, 166
- (18) Lacy, M., Petric, A. O., Sajina, A., et al. 2007, AJ, 133, 186
- (19) Leipski, C., Haas, M., Meusinger, H., et al. 2005, A&A, 440, L8
- (20) Laing, R. A., Riley, J. M., Longair, M. S. 1983, MNRAS, 204, 151
- (21) Martinez–Sansigre, A., Rawlings, S., Lacy, M., et al. 2005, Nature, 436, 666
- (22) Norman, C., Hasinger, G., Giacconi, R., et al. 2002, ApJ, 571, 218
- (23) Ogle, P., Whysong, D., Antonucci, R. 2006, ApJ, 647, 161
- (24) Osterbrock D. E. 1977, ApJ, 215, 733
- (25) Ott, S., Siebenmorgen, R., Schartel, N., et al. 2006, A&A, submitted
- (26) Pier, E.A. & Krolik, J.H. 1992, ApJ, 401, 99
- (27) Rieke, G.H. & Lebofsky, M.J. 1985, ApJ, 288, 618
- (28) Sanders, D. B. & Mirabel, I. F. 1996, ARA&A, 34, 749
- (29) Shi, Y., Rieke, G.H., Hines, D.C., et al. 2005, ApJ, 629, 88
- (30) Siebenmorgen, R., Abergel, A., et al. 1996, A&A, 315, L169
- (31) Skrutskie, M.F., Cutri, R.M., Stiening, R., et al. 2006, AJ, 131, 1163
- (32) Sloan, G., Kraemer, K., Price, S., Shipman, R. 2003, ApJS, 147, 379
- (33) Spinrad H., et al. 1985, PASP, 97, 932
- (34) Sturm, E., Lutz. D., Verma, A., et al. 2002, A&A, 393, 821
- (35) Vignali, C., Alexander, D., & Comastri, A. 2004, MNRAS, 354, 720
- (36) Werner M., Roellig T., Low F., et al. 2004, ApJS, 154, 1
- (37) Weedman, D.W., Le Floc’h, E., Higdon, S.J.U., et al. 2006, ApJ, 638, 613
- (38) Zakamska, N. L., Strauss, M. A., Krolik, et al. 2003, AJ, 126, 2125
- (39) Zakamska, N. L., Schmidt, G., Smith, P., et al. 2005, AJ, 129, 1212