INAF-IASF PA, Via Ugo La Malfa 153, I-90146, Palermo, Italy Dept of Astronomy & Astrophysics, PSU, University Park, PA 16802, USA INAF-Osservatorio Astronomico di Brera, Via E. Bianchi 46, I-23807 Merate (LC), Italy ASI-Science Data Center, Via G. Galilei, I-00044, Frascati (RM), Italy Università degli Studi di Milano, Bicocca, Piazza delle Scienze 3, I-20126, Milano, Italy NASA/Goddard Space Flight Center, Greenbelt, MD20771, USA \PACSes\PACSit98.70.Rz-ray source; -ray bursts \PACSit01.30.CcConference proceedings
Rest frame light curves of Swift GRBs
Abstract
We have computed the luminosity rest frame light curves of the first 40 Gamma-ray bursts (GRBs) detected by Swift with well established redshift. We studied average properties of the light curves in the four subsamples of bursts given by , , , and . We conclude that all the last three subsamples share the same morphology and the same luminosity range. Very high redshift () GRBs detected up to now are not intrinsically longer than lower redshift long GRBs. Nearby long GRBs () are fainter than average. Possible selection effect are under investigation.
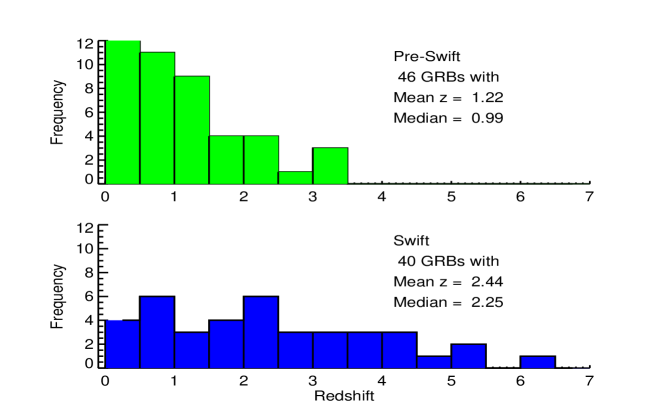
We have computed the 0.210 keV luminosity rest frame light curves of the first 40 GRBs detected by Swift with well established redshift. The sample covers GRBs up to May 2006 and includes of 9 very high redshift (4) GRBs and 3 short GRBs (GRB 050509B, GRB 050724 and GRB 051221A, all with redshift ). More than half of the selected sources (26 over 40) show flares during the XRT observation. Our sample is definitely larger than samples used in previous works on Swift GRBs luminosity light curves (Chincarini et al. 2005, 7 GRBs used; Nousek et al. 2006, 14 GRBs used) and is comparable to the sample of GRBs with redshift triggered by the pre-Swift missions (e.g. BeppoSAX, HETE II, INTEGRAL) that consists of 46 objects. However, the redshift distributions of the two samples are substantially different (see Fig. 1): pre-swift bursts have an average redshift of 1.22 and a larger fraction of the population at low redshift, while Swift bursts have an average redshift of 2.44 and a flat distribution up to , with a single source at redshift (GRB 050904; Cusumano et al. 2006). Several factors can shape the redshift distribution of Swift detected bursts, and among them a very relevant contribution may come from the narrowness of the BAT sensitivity range (15150 keV) that favors detection of GRBs with a peak energy close to this range, and in particular, high redshift GRBs, because their typical 300 keV peak energy is easily lowered by cosmological redshift effects.
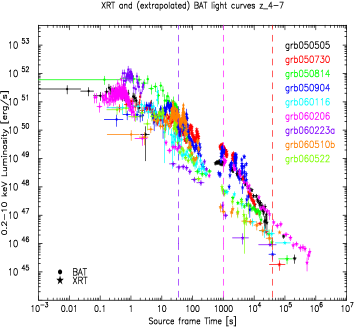
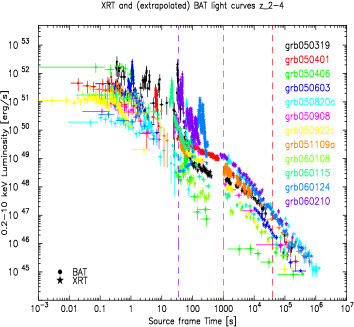
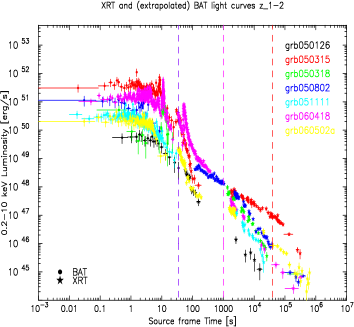
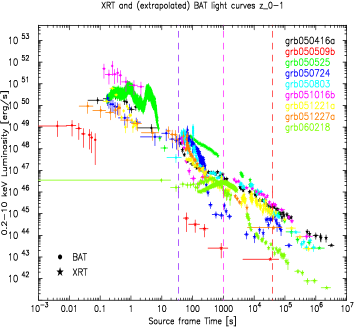
In Fig. 2 the light curves we computed are shown, divided in four groups according to the redshift interval: (very high redshift GRBs), , , and (nearby GRBs). Note that the selected sub samples have comparable statistics. Each light curve consists of i) the BAT light curve of the prompt emission extracted in the 15150 keV energy band, extrapolated to flux in the 0.210 keV energy band using the best fit parameters of the BAT spectrum and then converted in 0.210 keV luminosity with the K-correction required for the best fit model of the BAT spectrum; ii) the XRT light curves, converted to 0.210 keV luminosity with the K-correction required for the best fit model of the XRT spectra. Time dependent rate to flux and flux to luminosity conversion have been applied when spectral variation occurred. This lead to a very good match between BAT extrapolated and XRT light curves. All light curves are referred to time measured in the source rest frame (i.e. with cosmological time delay removed) starting from the trigger.
Detailed light curve fitting have been performed to determine the continuum underlying flares during the XRT observations. With the only exception of GRB 050904 (that shows a light curve consisting of flares only, Cusumano et al. 2006), we were always able to identify a power law, broken power law or doubly broken power law continuum in agreement with the ‘canonical’ Swift GRB light curve shape defined by O’Brien et al. (2006). We found that the average time of the first break of light curves in the source rest frame is 203 s (with 183 s of standard deviation ), and average time of the second break is 20 ks (=35 ks). In each panel of Fig. 2 vertical lines corresponding to 35 s, 1 ks and 11 hr since the trigger are shown. The selected times correspond to a typical time before the first break of the three-phase shaped light curve (35 s), a time during the flat intermediate phase (1 ks) and a time after the second break (11 hr).
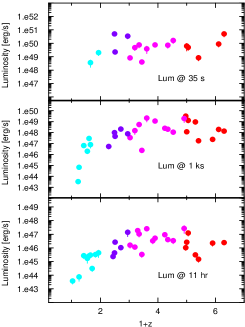
Luminosities of the continua at the fixed times 35 s, 1 ks and 11 hr since the trigger have been computed in all cases when reasonable extrapolation or interpolation of data was possible. Short bursts have been excluded. Results are shown in the left panel of Fig. 3. Average values and standard deviations for the four selected subsamples are shown in Table 1.
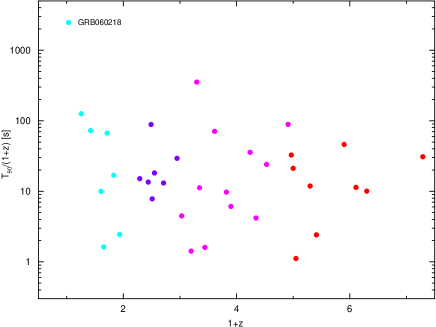
The right panel of Fig. 3 shows the intrinsic durations of long GRBs of our sample in the source rest frame (i.e. measured divided by (1+z)) as a function of (1+z). Averages of values and standard deviations for the four selected subsamples are shown in Table 1. The average duration value for nearby bursts have been calculated excluding GRB 060218, that would bias the result.
From these results we can see that long bursts with span approximately the same 0.210 keV luminosity range regardless of redshift at fixed times: around erg s-1 after 35 s, around erg s-1 after 1 ks, and around erg s-1 after 11 hr. Nearby long GRBs are at least one order of magnitude less luminous. Moreover, intrinsic durations of long GRBs are not significantly longer at higher redshifts and the distribution of durations at higher redshifts seems narrower than at lower redshifts. The results are however very preliminary and a larger sample of GRBs is now being investigated for selection effects.
| mean | mean | mean | mean | |||||
| @ 35 s | – | – | 50.2 | 0.7 | 49.6 | 0.5 | 49.8 | 0.6 |
| @ 1 ks | 46.0 | 1.5 | 47.7 | 0.6 | 48.3 | 0.9 | 48.3 | 0.8 |
| @ 11 hr | 45.0 | 0.8 | 46.1 | 0.7 | 46.1 | 0.6 | 46.1 | 0.6 |
| (s) | 42 | 44 | 27 | 26 | 51 | 95 | 19 | 14 |
Acknowledgements.
This work is supported at INAF by ASI grant I/R/039/04 and by COFIN MIUR grant prot. number 2005025417, and at Penn State by NASA contract NAS5-00136.References
- [1] \BYChincarini G. et al. Proceedings of conference “The X-Ray Universe”, San Lorenzo de El Escorial (Madrid) (2006)
- [2] \BYCusumano G. et al. A&A, (2006), in press
- [3] \BYNousek J. et al. \INApJ6822006389.
- [4] \BYO’Brien P. et al. \INApJ6472006121.
Questions received:
-
1.
Question (A. Kann): Does the sample also include HETE II bursts with XRT follow up redshift (e.g. GRB 050408, GRB 051022)?
Answer: No because BAT/XRT comparisons were made.
-
2.
Question (S. Yost): When divided into redshift bins the average are lower at low z. Is there statistical evidence that it is more than just a selection effect on observations?
Answer: There are selection effects at low redshift that could lead to the observed result. But the most surprising feature is the flatness of at higher redshift, which is not expected. A statistical study has not yet been done, and will be more reliable with a larger sample, that at the present rate of detection would be obtained in a few months.