Using Swift observations of prompt and afterglow emission to classify GRBs
Abstract
Gamma-ray bursts, black holes, X-ray
We present an analysis of early BAT and XRT data for 107 gamma–ray bursts (GRBs) observed by the Swift satellite. We use these data to examine the behaviour of the X-ray light curve and propose a classification scheme for GRBs based on this behaviour. As found for previous smaller samples, the earliest X-ray light curve can be well described by an exponential which relaxes into a power law, often with flares superimposed. The later emission is well fit using a similar functional form and we find that these two functions provide a good description of the entire X-ray light curve. For the prompt emission, the transition time between the exponential and the power law gives a well-defined timescale, Tp, for the burst duration. We use Tp, the spectral index of the prompt emission, , and the prompt power law decay index, to define four classes of burst: short, slow, fast and soft. Bursts with slowly declining emission have spectral and temporal properties similar to the short bursts despite having longer durations. Some of these GRBs may therefore arise from similar progenitors including several types of binary system. Short bursts tend to decline more gradually than longer duration bursts and hence emit a significant fraction of their total energy at times greater than Tp. This may be due to differences in the environment or the progenitor for long, fast bursts.
1 Introduction
Gamma-ray bursts (GRBs) were originally discovered as short flashes of gamma-rays seen from a random, non-repeating location on the sky (Klebesadel et al. 1973). GRBs are now known to be extragalactic, many with large redshifts (Costa et al. 1997). During the prompt phase a GRB is intrinsically the most luminous single object in the Universe. Understanding the observed emission in the first few minutes to days following a burst is crucial in determining the nature of the energy source and the progenitor. Since its launch in November 2004, the Swift satellite (Gehrels et al. 2005) has provided a unique set of early-time X-ray light curves. Combining data from the Burst Alert Telescope (BAT) and the X-ray Telescope (XRT) allows for a determination of the temporal and spectral properties of a burst from the initial trigger out to days or even weeks.
It has become conventional to place GRBs into classes dependent on the observed duration of the prompt emission seen in the gamma-ray band. The T90 parameter is the timescale over which 90% of the gamma-rays were detected. Those GRBs for which T90 exceeds 2 seconds are described as “long” whereas those shorter than 2 seconds are described as “short” (e.g. Kouveliotou et al. 1993). The short bursts tend to have harder gamma-ray spectra than the long bursts. The observed flux can be represented as a function of time and frequency using , where is the spectral index and is the temporal index. The spectral index is related to the photon index by .
In this paper we summarise the X-ray observational results from Swift, following on from previous work (e.g. Tagliaferri et al. 2005; Nousek et al. 2006; O’Brien et al. 2006a). These papers and many others have shown that GRBs display a wide variety of phenomena during the few hours to days after discovery but that there are some common patterns emerging. It is already clear that a number of different emission components probably contribute to the observed flux, some due to processes in the luminous central engine or relativistic jet and some due to interaction of the jet with the surrounding environment. It is not our intention here to review all the possible emission processes but rather provide an overall view of the observed temporal and spectral behaviour of the largest Swift GRB sample yet studied and use them to suggest a GRB classification scheme.
We combine data from the BAT and XRT on Swift using a technique described in O’Brien et al. (2006a) but extended to provide a better description of the latter-time emission. We include data for 107 GRBs discovered by Swift up to 2006 August 1 for which prompt XRT observations were obtained. Here we discuss the behaviour concentrating on the first few hours to a day or so. In a companion paper (Willingale & O’Brien 2006) we discuss the latter emission and examine the correlations of observed properties with luminosity. This work is discussed in detail in Willingale et al. (2006). The sample is dominated by long bursts but includes a number of short bursts and probes the full range in observed fluence and redshift for GRBs detected by Swift.
2 BAT and XRT analysis
The BAT and XRT data were processed using the standard Swift analysis software. For the BAT, light curves and spectra were extracted over the 15–150 keV band. Spectral indices (), were derived by fitting power laws over the T90 period. Power law fits were also used to parameterise the XRT spectra over the 0.3–10 keV band. Most of the GRBs (59 out of 107) show evidence for excess absorption above the Galactic column.
The spectra extracted from the XRT data are usually best fitted by a softer power law than the BAT data (O’Brien et al. 2006a). Hence, to construct unabsorbed, 0.3–10 keV flux light curves we converted the BAT count rates into unabsorbed fluxes by extrapolating the BAT data to the XRT band using a power law model with an absorbing column derived from the XRT data and a spectral index which is the mean of the XRT and best-fit BAT spectral indices. The XRT count rates were converted into unabsorbed fluxes using the early XRT power law model.
3 The observed early temporal and spectral shape
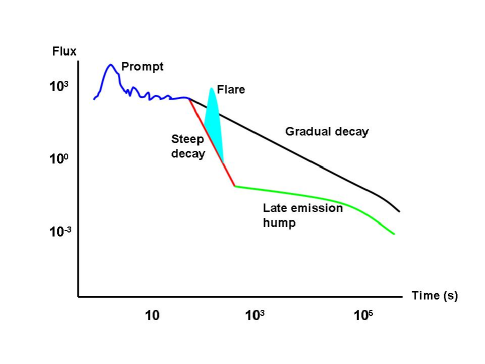
The variety in observed GRB light curves is shown schematically in figure 1 (O’Brien et al. 2006b). and can be summarized as:
-
1.
There is a “prompt” phase which includes the emission seen emitted during the burst. With Swift this emission is initially seen by the BAT but can also be detected by the XRT if the burst is long enough to last until completion of the first slew on to the target. Most bursts observed by Swift typically have a spectral index of 0–2 in the 15–150 keV band during the prompt phase.
-
2.
The burst is followed by a power law decline. The observed temporal index, , during this phase can be very large (up to ) but clusters around 2 (section 5). In a significant minority of GRBs the initial decay is more gradual with . The spectral index in the 0.3–10 keV band during the initial power law decay is usually in the range 0.5–2.5. In the fitting procedure, described below, we fit both the burst and the initial decline as one “prompt phase” denoted by subscript in fitted parameters. Emission following that phase is denoted by subscript (for afterglow) in fitted parameters. The wide range in the prompt temporal and spectral indices imply that several emission processes may be involved. O’Brien et al. (2006a,b) suggested that a combination of “high latitude” emission (Kumar & Panaitescu 2000) and afterglow emission (e.g. Mészáros & Rees 1997) can explain the early emission. This conclusion also applies for the larger GRB sample used here.
-
3.
For those bursts which initially decline steeply, the decay breaks to a shallower rate, typically within the first hour, such that . This “late emission hump”, modelled as an additional component (section 4), can last for up to s before breaking again to a steeper decay. Although faint in flux, this phase lasts so long that it has a significant fluence, so it is energetically significant. In fact the late emission has at most a fluence equal to that of the prompt phase (O’Brien et al. 2006a).
-
4.
Limited statistics make quantifying later phases difficult, but both the initially steeply declining bursts and those that decline more gradually can show a late temporal break (typically at – s) to a steeper decay. These late breaks are not seen in all GRBs — some decay continuously beyond s until they fade below the Swift XRT detection limit. The behaviour of this phase is described in Willingale & O’Brien (2006) and Willingale et al. (2006).
-
5.
X-ray flares are seen in the first few hours for around half of the GRBs observed by Swift , and occur in GRBs which decline rapidly or gradually. The majority of these flares are only detected in the XRT but in some bright, long bursts flares are observed simultaneously with the BAT. Strong spectral evolution can be observed in some cases. Most of the X-ray flares are energetically small, but a few are very powerful with a fluence comparable to that of the prompt phase (e.g. Burrows et al. 2005). Late flares are also occasionally seen. Flares are excluded in the fitting procedure used here and we do not consider them further in this paper.
-
6.
The X-ray light curves for short bursts have been less well studied by Swift as they are fainter (on average) and Swift has detected fewer examples. The Swift short bursts are included in our GRB sample.
The behavioural pattern of prompt emission followed by a steep X-ray decay and then a shallow decay has been characterised as the “canonical GRB light curve” (Nousek et al. 2006). This pattern is seen in the majority of GRBs (perhaps three-quarters or so), but not in all. To try and understand the different phases we have developed a parameterised functional fitting procedure summarised below.
4 The parameterised temporal and spectral behaviour
In order to compare the different GRB light curves we have followed and expanded the procedure outlined in O’Brien et al. (2006a). There we found that the initial prompt emission was described well by an exponential which relaxes into a power law. Here we extend that concept to fit the prompt emission and the late emission hump using a similar function.
The flux light curve () for both the prompt and later emission are well fitted by the same functional form:
| (1) |
| (2) |
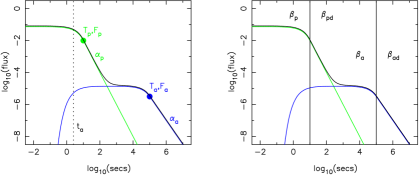
The subscript refers to the prompt component (figure 2). The transition from the exponential to the power law occurs at the point where the two functional sections have the same value and gradient. A similar pair of equations are used to fit the late emission hump with an “afterglow” component, denoted by subscript . Thus, we have fitted the X-ray light curves of all of the GRBs using two components of the form . Details of the fitting procedure are given in Willingale et al. (2006). The fitted components are shown schematically in figure 2 along with the corresponding spectral indices.
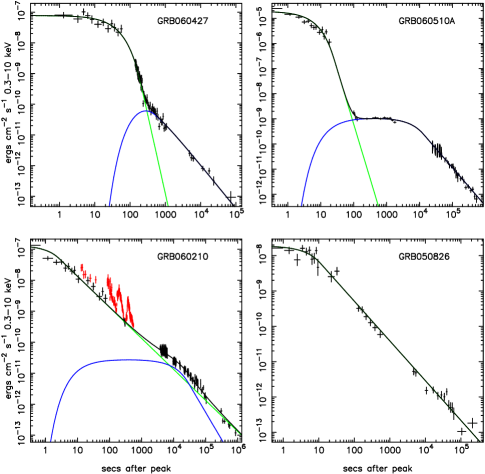
Four example fits are shown in figure 3. The top panels show examples of the most common type of burst in which there is a detectable second component. The initial decay is very steep for GRB060427 () although it only lasts for a very short period of time. Similarly for GRB060510A. In the bottom-left panel the afterglow component is less prominent in GRB060210, but forms a bump in the light curve. In this burst the initial decay is quite shallow (). The numerous small flares in GRB060210 do not appear to disturb the overall decay. The afterglow component is not detectable in GRB050826 (bottom-right panel).
Using the fitting procedure, we obtain results for the larger GRB sample which are consistent with those presented in O’Brien et al. (2006a,b). Rather than restate the full results of that analysis, for the rest of this paper we concentrate on the possibility of using the fitted parameters to help classify GRBs.
5 Classifying a GRB
Traditionally GRBs have been classified into short and long bursts based primarily on T90. Those below 2 seconds are classified as short and it has been noticed that they tend to have harder prompt spectra (Kouveliotou et al. 1993). In the Swift era we should examine if additional parameters, such as how fast the burst decays, may provide additional information. It has already been noticed that some bursts which appear long in terms of T90 may be more related to short bursts in terms of their host galaxies (e.g. Barthelmy et al. 2005) or in terms of the observed inter-band time-delays (e.g. Gehrels et al. 2006). Unfortunately data such as the nature of the GRB host are not always available. Here we examine if use of the Tp parameter, the prompt spectral index, , and the early X-ray decay rate, , can be used to provide a classification scheme.
The transition time between the prompt exponential and power law decay can be used to define a measure of burst length, Tp. This uses information from both the BAT and XRT instruments and rather than a measure of how long the gamma-ray instrument detected the burst instead is a measure based on the shape of the light curve. For many burst Tp is comparable to T90 (O’Brien et al. 2006a,b) but it can be considerably shorter or longer.
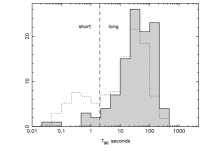
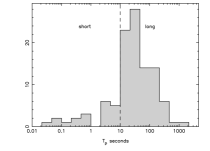
In figure 4, the left-hand panel compares the T90 distribution for the BATSE (Paciesas et al. 1999) and Swift samples including the conventional division at 2 seconds between short and long bursts. Compared to BATSE, the Swift sample contains significantly fewer short bursts as a fraction of the total, possibly due to the different spectral range and trigger system (e.g. Band 2006). It is not clear there is a division between the two populations in the Swift sample. The possibility of a more continuous distribution is further emphasised if we use the Tp distribution, as shown in the right-hand panel of figure 4. In that panel we define a division at 10 seconds which we propose as it is close to the peak in the Tp distribution and defines a tail of shorter values.
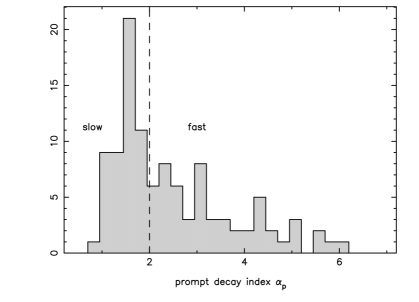
There is a wide range in the observed initial decay rate, , following the burst (figure 5). There are some GRBs extending up to very high rates of decay, although such rates are maintained for only a short period of time. The decay index distribution shows a peak close to and a tail to higher values, so we have divided the sample into “slow” and “fast” decays at . This divides the population approximately in half.
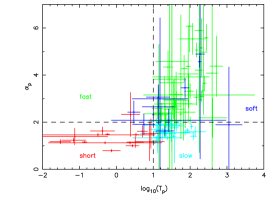
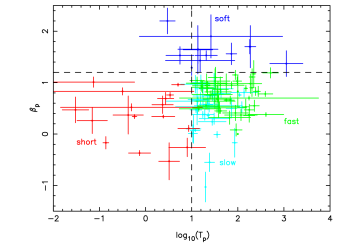
Examining the correlation of and with Tp (figures 6 and 7) shows that the shorter duration bursts tend to be harder, as found previously, but also decay more gradually following the burst. From these figures it can be seen that a value of combined with the previously discussed T and sub-divides the GRBs into well-defined sectors of figures 6 and 7. We therefore propose a sub-division of GRBs into four groups based around cuts at T seconds, and . Using both spectral and temporal properties to classify GRBs is reasonable as these properties should depend in part on the nature of the progenitor and its surrounding environment. Using the observed properties may lead to a closer understanding of the various types of progenitor. The four GRB groups are defined as:
-
1.
Short bursts with T seconds and .
-
2.
Slow bursts with T seconds, and .
-
3.
Fast bursts with T seconds, and .
-
4.
Soft bursts with Tp and of any value and .
Although, as in all such schemes, such as using T90, one can argue about precisely what exact division in parameter space to use, this classification method does separate the two main groups of short and fast (long) bursts, but at a larger value of duration (T seconds) than traditionally used for T90. It also defines two further groups, one of which — the slow bursts – have spectral and temporal decay properties which overlap with the short bursts. The soft bursts are define solely in terms of spectral shape, are similar to X-ray flashes and overlap mostly with the longer duration bursts.
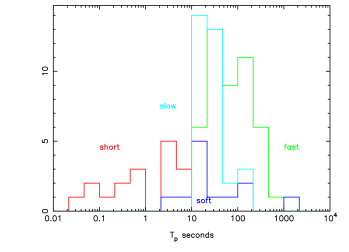
The distribution of the four groups of GRB as a function of duration Tp is shown in figure 8. It is interesting that the slow bursts form a clear peak. Of course this peak is truncated at the short duration end by the definition of short bursts applied here, but falls rapidly at long durations in contrast to the fast decay bursts. It is thus tempting to suggest that a fair fraction of the slow bursts may be longer-duration variants of the short bursts and hence may arise from similar progenitors. The fast, longer-duration GRBs may arise from a different progenitor if the rate of decay of the X-ray emission is related to the local environment. The soft GRBs are located towards the centre of the distribution. The long-duration soft GRB at the far-right of the distribution is GRB060218, an unusual GRB in many respects (Campana et al. 2006).
The classification scheme outlined here is an extension of that previously used but can be improved by better statistics and by including other parameters where available, including the inter-band time-delay (Norris 2002). Currently, some bursts which appear long in terms of T90 nevertheless have other properties which appear to place them in the subset of GRBs which may not be due to collapsars (e.g. Barthelmy et al. 2005; Gehrels et al. 2006). It has been usual to suppose that binaries may not produce long-duration bursts, and indeed this seems unlikely for neutron-star binaries. However, other binaries, such as neutron-star black hole systems or white-dwarf neutron-star systems (King 2006), may be capable of producing emission over longer intervals if one of the binary pair is fragmented and accreted over a relatively long period. Such systems could help explain the fact that the “short” bursts which decay slowly actually emit a large fraction (%) of their energy at times greater than Tp. If a scheme involving all of the observed prompt parameters can be developed it may be possible to disentangle the various progenitor types and truly classify GRBs.
6 Acknowledgments
The authors gratefully acknowledge funding for Swift at the University of Leicester by PPARC, in the USA by NASA and in Italy by ASI.
References
- [1]
- [2] Band, D., 2006, ApJ, 644, 378–384
- [3]
- [4] Barthelmy, S.D. et al., 2005, Nature, 438, 994–996
- [5]
- [6] Burrows, D.N. et al., 2005, Science, 309, 1833–1835
- [7]
- [8] Campana, S. et al., 2006, A&A, 454, 113–117
- [9]
- [10] Costa, C. et al., 1997, Nature, 387, 783–785
- [11]
- [12] Gehrels, N. et al., 2004, ApJ, 611, 1005–1020
- [13]
- [14] Gehrels, N. et al., 2006, Nature, submitted
- [15]
- [16] King, A.R., 2006, this volume
- [17]
- [18] Klebesadel, R.W., Strong, I.B., Olson, R.A., ApJ, 182, L85–L88
- [19]
- [20] Kouveliotou, C. et al., 1993, ApJ, 413, L101–L104
- [21]
- [22] Kumar, P, Panaitescu, A., 2000, ApJ, 541, L51–L54
- [23]
- [24] Mészáros, P., Rees, M.J., 1997, ApJ, 530, 232–237
- [25]
- [26] Norris, J.P., 2002, ApJ, 579, 386–403
- [27]
- [28] Nousek, J. et al., 2006, ApJ, 642, 389–400
- [29]
- [30] O’Brien, P.T. et al., 2006a, ApJ, 647, 1213–1237
- [31]
- [32] O’Brien, P.T., Willingale, R, Osborne, J.P., Goad, M.R., 2006b, New Journal of Physics, 8, 121–139
- [33]
- [34] Paciesas, W.S. et al. 1999, ApJS, 122, 465–495
- [35]
- [36] Tagliaferri, G. et al., 2005, Nature, 436, 985–988
- [37]
- [38] Willingale, R., O’Brien. P.T., 2006, this volume
- [39]
- [40] Willingale, R et al., 2006, ApJ, submitted
- [41]