11email: lutz.haberzettl@astro.rub.de 22institutetext: Kapteyn Astronomical Institute, University of Groningen, P.O. Box 800, NL-9700 AV Groningen, The Netherlands
Low Surface Brightness Galaxies around the HDF-S
Abstract
Aims. The aim of this study is to extend the parameter space for Low Surface Brightness (LSB) galaxies to reach lower central surface brightnesses, smaller sizes and higher number densities.
Methods. This study reports on photometric results of a search for LSB galaxies in a 0.76 deg2 field centered on the Hubble Deep Field-South (HDF-S). We present results from photometric analysis of the derived sample galaxies and compare number densities to results of former surveys. We used public data from the NOAO Deep Wide-Field survey and the multi-wavelength Goddard Space Flight Center survey. The former reaches a limiting surface brightness of 29 mag arcsec-2 and is therefore one of the most sensitive ground based data sets systematically analyzed for LSB galaxies. The search was performed with two methods. For faint objects, with a blue central surface brightness of 24 mag arcsec-2, we applied a spatial filtering method in combination with an object search by eye. For brighter objects ( 22 mag arcsec-2) we used an automatic search routine. To reduce the contamination by High Surface Brightness (HSB) galaxies at higher redshift, mimicking LSBs due to the “Tolman Dimming” effect, we placed a lower dimater limit of 108 and compared the colors of our cadidate galaxies with the redshift tracks of 5 “standard” HSB galaxy types.
Results. We report the detection of 37 galaxies with low apparent central surface brightness ( 22 mag arcsec-2). Using color-color diagrams we were able to derive a subsample of 9 LSB galaxy candidates with intrinsic central surface brightnesses below = 22.5 mag arcsec-2 and diameters larger than the preselected size limit of 108. We selected three additional LSB candidates due to there extreme low blue central surface birghntess ( 25 mag arcsec-2). These galaxies were only found in the larger and more sensitive NOAO data. So finally we derived a sample of 12 LSB galaxy candidates and therfore this survey results in a four times higher surface density than other CCD based surveys for field galaxies before. to smaller scale-length and fainter total
Key Words.:
Surveys – galaxies: photometry – galaxies: fundamental parameters(colors, radii)1 Introduction
In the early 70’s, the results of galaxy surveys were strongly biased by selection effects, which led for example to the so called Freeman Law. From a study of 32 disk galaxies Freeman (1970) found that all galaxies have nearly the same disk central surface brightness of = 21.650.3 mag arcsec-2. The distribution in surface brightness appeared to follow a Gaussian distribution, and much fainter and much brighter objects did not appear to exist. However, more sensitive observations in the following years were able to show that this distribution was biased and that surface brightness selection effects suppressed the detection of the population of LSB galaxies (Disney & Phillipps, 1983; Davies, 1990). During the last years it became increasingly clear that LSB galaxies represent an important part of the local galaxy population.
Early searches in photographic catalogs, like the UGC catalog (Nilson, 1973), already showed that galaxies with a central disk surface brightness fainter than 23 mag arcsec-2 (this is more than 3 fainter than the Freeman value) do exist in significant numbers. The amount of Low Surface Brightness (LSB) galaxies in the diameter limited UGC catalog is much higher, compared to magnitude limited catalogs (Impey & Bothun, 1997).
After recognizing these selection effects, the use of new amplification techniques and new emulsions led to more sensitive photographic surveys. Searches for galaxies using these surveys (e.g., visual inspections on POSS-II plates) could be done to a much deeper surface brightness limit of 27.5 mag arcsec-2 (Schombert & Bothun, 1988; Schombert et al., 1992; Impey et al., 1988) resulting in higher surface densities for LSB galaxies. Due to these advancements the surface density of cluster LSB galaxies was increased to 11 per square degree (Impey et al., 1988). For field LSB galaxies the surface density increased to 0.2 LSBs per square degree (Binggeli et al., 1990). Galaxy clusters are more dominated by the dwarf elliptical LSBs (Sabatini et al., 2003, 2005), whereas the general field is dominated by gas rich galaxies.
With the advent of large CCDs, much more sensitive surveys became possible. These surveys resulted in even higher values for the surface densities of LSB galaxies. The ’Texas survey’ (O’Neil et al., 1997a, b) for example reports a surface density of 4 LSB galaxies per square degree in the general field, which is 20 times the old value from Binggeli et al. (1990).
Studies of the amount of LSB galaxies in catalogs like the UGC first showed that LSB galaxies are not necessarily HI poor dwarfs (Romanishin et al., 1982). A population of gas rich LSB disk galaxies exists, which even contains the largest and HI richest objects known today (e.g., Malin I; Bothun et al., 1987). In the last couple of years it was demonstrated that LSB galaxies represent an important part of the local galaxy population (O’Neil et al., 2004; Minchin et al., 2004).
However, until now the formation and evolution processes of the population of LSB galaxies are not well understood. One evolutionary scenario that described the existence of LSB galaxies as the result of faded High Surface Brightness (HSB) galaxies could be ruled out since they do not have extremely red colors suggested by this scenario. LSBs are found to exist over the whole color range of HSBs (McGaugh & Bothun, 1994), although they mainly have blue colors. However, one possible explanation for the evolution of LSBs is based on the star formation activity in these galaxies. From current sets of data it appears that star formation in LSBs propagate with a much lower rate than in HSB galaxies (van den Hoek et al., 2000). A possible explanation of this reduced star formation could be the low HI surface density found in LSB galaxies. In most cases the HI density does not reach the empirical threshold of Kennicutt (1989) above which star formation should occur (van der Hulst et al., 1993; Pickering et al., 1997).
In this paper, we describe a search for LSB galaxies using deep ground based CCD mosaic imaging data of a region including the HDF-S, as well as all flanking fields. The main goal of this search is to enlarge the parameter space known for LSB galaxies. With our data we reach smaller disk scale-lengths, fainter total magnitudes, and a larger sample volume than previous surveys, however, it covers a relatively small survey area of 0.76 square degree. The resulting sample is expected to have a significant contamination of redshifted, cosmologically dimmed HSB galaxies, which we try to eliminate by comparing the colors of the selected LSB galaxy candidates to those of five standard, redshifted HSB galaxies (see Sect. 3.3). The structure of the paper is as follows: in Section 2 we present the photometric data used for this search, Section 3 describes the analysis we have done including search methods and phtometry, in Section 4 we present the results of our analyssis, while we end in Section 5 with summary and conclusions.
2 Data
For our study we used two different public data sets of deep CCD mosaic imaging programs centered on the Hubble Deep Field South. The first data set was obtained in 1998 (19.-24.09.) at the CTIO as a pilot field for the NOAO Deep Wide-Field survey (Dell’Antonio et al., 1999). The observations were done using the Blanco-4m-Telescope, equipped with the Big Throughput Camera (BTC). The BTC is a mosaic camera build out of 4 CCD detectors. Each CCD has 2048 2048 pixels2 with a pixel size of 24 corresponding to a scale of 043 per pixel. Due to dithering and a large cross-shaped gap between the individual CCDs, the final effective field of view is about 0.76 .
| Filter | Origin | Total Exp. Time |
|---|---|---|
| NOAO | 31920s | |
| NOAO | 3400s | |
| GSFC | 15600s | |
| GSFC | 7200s | |
| GSFC | 4500s | |
| GSFC | 4800s | |
| GSFC | 5100s |
The NOAO data consists of observations in two filter bands ( and ). For the search we used the filter, which is broader than the typical Johnson filter and shows an extension into the wavelength region of the filter. The observations were conducted partly to get a better understanding of the broader, non-standard filter, which was later also used for the NOAO Deep Wide-Field Survey.
The final image was generated by NOAO, using dithering and combining 38 exposures. The resulting image covers a continuous field of 56′ 56′( 7800 7800 pixels). The exposure-time for each individual exposure was 840s, with a mean seeing of 1.7″. The object detection limit in surface brightness of the final combined image is about 27 mag arcsec-2 and the limiting surface brightness of the data is about 29 mag arcsec-2. The dithering results in a non-uniform sensitivity of the image leading to a lower sensitivity at the edges of the field and around the holes in the image. However, our sample has just one candidate located in a region with lower sensitivity (LSB J22311-60160). Which is reasonable because LSB objects would not appear in regions of low signal to noise. All other selected objects are located in regions with uniform sensitivity. Therefore, we do not account for this effect, which, however, provides us with lower limits for our results. The R band data which were also observed by NOAO are less sensitive and cover a significantly smaller field compared to the band data and were therefore, not used for our studies.
In order to get multi-color information of the objects detected in the field, we used a second dataset, made available by the STIS instrument team at Goddard Space Flight Center (GSFC). This dataset includes observations in five filters (, , , , and ). The observations were also obtained in September 1998 using the Blanco 4m Telescope equipped with the BTC. Compared to the NOAO data the GSFC data are less sensitive in surface brightness ( 0.5 mag″-2) and detection limit ( 0.5 mag) and cover a smaller field of view, but they are well calibrated and span a larger color range (Teplitz et al., 1998). The GSFC field is 474460 (6592 6400 pixels) in size with a scale of 043 per pixel. Throughout this paper we use the term “multi-color” for those objects which have measurements in the NOAO –band, and the GSFC ,,,,–bands.
Exposure times and filters of all CCD mosaic fields are
listed in Table 1. The central positions of the NOAO
field is = 22h32m59s.5,
= -603533,
whereas the GSFC observations are centered at
= 22h33m35s.1,
= -603345. All
coordinates are given for epoch J2000.
3 Analysis
3.1 Search Method and Selection Criteria
As mentioned before, the search for LSB galaxy candidates was done using the data of the NOAO, being the most sensitive of the data at our disposal. To identify the LSB galaxies we used different search methods for objects with a brightner or fainter than 24.5 mag arcsec-2.
The faint LSB galaxy candidates, with 24.5 mag arcsec-2 were extracted with a digital filter method adapted from the one described by Armandroff et al. (1998). We cut the full image into 9 regions in order to speed up the filtering process and to make the handling of the image easier. To subtract bright stars and galaxies, which influence the filtering every region was searched with the source extraction program SExtractor (Bertin & Arnouts, 1996), optimized for detecting small and bright objects. In addition to the object list, SExtractor can return a background image and an object image including only the extracted objects.
To create a background–image SExtractor removes all sources using a -clipping algorithm and estimates the background by derving the mode in each mesh of a grid overlaid on the original image. The mesh size is variable, but should not be to small otherwise the background could be affected by the presence of residuals of objects. If the meshes are to large the small scale variations in the background could not be reproduced. Typical values of the mesh size for most images are in the range of 32 to 128 pixels. For our search we chose a mesh size of 64 pixels, as it is recommended by Bertin & Arnouts (1996). For the object image (needed to remove the detected objects from the science data) we used a small detection filter (default.conv), in combination with a detection-threshold of 3 and a minimum detection area of 5 pixels.
We then generated a background subtracted and source free image by subtracting the two SExtractor produced images from the original. As a next step we filtered these images with a median filter using a fixed kernel size of 25 pixels corresponding to our chosen diameter limit of 10.8 . One has to keep in mind that this 25 pixel kernel sets a strong selection criterion against much smaller and larger objects. We searched the resulting images by eye for local brightness maxima, which represent extreme LSB galaxy candidates.
For brighter LSB galaxy candidates with 24.5 mag arcsec-2 a small SExtractor parameter study showed that we could use a simpler approach, using the output of SExtractor directly, since such candidate objects were noticed to be present in the SExtractor produced object-images and catalogs and therefore were subtracted from the original images during the search for faint LSB galaxies 24.5 mag arcsec-2 (see above). To improve the search for LSB galaxies we choose a filter for SExtractor which is optimized to find faint and large objects. For our final search we used a modified tophat-filter with a kernel width of 21 pixels (comparable to the diameter selection criterion used, see below). In the resulting new SExtractor-tables we searched for galaxies with low central surface brightnesses.
In order to derive a candidate sample of LSB galaxies we applied several selection criteria. As a first step we selected only galaxies with a central surface brightness below = 22 mag arcsec-2, which is just 1 below the so–called Freeman value of 21.65 0.3 mag arcsec-2 and therefore covers an overlap in with HSB galaxies. In addition to the surface brightness criterion, we also selected for galaxy diameter (D29). We only included galaxies which have diameters larger than 10.8 arcsec. We used this relative large diameter limit in order to avoid a substantial contamination by high redshift galaxies, which are cosmologically dimmed into the LSB surface brightness range (see Sect. 3.3). While we may thus introduce a bias against dwarf or relatively distant LSB galaxies, we expect it to result in a cleaner sample of LSB galaxies.
Using the two described search methods and applying our two selection criteria (22.0 mag arcsec-2, D29 10.8 arcsec), we were able to derive a total sample of 37 galaxies in the larger and more sensitive image of the NOAO. After extracting these LSB candidates from this image we tried to locate them in the smaller and less sensitive multi-color data of the GSFC. This left us with an overlapping, multi-color sample of 19 candidates. The remaining 18 candidates were at locations in the NOAO image which were not covered by or did not have the required sensitivity in the GSFC data.
3.2 Photometry and Profile Fitting
After the selection of the candidate galaxies, we extracted their photometric parameters. For this step we first subtracted the background light from the NOAO -image using the SExtractor background image and then fitted isophotes with ellipses using the ellipse task included in the IRAF/STSDAS package. We also fitted the -band data of the GSFC in the same way. For the photometric calibration of the ,,,, images we used the calibration from the Goddard Space Flight Center/STIS team (parameter see Table 2):
| (1) |
In Eqn. 1 we use counts per second (CPS) for the flux.
In order to fit ellipses with the ellipse task we allowed to vary the center position, the ellipticity as well as the position angle for the fitted ellipses. For the ellipses we choose a logarithimic spacing in radial direction with a step size of 0.1, meaning the next ellipse is fitted going inward from the position of the first one, at 1/(1 + step size)SMA in pixel (SMA = Semi Major Axis) (see IRAF help for geompar).
| Filter | C | X | AIRMASS | K | COLOR |
|---|---|---|---|---|---|
| 23.032 | -0.392 | 1.172 | 0.041 | - | |
| 25.385 | -0.204 | 1.168 | 0.133 | - | |
| 25.561 | -0.108 | 1.248 | 0.022 | - | |
| 25.748 | -0.049 | 1.180 | – | – | |
| 24.899 | -0.033 | 1.187 | 0.051 | - |
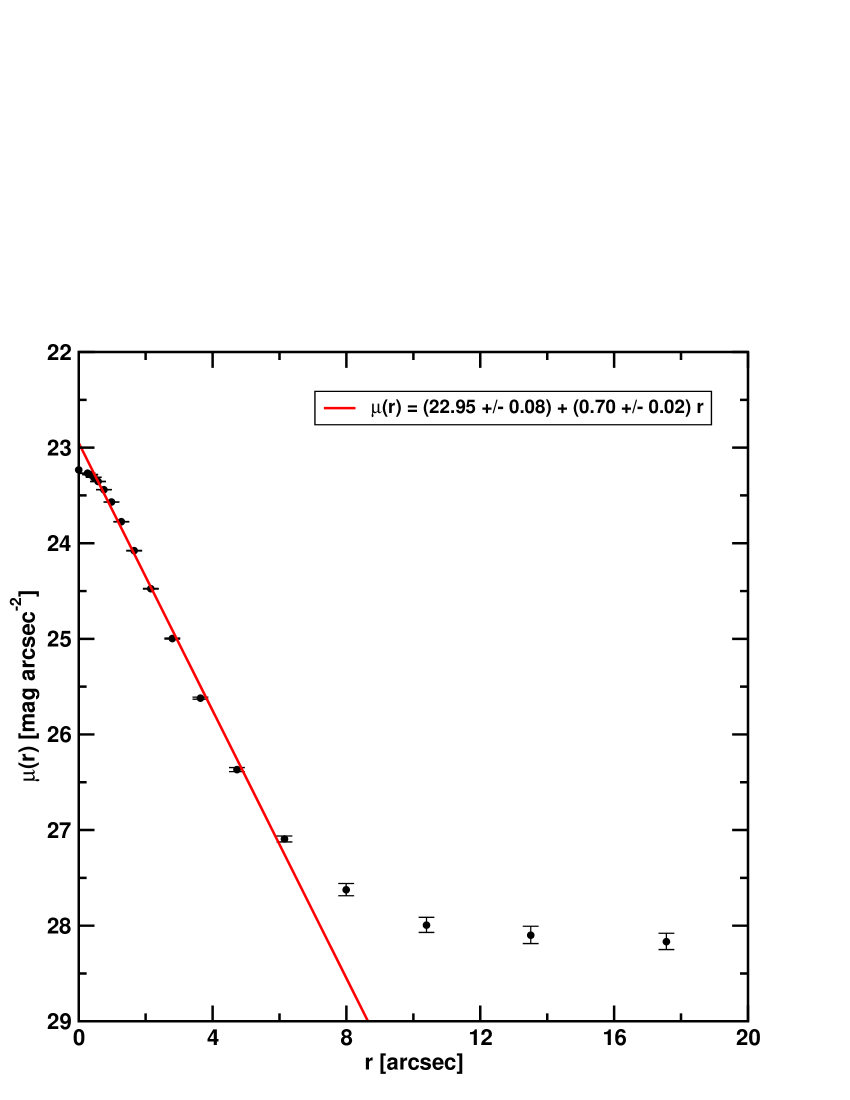
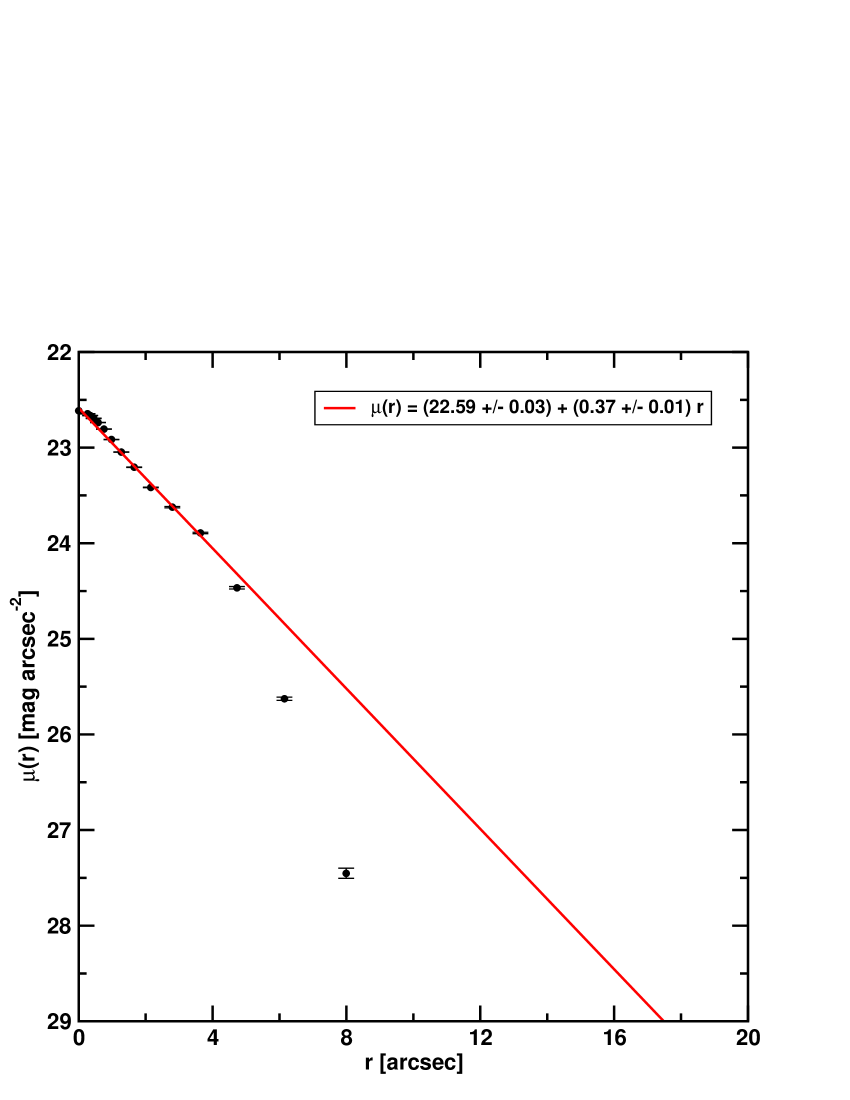
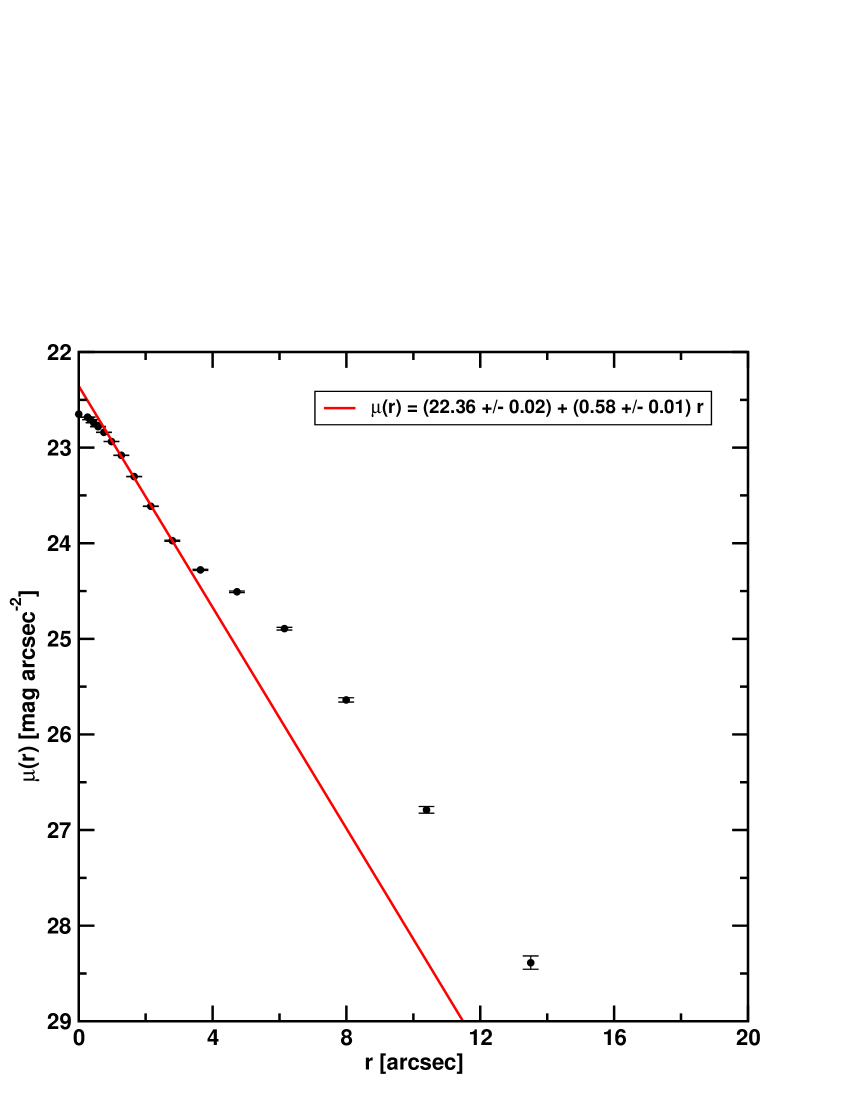
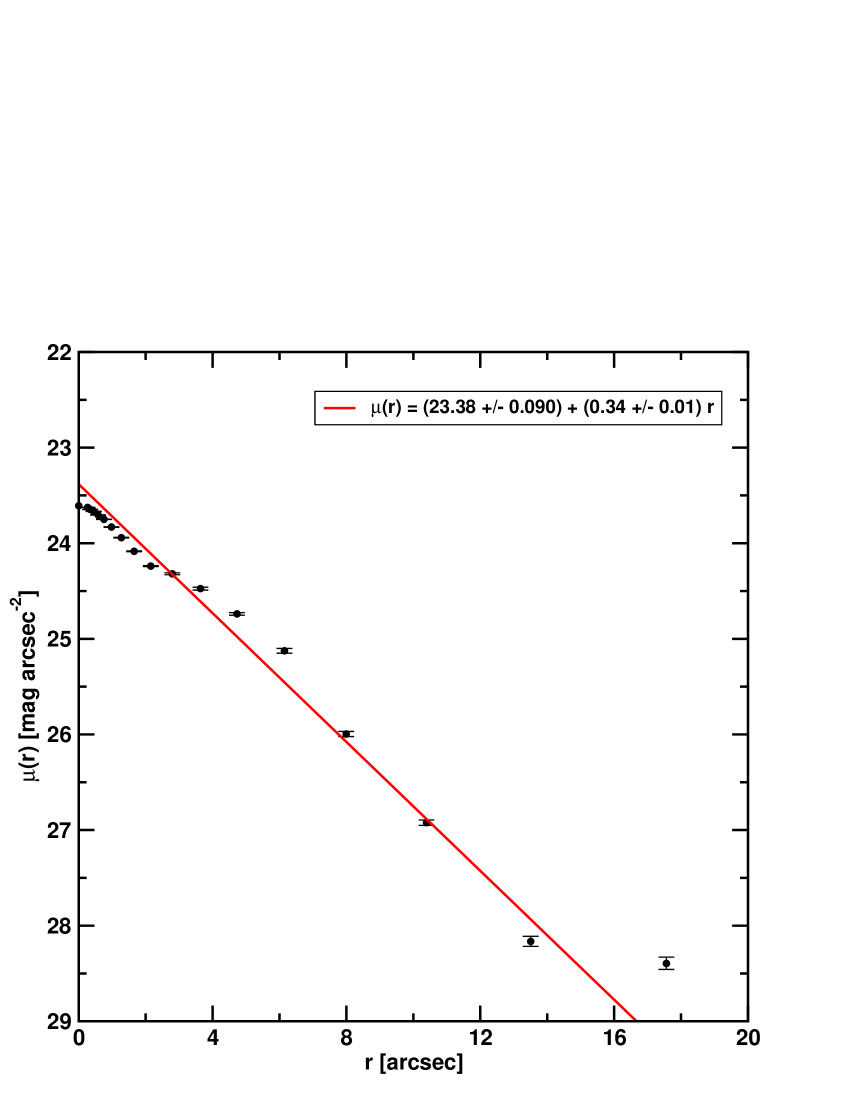
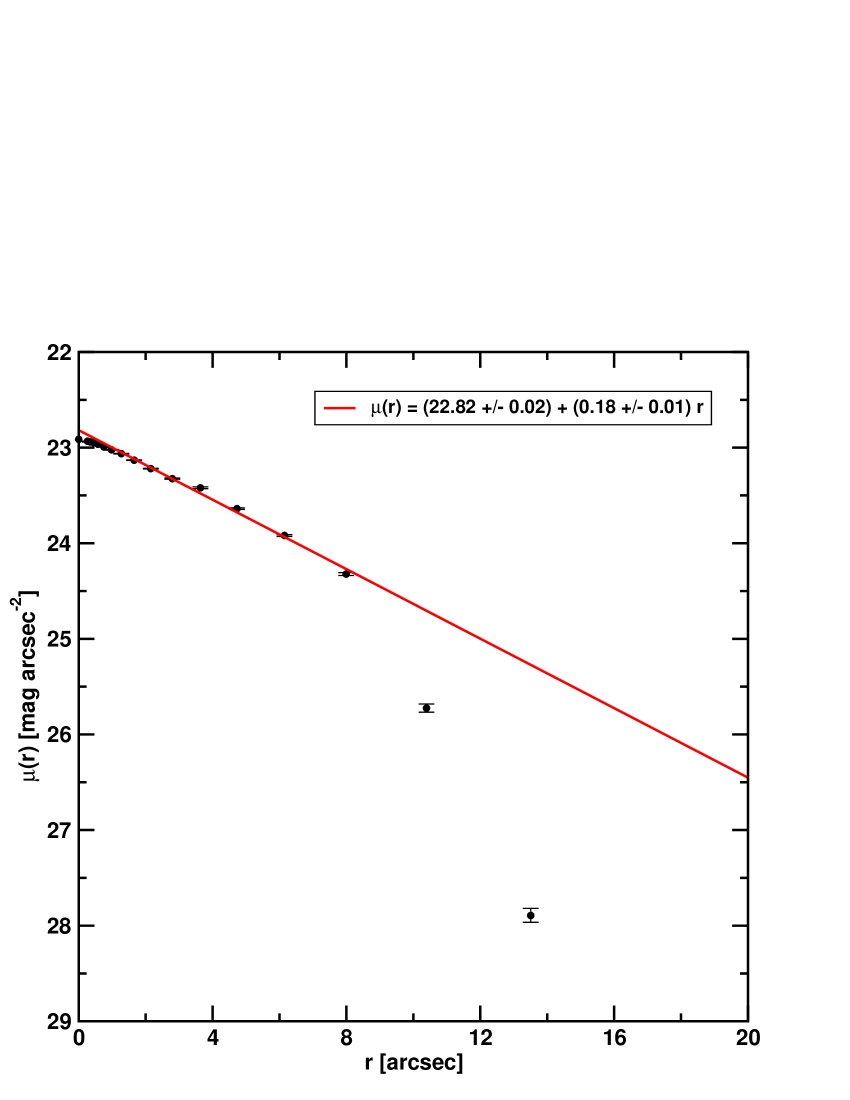
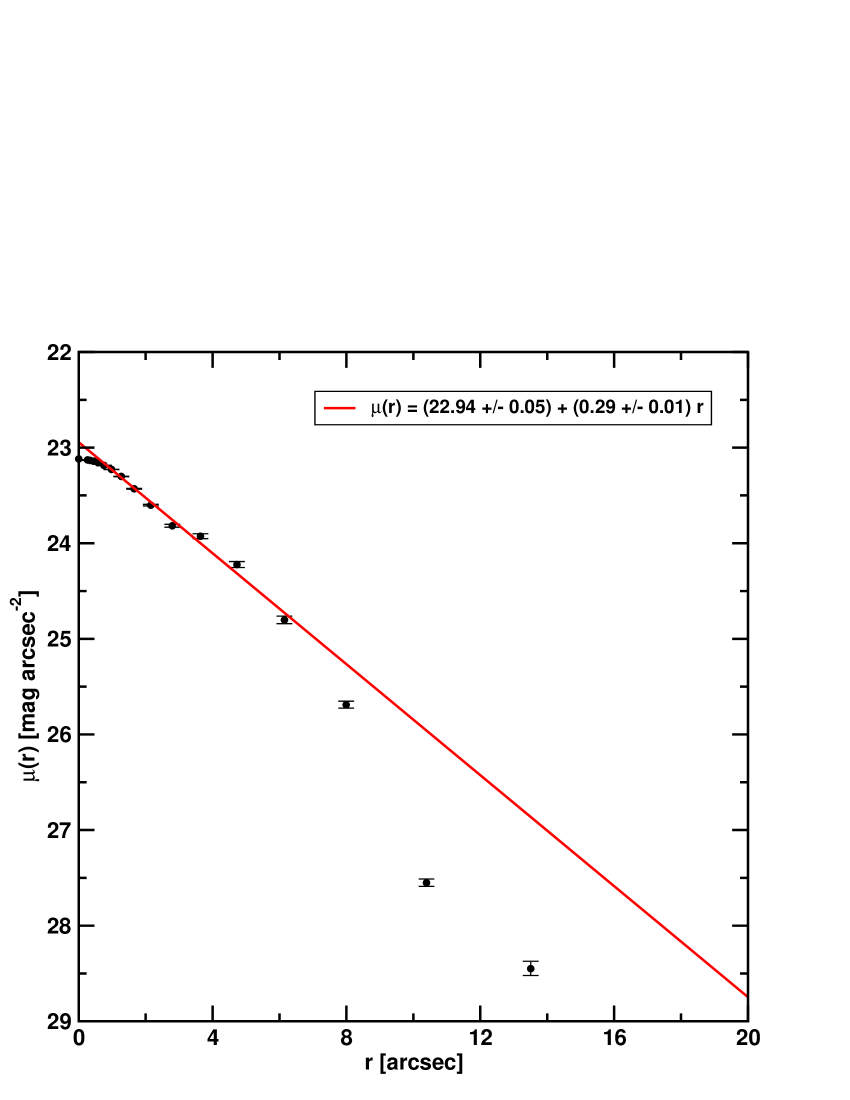
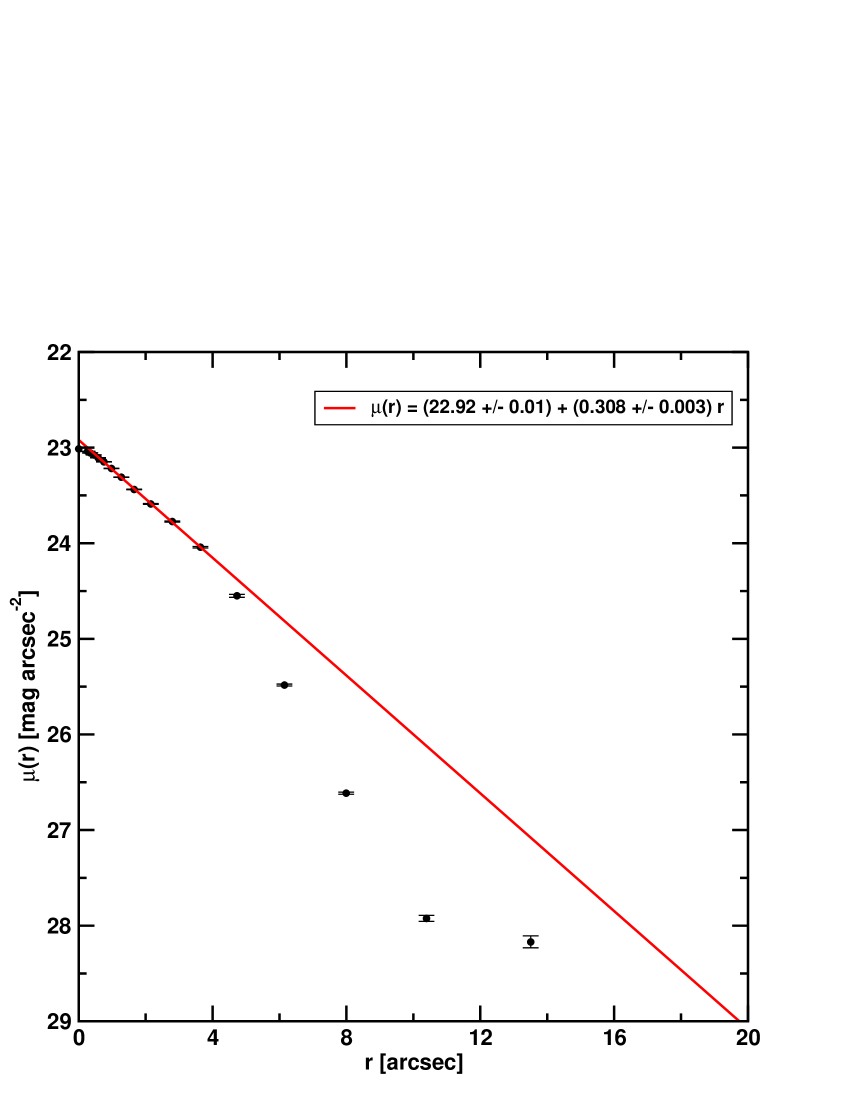
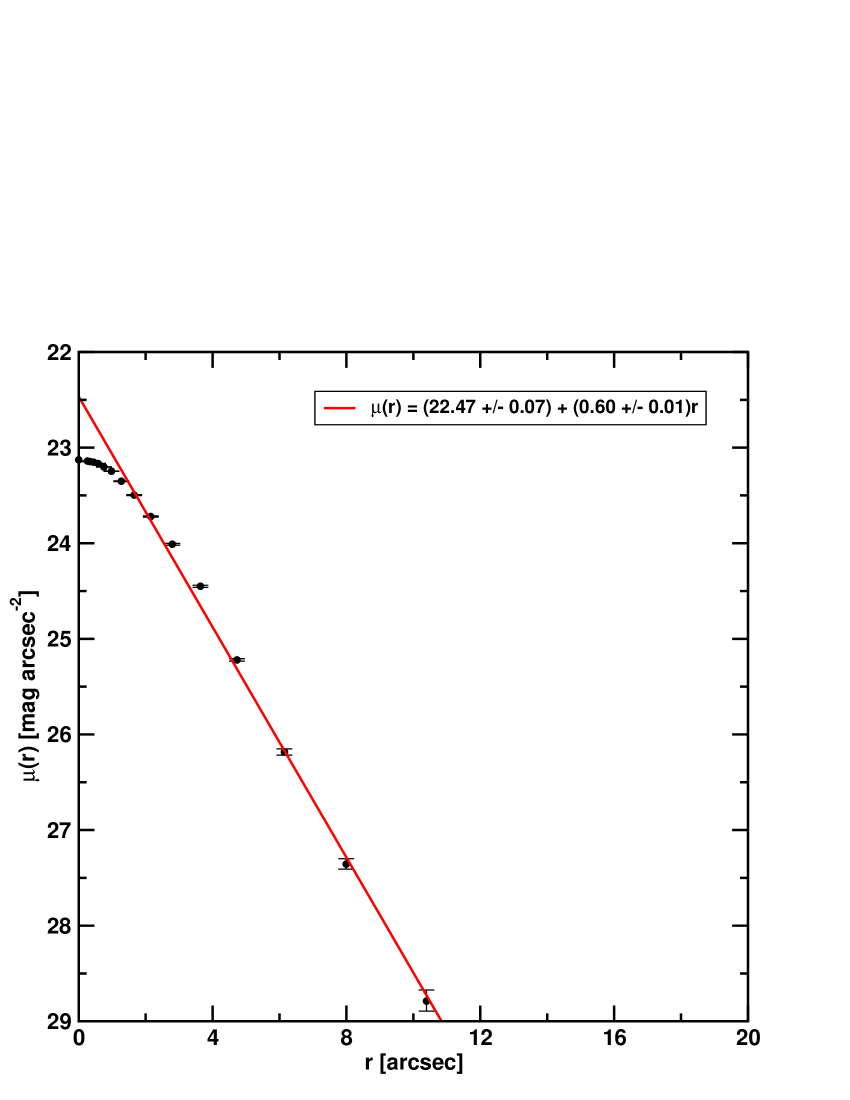
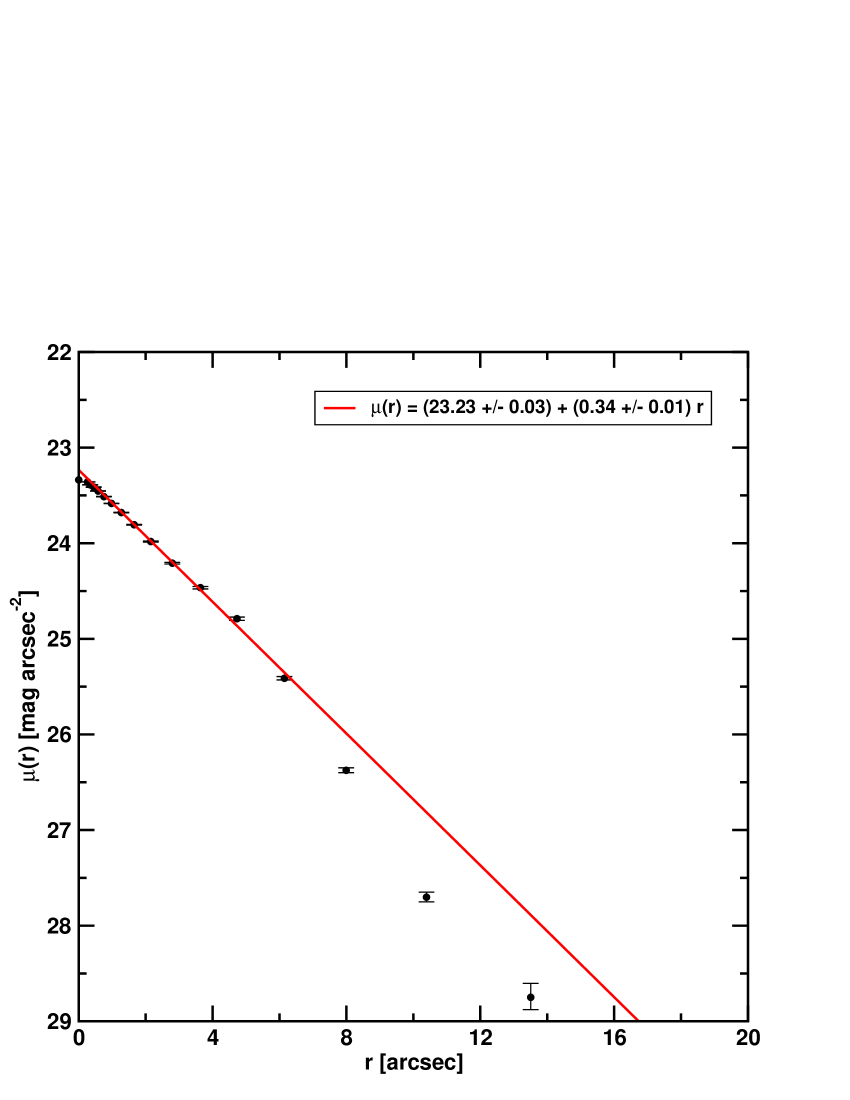
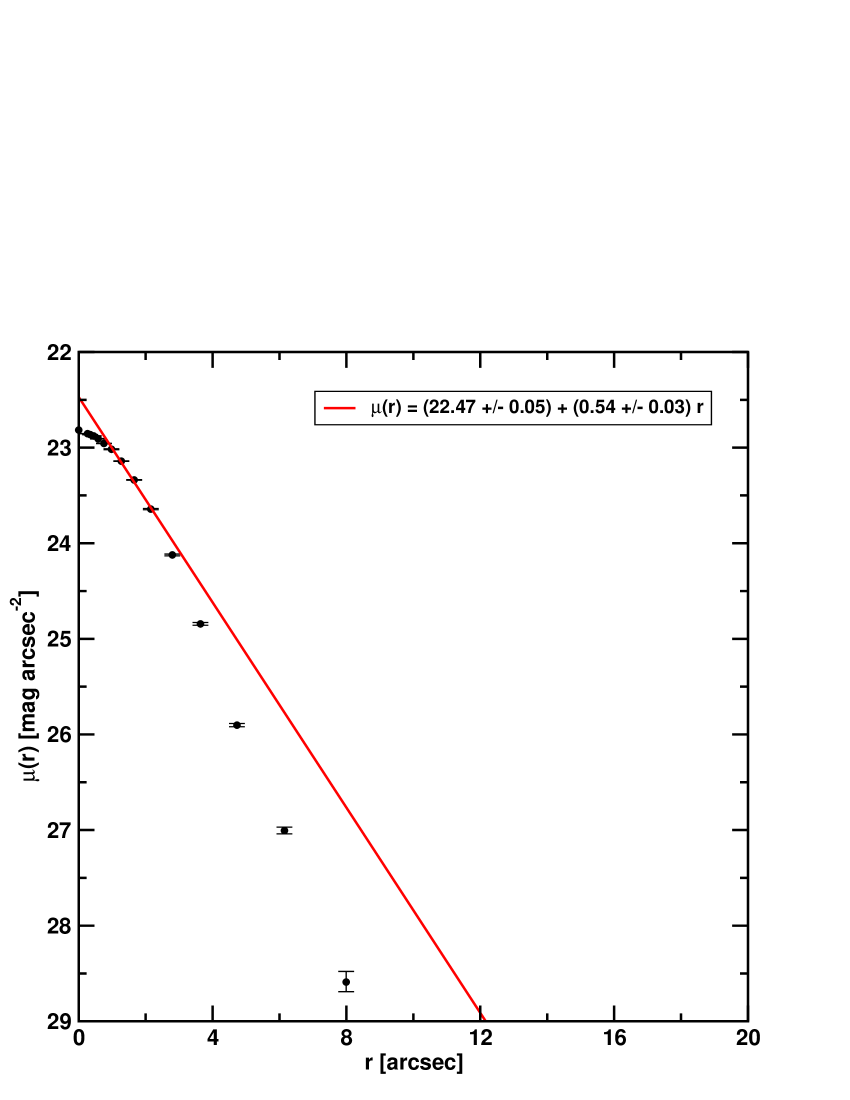
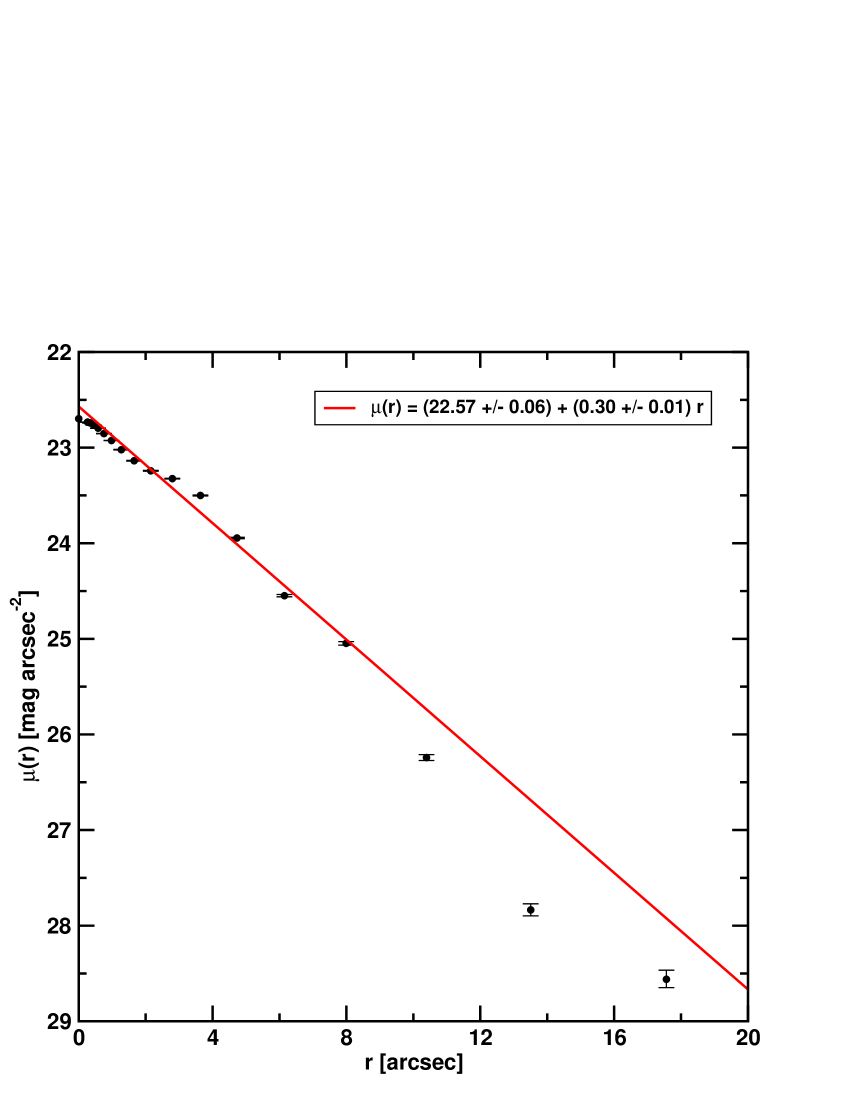
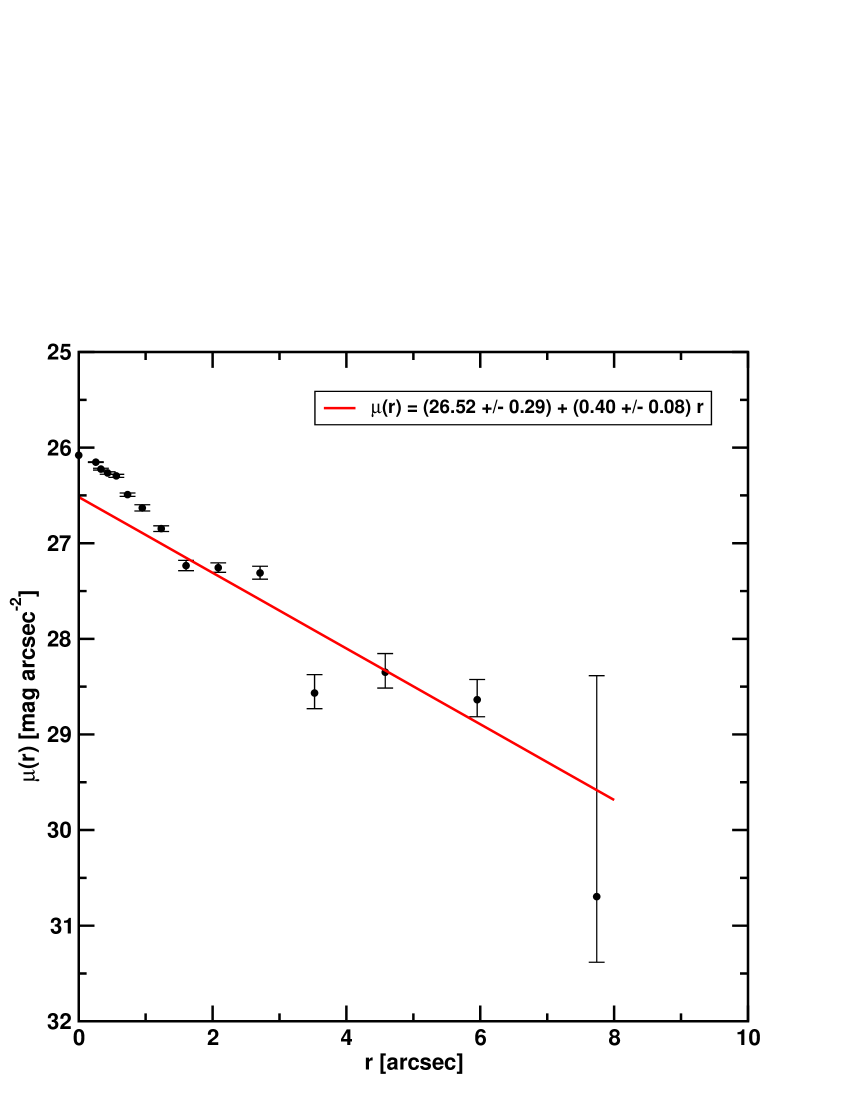
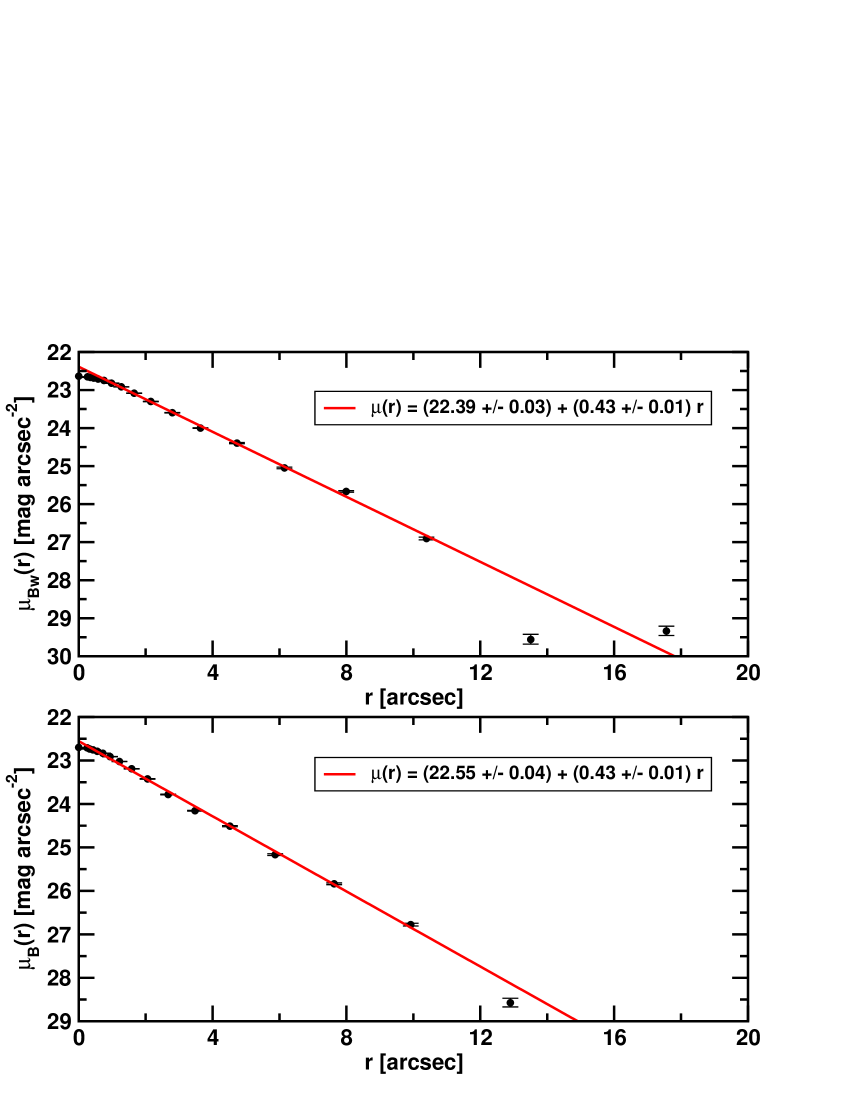
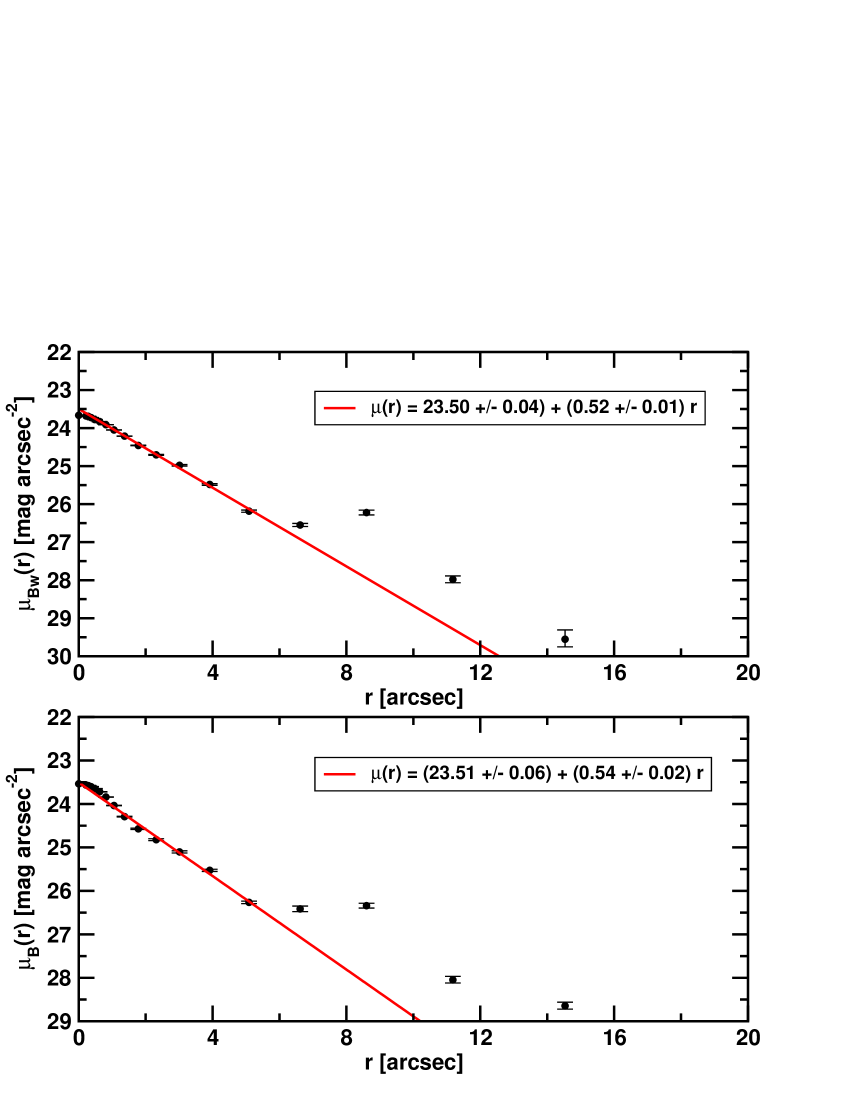
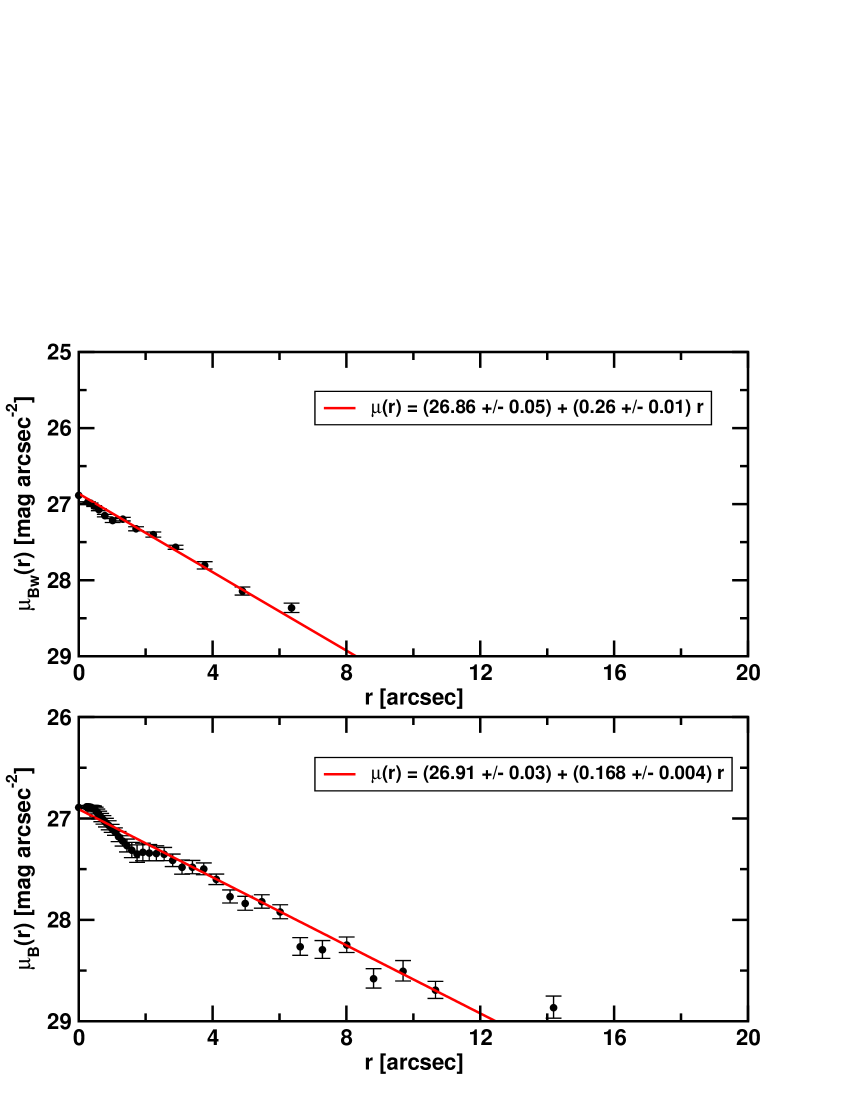
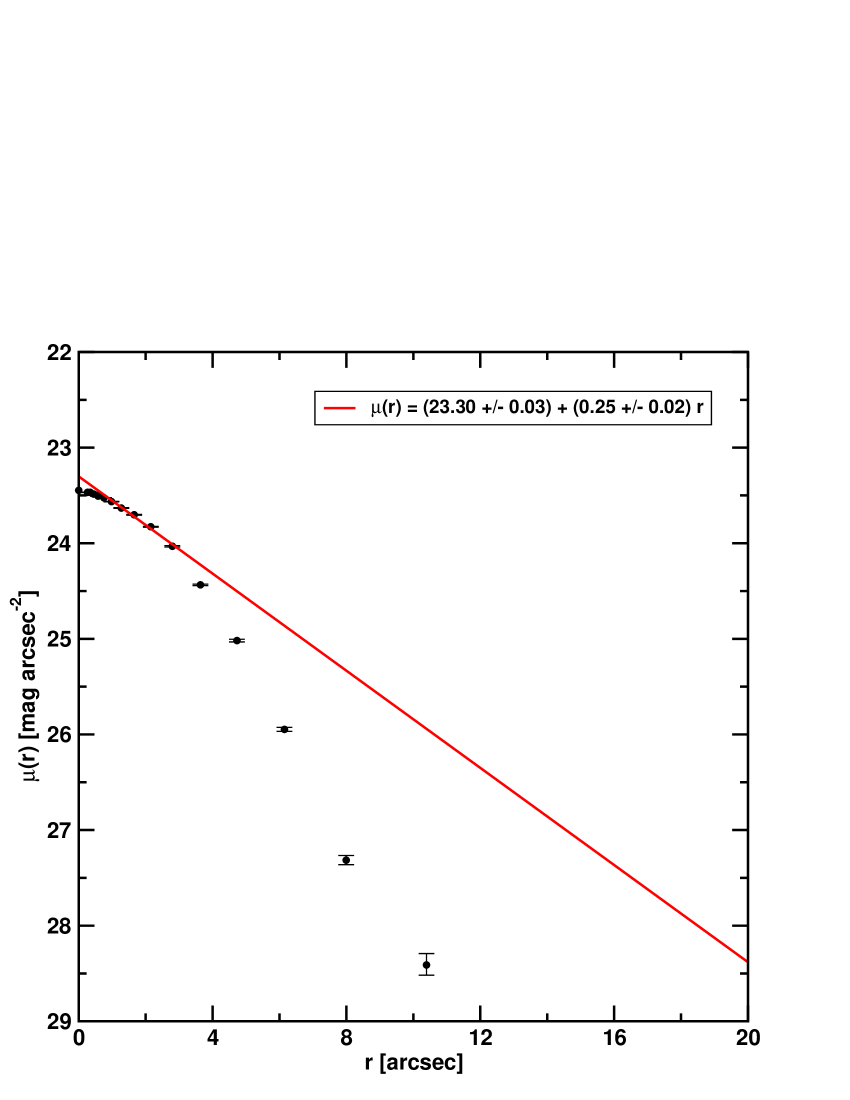
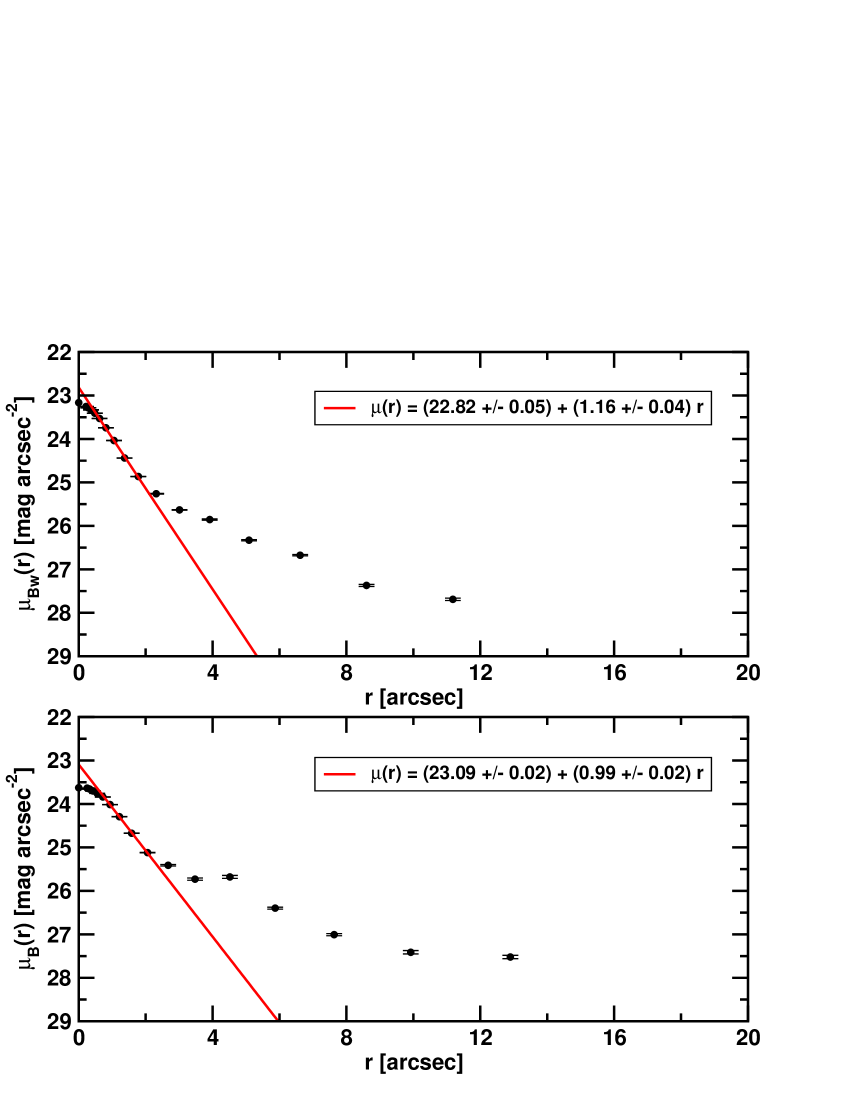
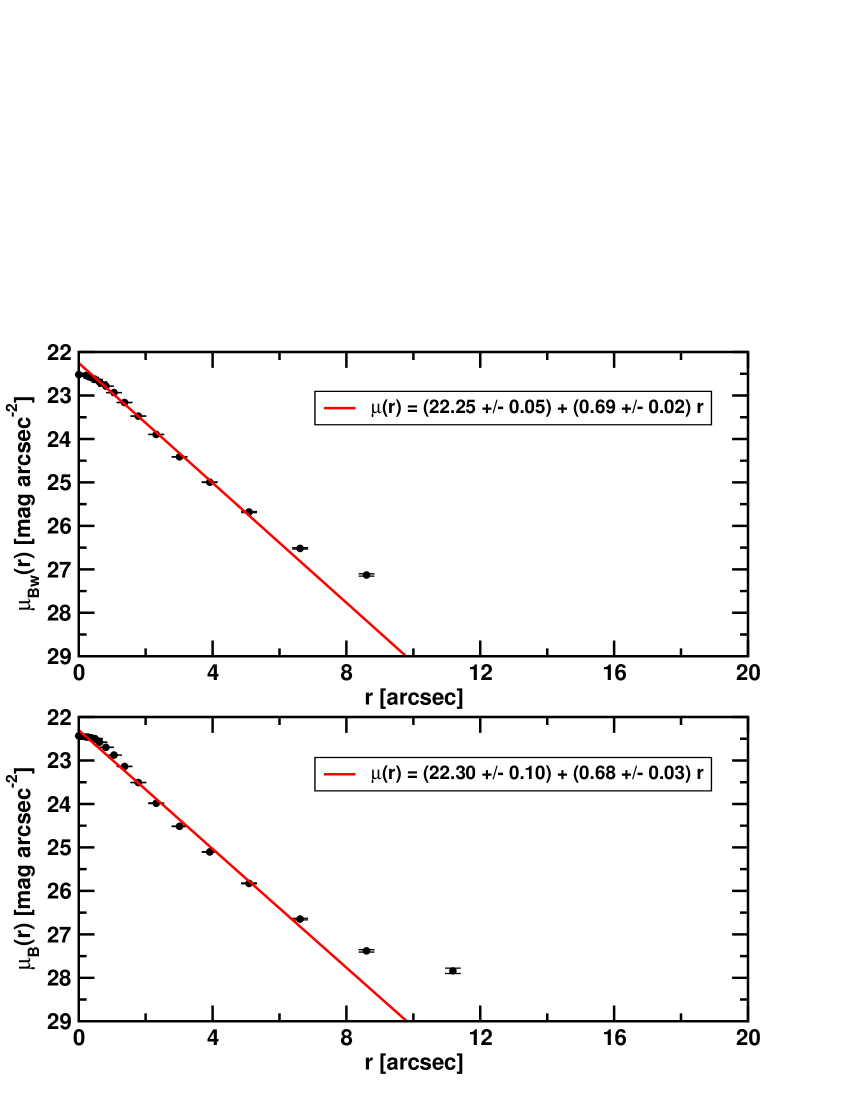
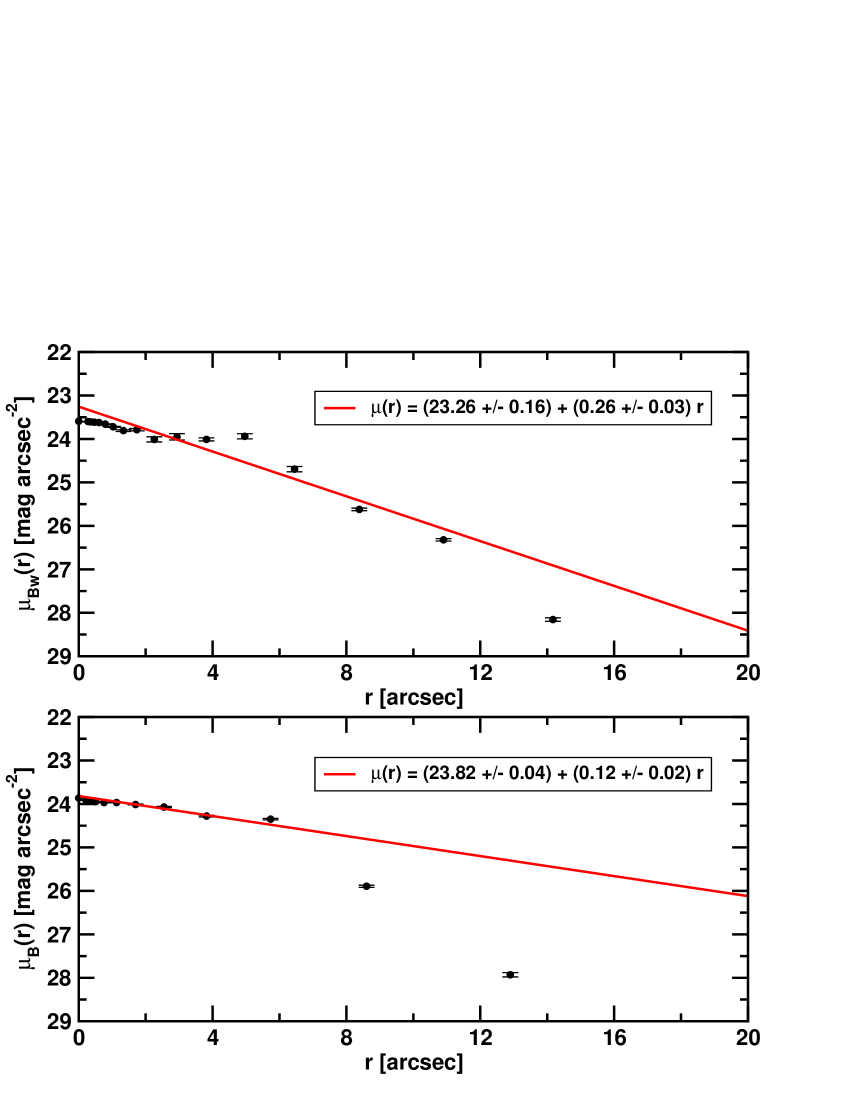
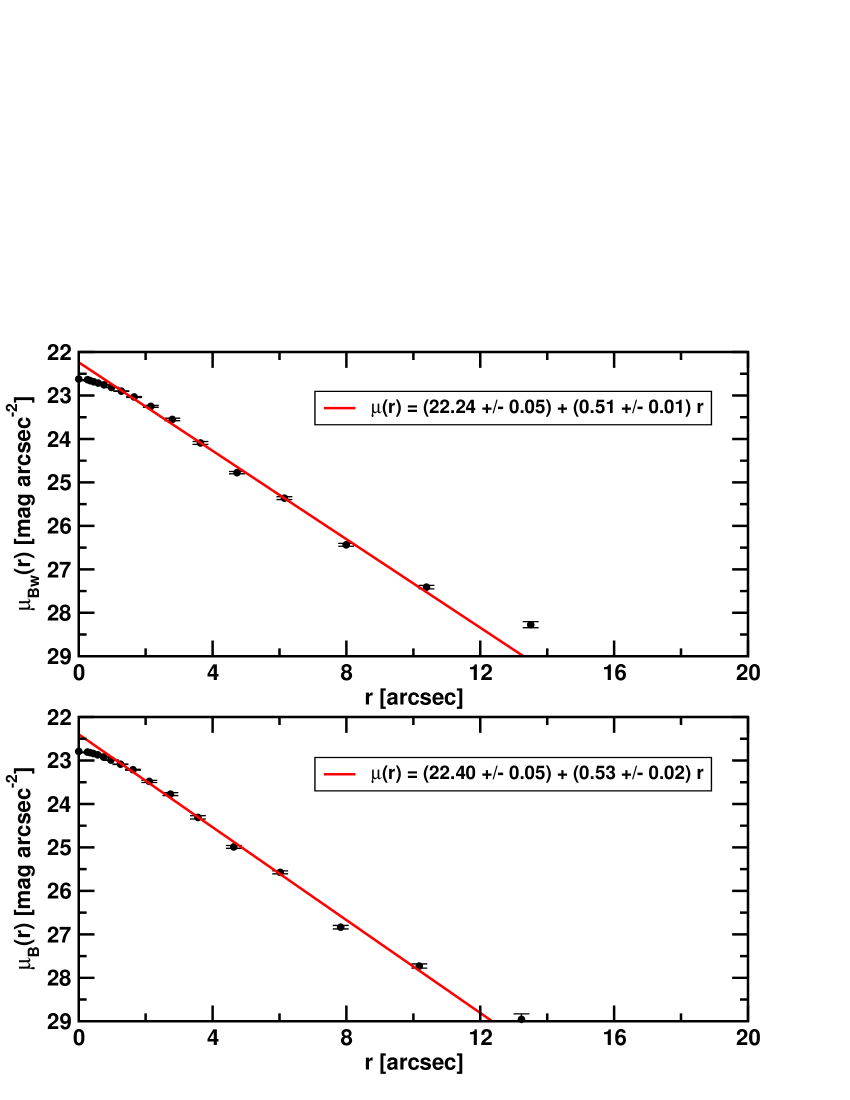
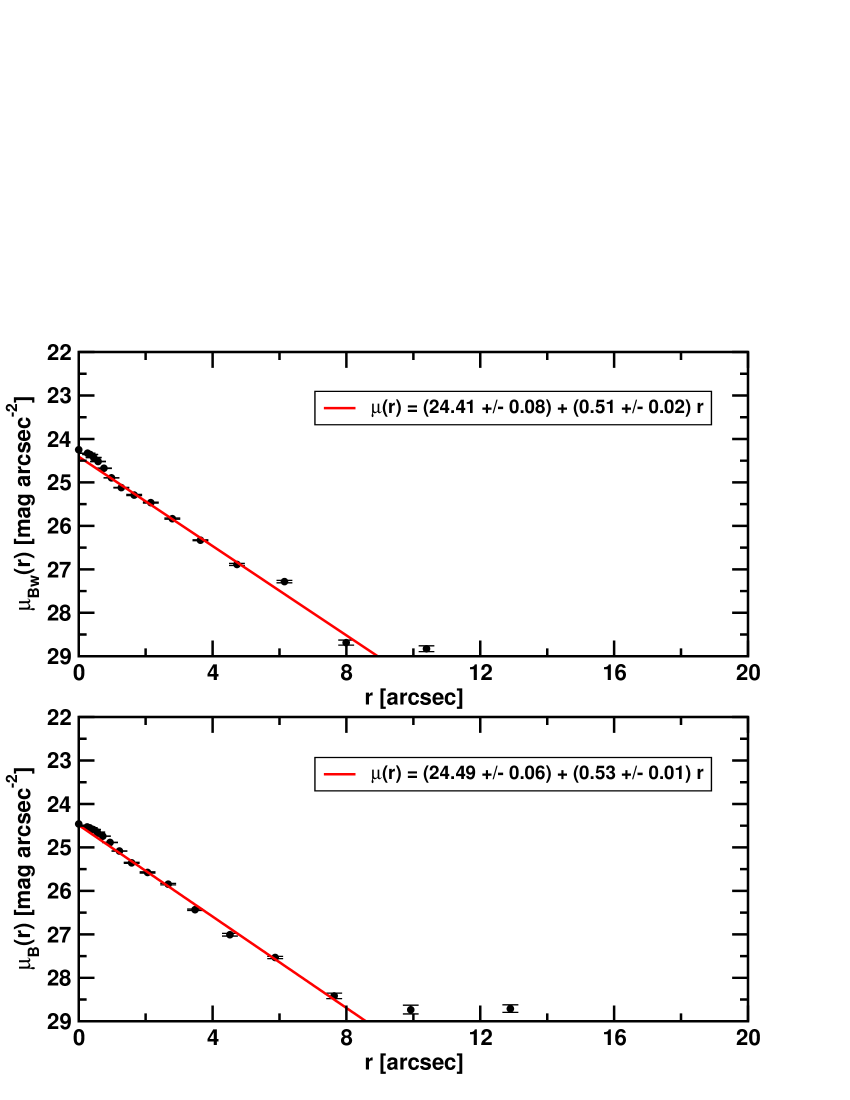
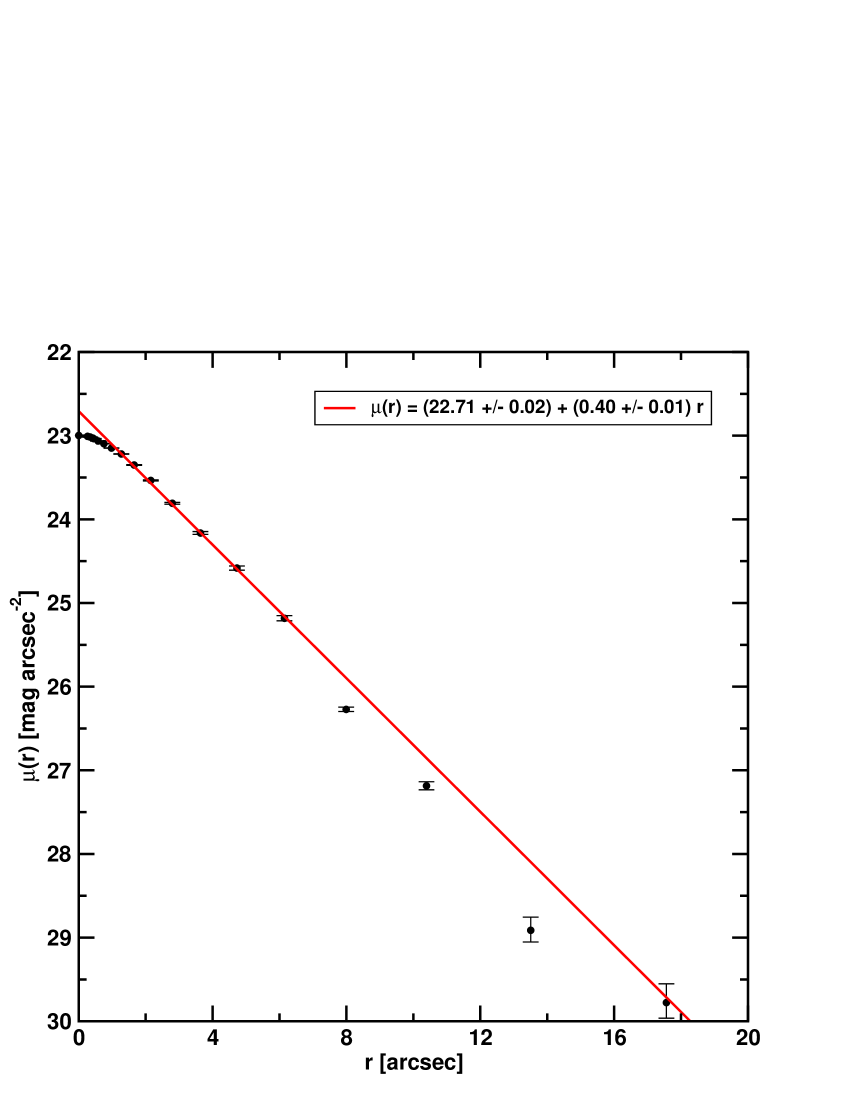
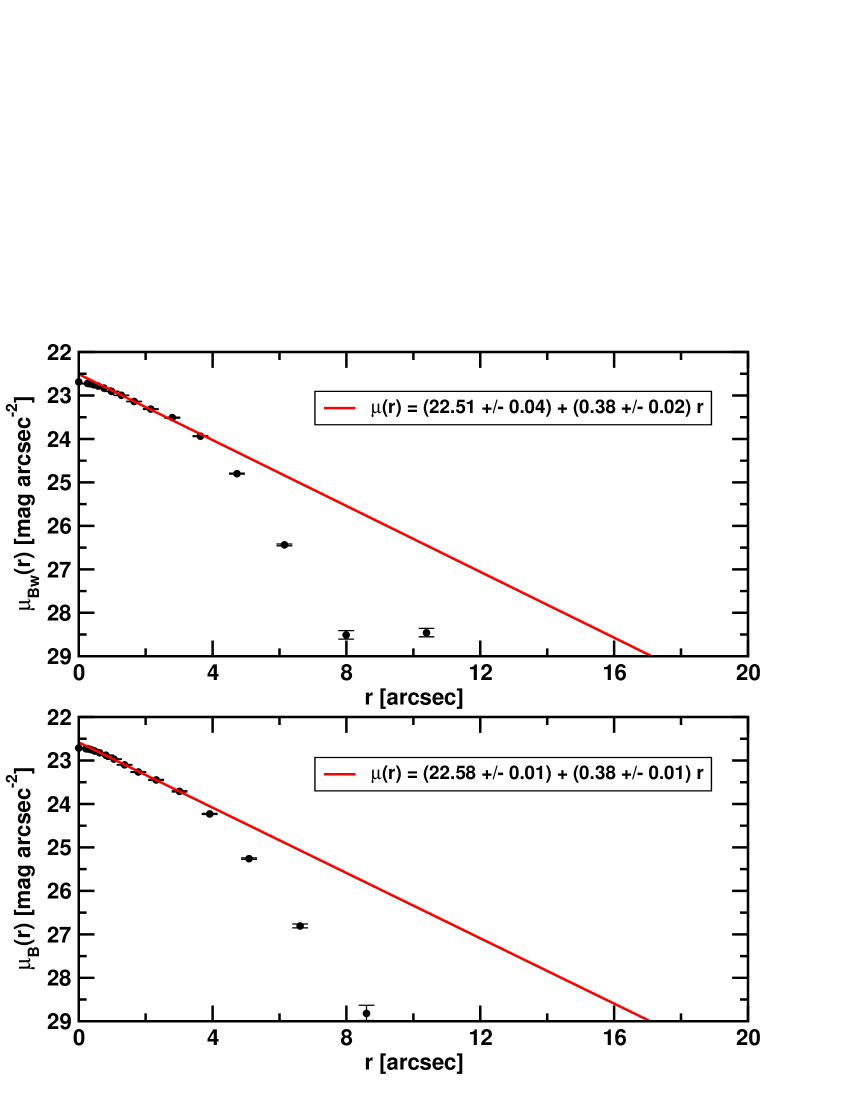
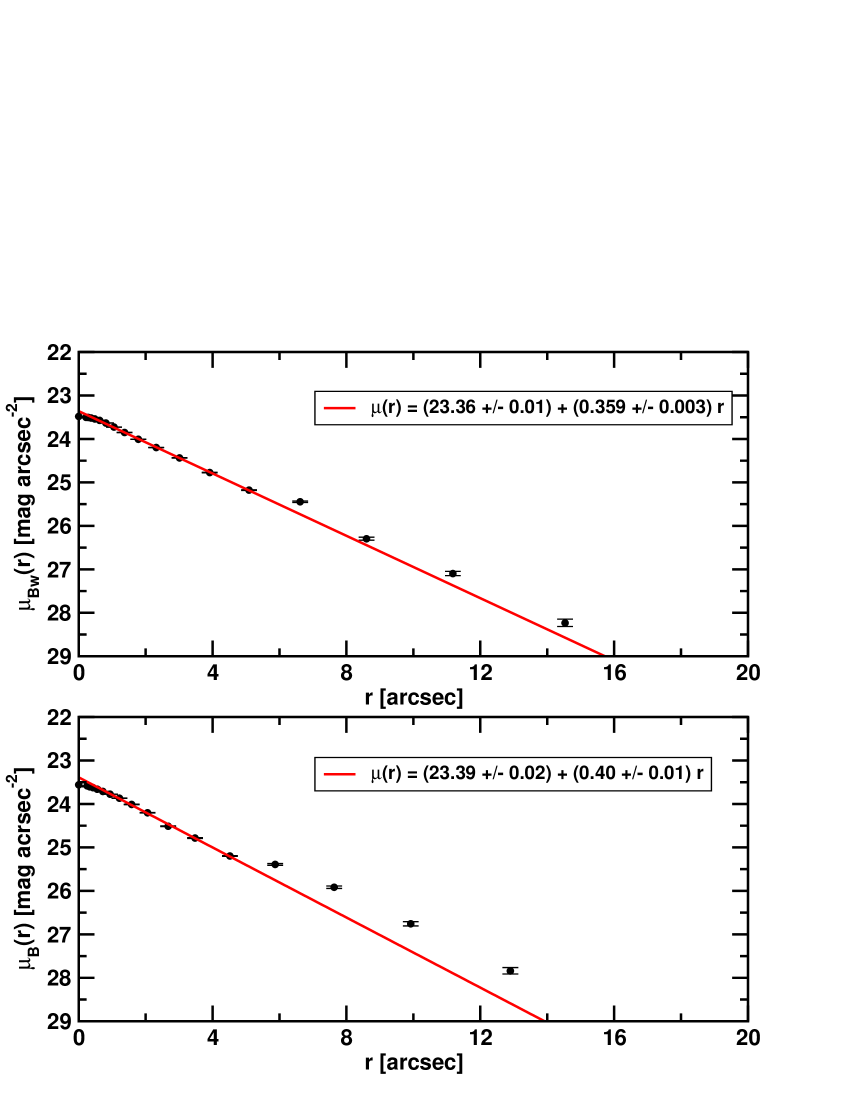
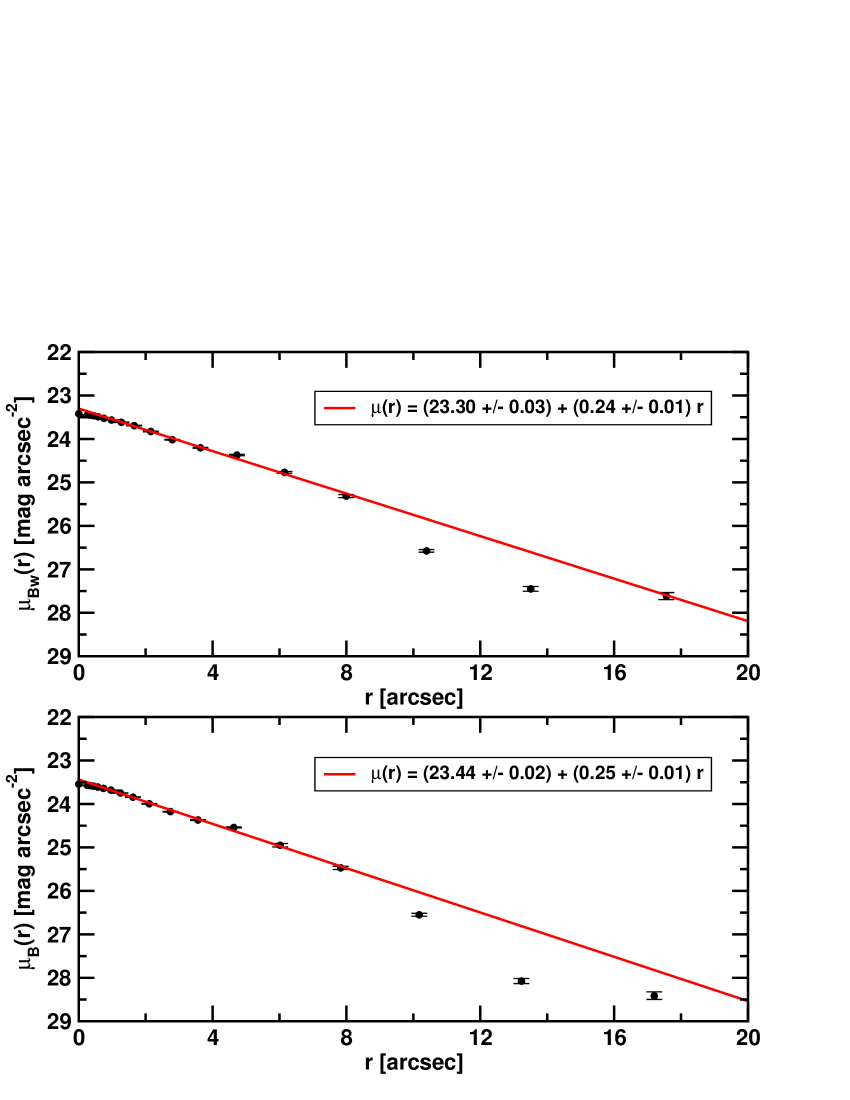
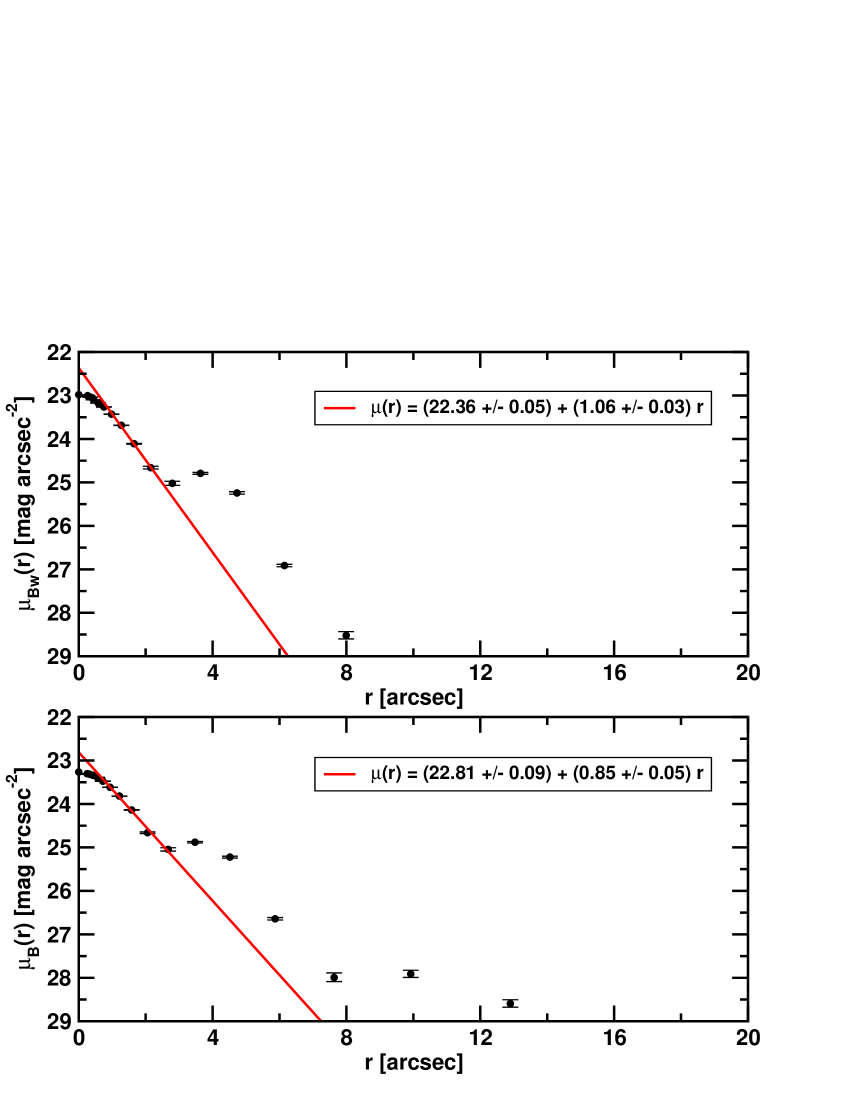
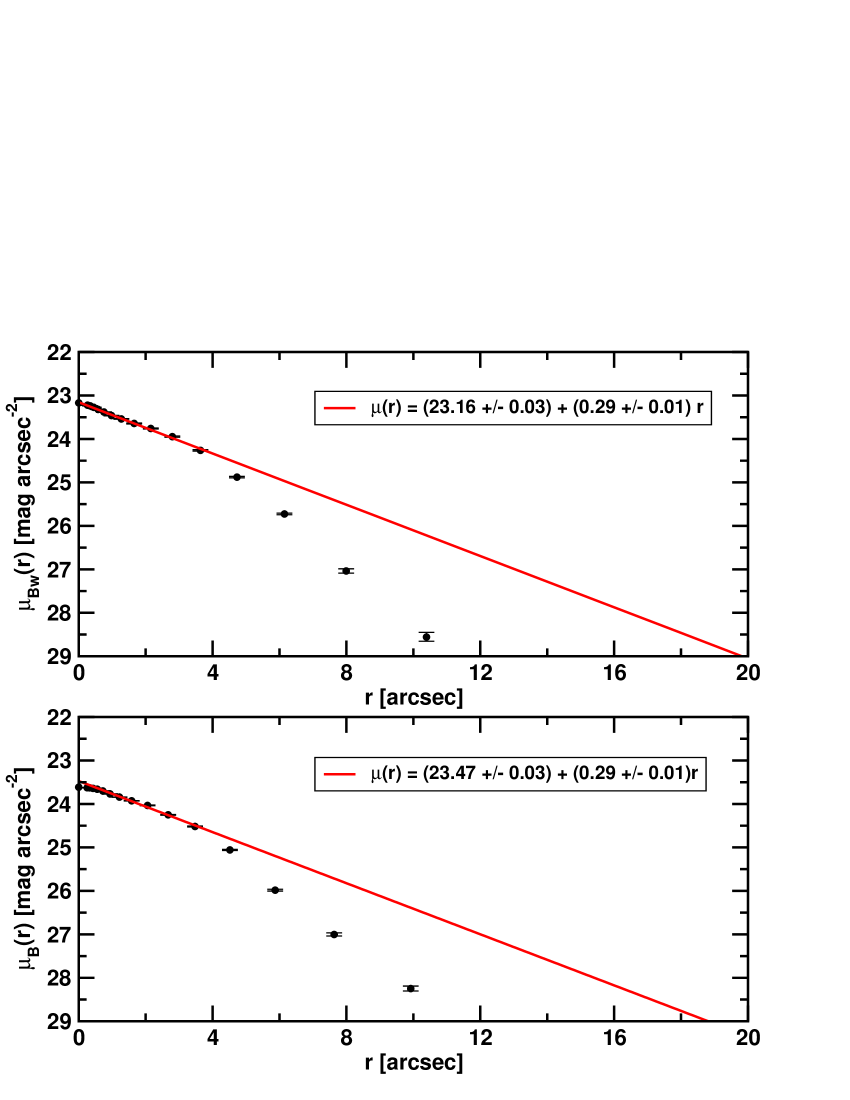
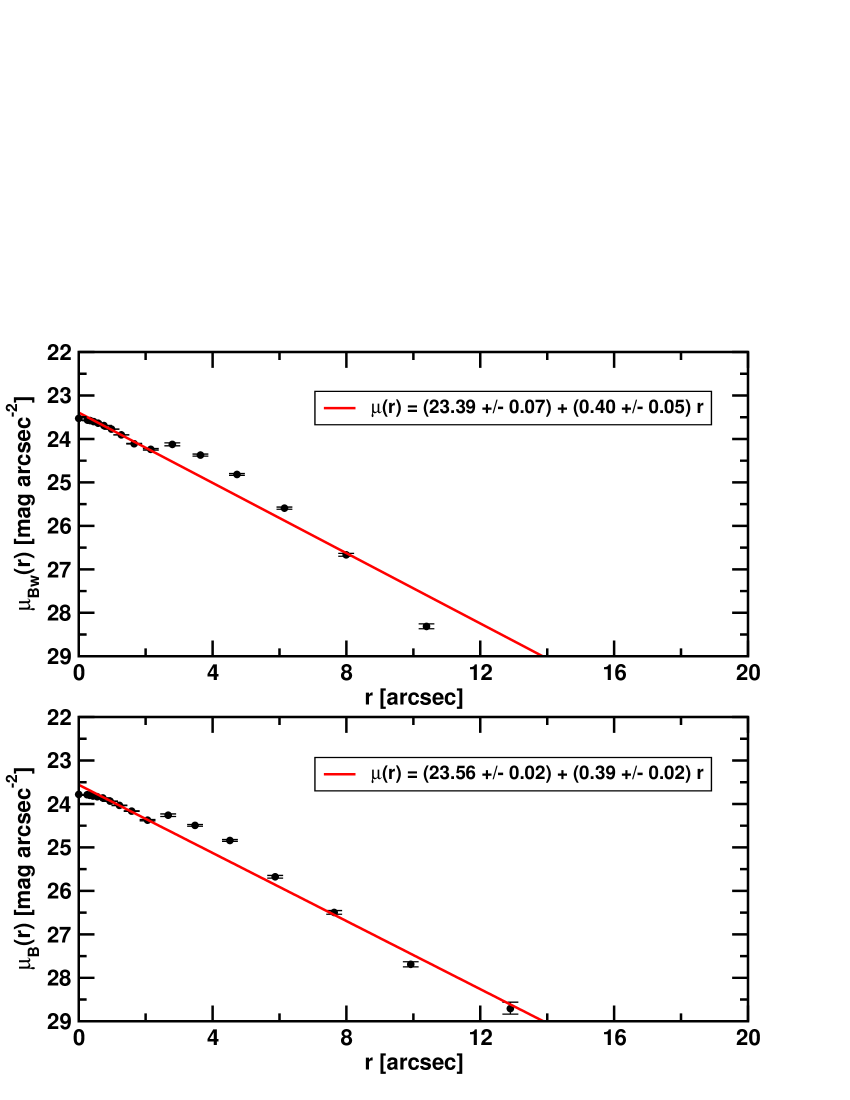
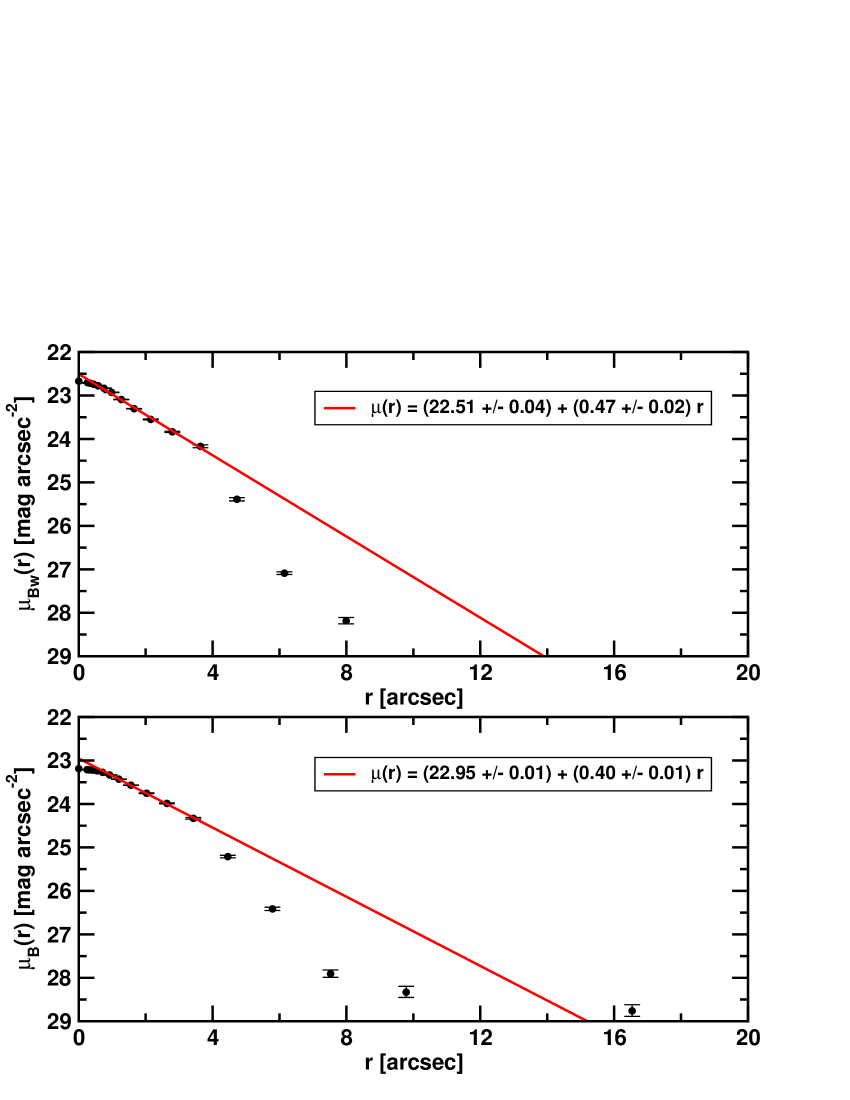
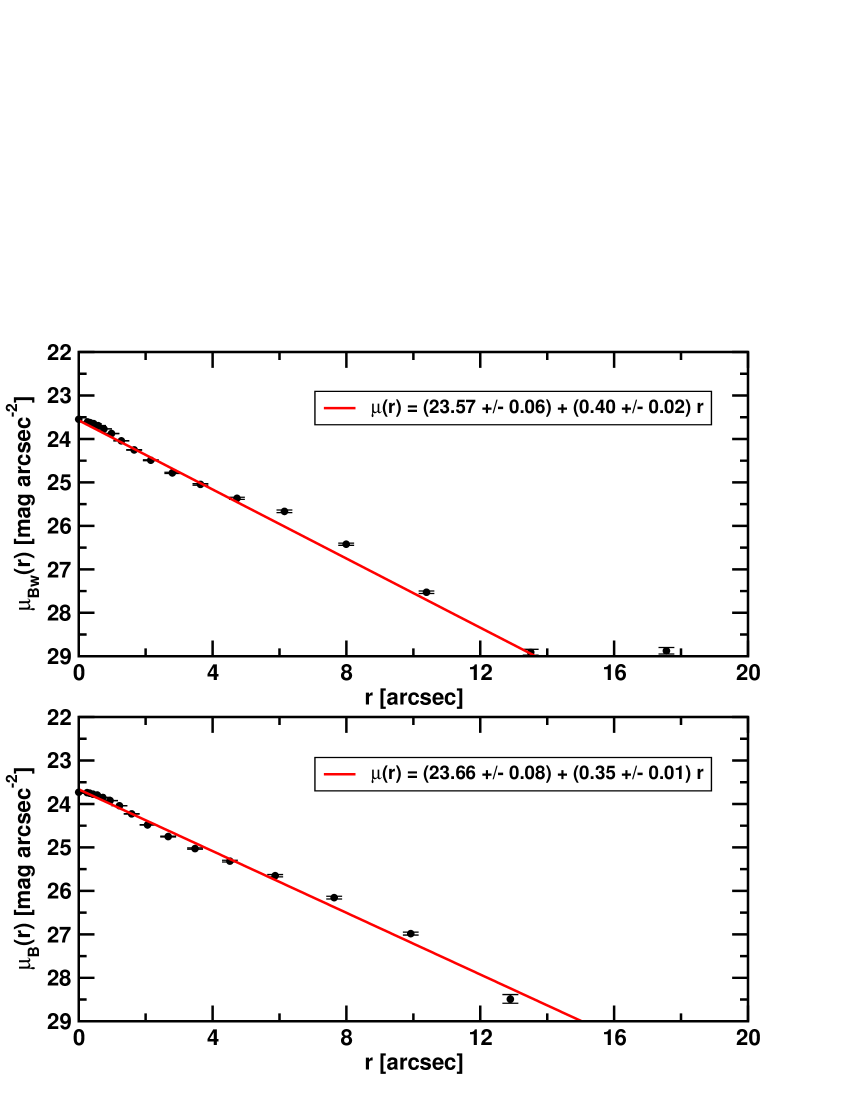
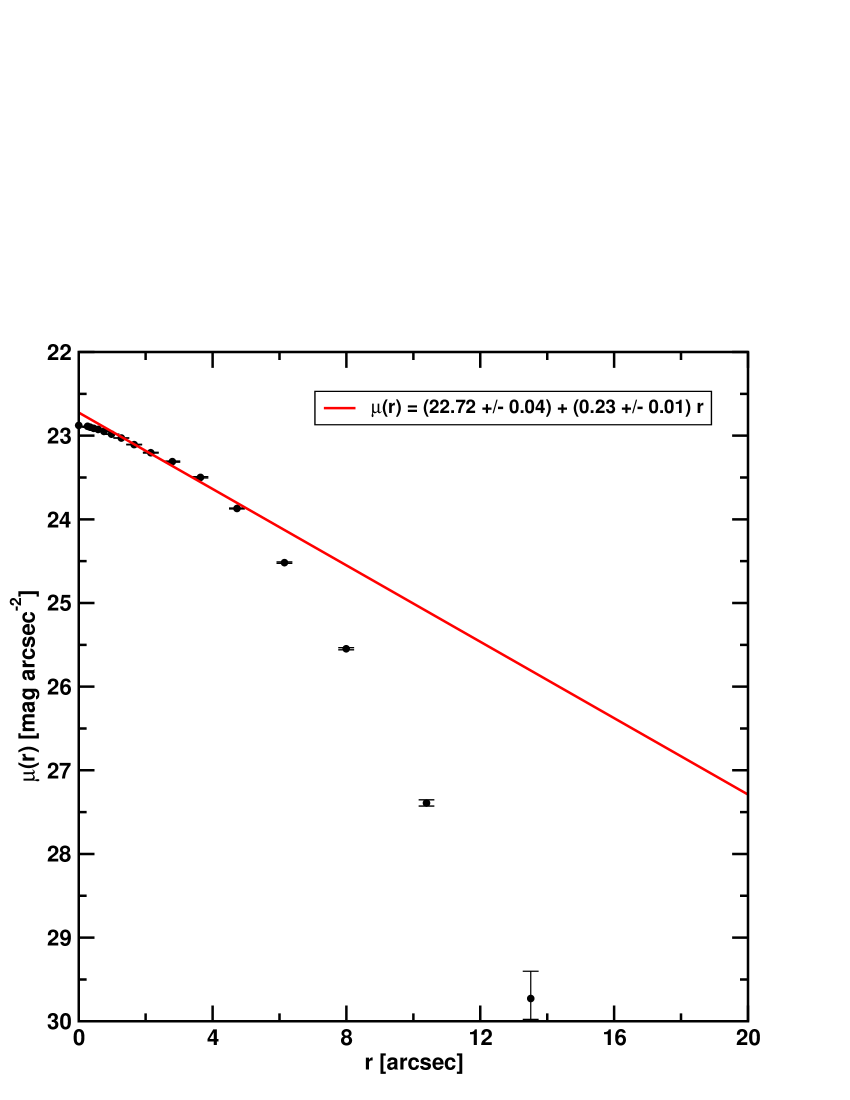
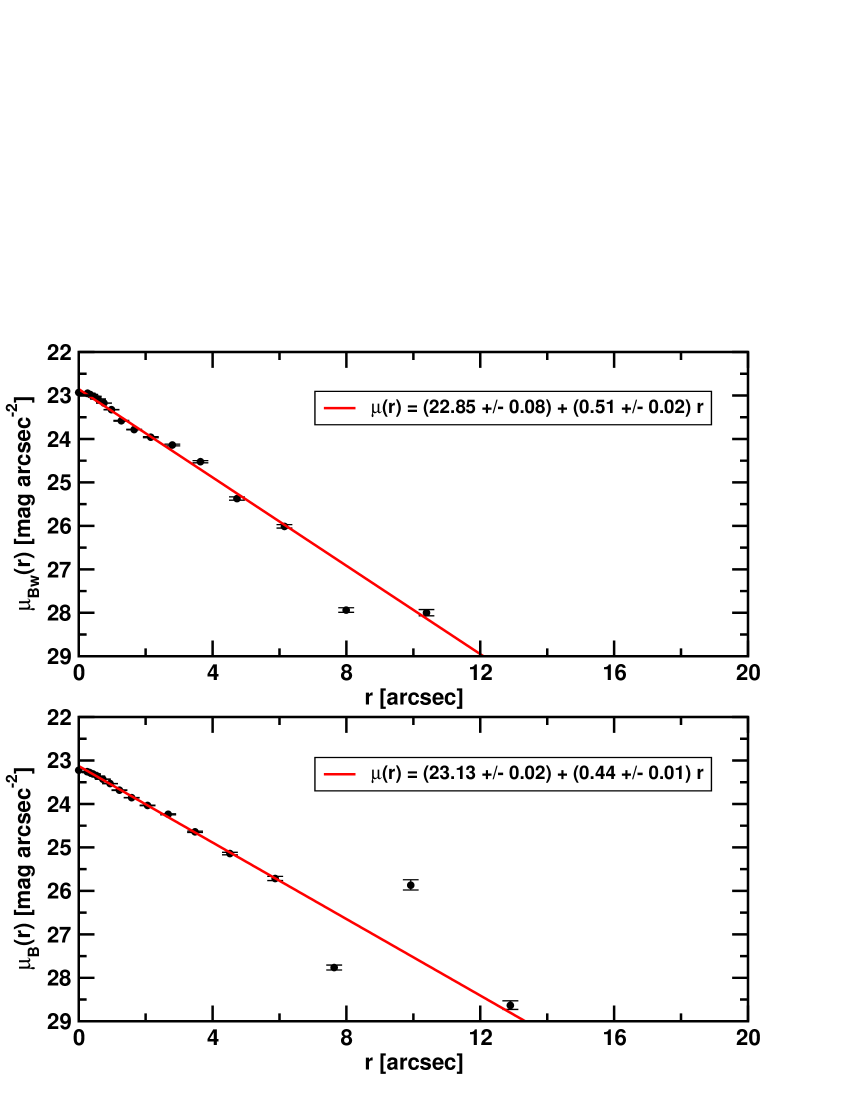
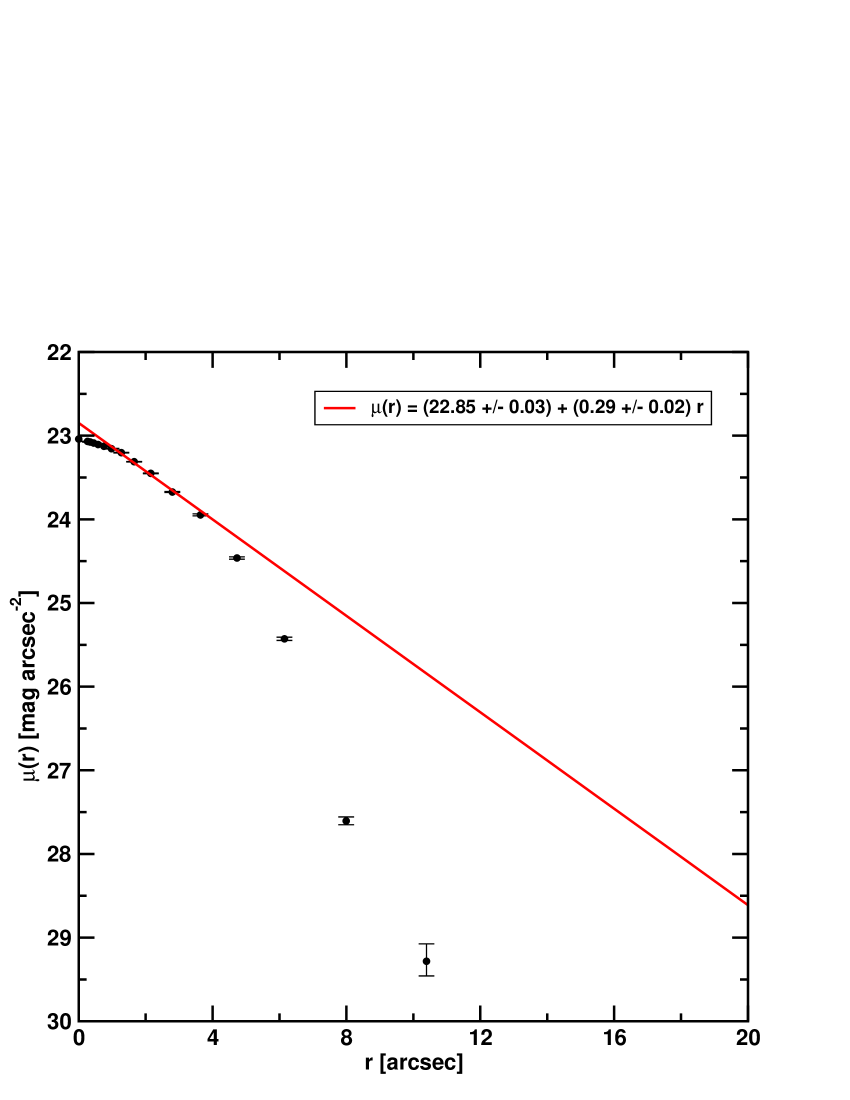
From the ellipse fitting routine we derived the azimuthally averaged radial surface brightness distributions (see Fig. A) and fitted them with a simple exponential law, since none show the presence of a significant de Vaucouleur bulge component (for more details see Sect. 4.3).
| (2) |
For this fit we excluded the innermost 09 of the profile, which are influenced by the seeing of 1.7 arcsec (diameter).
For several candidate galaxies we see a break in the outer parts of the profiles with either an up-bending or down-bending shaped profile (see figures in App. A). This break is visible in both independent datasets (NOAO - and GSFC -band) indicating that this is not an effect of an incorrect skysubtraction. We only fitted the inner exponential part inside the break.
From the exponential fits to the radial surface brightness we obtained the scale-length in the - and -band filter for all galaxies in our sample.
We also derived a simple estimate for the inclination angle, assuming a flat disk, and using the and radii of the outermost successful ellipse fits in the filter.
| (3) |
With this estimation we obtained the inclination corrected blue central surface brightness . We used the same inclination angle for the surface brightness correction in all photometric bands of the GSFC data.
| (4) |
In a next step we extracted the total and magnitudes for all selected objects. In this context we use total magnitudes for a circular aperture with a radius including all the flux, since we have choosen the aperture radius to be significant larger than the optical size of the galaxies. To compare our results with already existing surveys, we need to convert the magnitudes into Johnson magnitudes. For all objects with counterparts in the GSFC data, we used the magnitudes directly measured on this data set. Since we have no -band information for several of the deep NOAO image detections (they are not located in the area covered by the GSFC data), we calculated a mean offset of - = 0.02 0.07 mag, between the - and the -filter and applied this conversion to the measurements of the galaxies only detected in the data. Those estimated values are indicated by square brackets (e.g. Table 3).
For all sample galaxies, present in the GSFC data we measured the total magnitudes in the same way, applying the aperture radius derived in the filter. Results of the and magnitudes together with coordinates, scale-length, and central surface brightnesses are listed in Table 3. This table is organized as followed.
Column 1: Galaxy names as used in this paper.
Column 2-3: Right ascension and declination of the galaxies. We measured the coordinates, using peak intensities of the objects in the NOAO field. The astrometry was performed by the NOAO as part of the data reduction.
Column 4-7: Measured total magnitudes in and . For the galaxies without counterparts in the Goddard field we calculated total magnitudes using the measured mean offset between and (values in square brackets). The errors in Cols. 5 and 7, are standard errors resulting from the photometric measurements within IRAF.
Column 8-11: Central surface brightnesses and standard errors in mag arcsec-2 measured in the (column 6, 7) and the filter (column 8,9). The errors are standard errors, resulting from the linear regression. Linear regressions were progressed using the analyzing software xmgrace. For those galaxies were no detections are available in the -band data, we estimated by applying a mean offset of 0.410.28, derived from galaxies detected in the B-dand of the GSFC data (values in square brackets).
Column 12: Inclination angle in degree, calculated from the ratio of the major and the minor axis, obtained from the ellipse fit (see Eq. 3) in the filter.
Column 13-14: Inclination corrected and band central surface brightness. For the correction we used the simple approach of Eq. 4. For those galaxies without -band information we estimated the inclination corrected central surface brightness using the estimated central surface brightness and the inclination angle derived from the profiles (values in square brackets).
Column 15-18: Disk scale-length in arcsec, obtained from the exponential fit. In the band only galaxies detected in the deep NOAO field with counterparts in the Goddard field are fitted. The errors (column 14,16) are calculated using standard errors resulting from the linear regression and the Gaussian error propagation.
Column 19: The letter in this Col., indicates whether the object is located in both the Goddard and the NOAO field (b), or only identified in the NOAO field (o).
The results for the magnitudes and the colors including errors of the objects detected also in the GSFC data are listed in Table 4.
Column 1: Name as used in Table 3.
Column 2-6: Measured total magnitudes in the filters for the galaxies also detected in the GSFC. The magnitudes were derived performing aperture photometry using the same aperture radius estimated from the data.
Column 7-14: Colors are derived from the total magnitudes. The errors in Cols. 8, 10, 12, 14 result from the Gaussian error propagation using the standard errors of the total magnitudes from the photometric measurements with IRAF.
| Name | RA(J2000) | DEC(J2000) | ||||||||||||||||
|---|---|---|---|---|---|---|---|---|---|---|---|---|---|---|---|---|---|---|
| (1) | (2) | (3) | (4) | (5) | (6) | (7) | (8) | (9) | (10) | (11) | (12) | (13) | (14) | (15) | (16) | (17) | (18) | (19) |
| LSB J22291-60303 | 22:29:18.73 | -60:30:39.0 | 20.31 | 0.16 | [20.29] | [0.17] | 22.95 | 0.08 | [23.36] | [0.29] | 52 | 23.48 | [23.89] | 1.55 | 0.04 | – | – | o |
| LSB J22291-60522 | 22:29:17.15 | -60:52:25.8 | 18.82 | 0.08 | [18.80] | [0.11] | 22.59 | 0.05 | [23.00] | [0.28] | 14 | 22.62 | [23.03] | 2.94 | 0.08 | – | – | o |
| LSB J22292-60540 | 22:29:28.53 | -60:54:09.0 | 19.08 | 0.09 | [19.06] | [0.11] | 22.36 | 0.02 | [22.77] | [0.28] | 52 | 22.89 | [23.30] | 1.87 | 0.03 | – | – | o |
| LSB J22293-60523 | 22:29:35.92 | -60:52:32.0 | 19.04 | 0.09 | [19.02] | [0.11] | 23.38 | 0.09 | [23.79] | [0.29] | 27 | 23.50 | [23.91] | 3.19 | 0.09 | – | – | o |
| LSB J22295-61001 | 22:29:53.87 | -61:00:15.3 | 18.99 | 0.08 | [18.97] | [0.11] | 22.82 | 0.02 | [23.23] | [0.28] | 69 | 23.93 | [24.43] | 6.03 | 0.34 | – | – | o |
| LSB J22300-60300 | 22:30:09.75 | -60:30:06.6 | 19.09 | 0.09 | [19.07] | [0.11] | 22.94 | 0.05 | [23.35] | [0.28] | 48 | 23.38 | [23.79] | 3.74 | 0.12 | – | – | o |
| LSB J22300-60380 | 22:30:03.37 | -60:38:07.3 | 18.94 | 0.09 | [18.92] | [0.11] | 22.92 | 0.01 | [23.33] | [0.28] | 18 | 22.97 | [23.38] | 3.53 | 0.03 | – | – | o |
| LSB J22301-60415 | 22:30:17.59 | -60:41:50.9 | 19.76 | 0.13 | [19.74] | [0.15] | 22.47 | 0.07 | [22.88] | [0.29] | 53 | 23.02 | [23.43] | 1.81 | 0.03 | – | – | o |
| LSB J22302-60352 | 22:30:22.97 | -60:35:29.4 | 18.24 | 0.06 | [18.22] | [0.09] | 22.67 | 0.08 | [23.08] | [0.29] | 25 | 22.78 | [23.19] | 4.34 | 0.35 | – | – | o |
| LSB J22302-60474 | 22:30:23.08 | -60:47:48.9 | 19.94 | 0.14 | [19.92] | [0.16] | 23.23 | 0.03 | [23.64] | [0.28] | 60 | 23.98 | [24.39] | 3.19 | 0.09 | – | – | o |
| LSB J22303-60514 | 22:30:30.40 | -60:51:48.9 | 20.08 | 0.15 | [20.06] | [0.17] | 22.47 | 0.05 | [22.88] | [0.28] | 55 | 23.07 | [23.48] | 2.01 | 0.11 | – | – | o |
| LSB J22304-61004 | 22:30:42.63 | -61:00:41.8 | 18.67 | 0.08 | [18.65] | [0.11] | 22.57 | 0.06 | [22.98] | [0.29] | 52 | 23.10 | [23.51] | 3.62 | 0.12 | – | – | o |
| LSB J22311-60160 | 22:31:14.40 | -60:16:08.0 | 23.80 | 0.81 | [23.78] | [0.81] | 26.52 | 0.29 | [26.93] | [0.40] | 39 | 26.79 | [27.20] | 2.72 | 0.54 | – | – | o |
| LSB J22311-60503 | 22:31:13.04 | -60:50:34.4 | 18.51 | 0.07 | 18.50 | 0.02 | 22.39 | 0.03 | 22.55 | 0.04 | 25 | 22.50 | 22.66 | 2.53 | 0.06 | 2.53 | 0.06 | b |
| LSB J22315-60481 | 22:31:59.35 | -60:48:17.3 | 20.60 | 0.17 | 20.61 | 0.06 | 23.50 | 0.04 | 23.51 | 0.06 | 64 | 24.40 | 24.41 | 2.09 | 0.04 | 2.01 | 0.07 | b |
| LSB J22320-60381 | 22:32:02.65 | -60:38:14.0 | 22.24 | 0.39 | 22.10 | 0.05 | 26.86 | 0.05 | 26.91 | 0.03 | 36 | 27.09 | 27.14 | 4.18 | 0.16 | 6.46 | 0.15 | b |
| LSB J22321-61015 | 22:32:17.78 | -61:01:56.0 | 20.13 | 0.15 | [20.11] | [0.17] | 23.30 | 0.03 | [23.71] | [0.28] | 65 | 24.24 | [24.65] | 4.34 | 0.35 | – | – | o |
| LSB J22322-60142 | 22:32:27.40 | -60:14:25.6 | 20.24 | 0.14 | 20.31 | 0.04 | 22.82 | 0.05 | 23.09 | 0.02 | 49 | 23.28 | 23.55 | 0.94 | 0.03 | 1.10 | 0.02 | b |
| LSB J22324-60520 | 22:32:41.81 | -60:52:07.1 | 19.62 | 0.12 | 19.60 | 0.04 | 22.25 | 0.05 | 22.30 | 0.10 | 50 | 22.73 | 22.78 | 1.57 | 0.05 | 1.60 | 0.07 | b |
| LSB J22325-60155 | 22:32:52.19 | -60:15:58.4 | 18.98 | 0.09 | 19.00 | 0.03 | 23.26 | 0.16 | 23.82 | 0.04 | 46 | 23.66 | 24.25 | 4.18 | 0.48 | 9.05 | 1.51 | b |
| LSB J22325-60211 | 22:32:55.39 | -60:21:17.1 | 20.14 | 0.15 | 20.10 | 0.05 | 23.18 | 0.01 | 23.25 | 0.05 | 50 | 23.66 | 23.73 | 3.19 | 0.09 | 2.31 | 0.20 | b |
| LSB J22330-60543 | 22:33:03.19 | -60:54:38.4 | 18.71 | 0.08 | 18.70 | 0.02 | 22.24 | 0.05 | 22.40 | 0.05 | 25 | 22.46 | 22.62 | 2.13 | 0.04 | 2.05 | 0.08 | b |
| LSB J22331-60340 | 22:33:13.73 | -60:34:04.7 | 21.01 | 0.22 | 21.13 | 0.07 | 24.41 | 0.08 | 24.49 | 0.06 | 26 | 24.64 | 24.72 | 2.13 | 0.08 | 2.05 | 0.04 | b |
| LSB J22332-60561 | 22:33:26.60 | -60:56:16.6 | 19.49 | 0.11 | [19.51] | [0.13] | 22.71 | 0.02 | [23.12] | [0.28] | 65 | 23.65 | [24.06] | 2.72 | 0.07 | – | – | o |
| LSB J22341-60475 | 22:34:14.64 | -60:47:53.3 | 19.59 | 0.12 | 19.57 | 0.04 | 22.51 | 0.04 | 22.58 | 0.01 | 58 | 23.20 | 23.27 | 2.86 | 0.15 | 2.86 | 0.08 | b |
| LSB J22342-60505 | 22:34:20.23 | -60:50:51.2 | 19.70 | 0.10 | 19.73 | 0.03 | 23.36 | 0.01 | 23.39 | 0.02 | 65 | 24.30 | 24.33 | 3.03 | 0.03 | 2.72 | 0.07 | b |
| LSB J22343-60222 | 22:34:32.28 | -60:22:20.5 | 19.18 | 0.09 | 19.10 | 0.03 | 23.30 | 0.03 | 23.44 | 0.02 | 59 | 24.02 | 24.16 | 4.53 | 0.19 | 4.34 | 0.17 | b |
| LSB J22345-60210 | 22:34:57.78 | -60:21:07.8 | 20.22 | 0.15 | 20.15 | 0.05 | 22.36 | 0.05 | 22.81 | 0.09 | 38 | 22.62 | 23.07 | 1.02 | 0.03 | 1.28 | 0.08 | b |
| LSB J22352-60420 | 22:35:22.50 | -60:42:09.0 | 20.19 | 0.15 | 20.22 | 0.05 | 23.16 | 0.03 | 23.47 | 0.03 | 59 | 23.88 | 24.19 | 3.74 | 0.13 | 3.74 | 0.13 | b |
| LSB J22353-60311 | 22:35:34.37 | -60:31:11.6 | 19.36 | 0.10 | 19.18 | 0.03 | 23.39 | 0.07 | 23.56 | 0.02 | 22 | 23.47 | 23.64 | 2.72 | 0.34 | 2.78 | 0.14 | b |
| LSB J22354-60122 | 22:35:46.14 | -60:12:20.4 | 19.82 | 0.13 | 19.77 | 0.04 | 22.51 | 0.04 | 22.95 | 0.01 | 50 | 22.99 | 23.43 | 2.31 | 0.10 | 2.72 | 0.07 | b |
| LSB J22355-60183 | 22:35:58.34 | -60:18:39.9 | 19.83 | 0.13 | 19.75 | 0.04 | 22.52 | 0.04 | 22.78 | 0.04 | 50 | 23.00 | 23.26 | 2.26 | 0.14 | 2.26 | 0.14 | b |
| LSB J22355-60390 | 22:35:54.99 | -60:39:01.6 | 20.39 | 0.16 | 20.28 | 0.05 | 23.57 | 0.06 | 23.66 | 0.08 | 68 | 24.64 | 24.73 | 2.72 | 0.14 | 3.10 | 0.09 | b |
| LSB J22360-60561 | 22:36:00.81 | -60:56:17.4 | 19.34 | 0.10 | [19.32] | [0.12] | 22.72 | 0.04 | [23.13] | [0.28] | 67 | 23.74 | [24.15] | 4.72 | 0.21 | – | – | o |
| LSB J22361-60223 | 22:36:17.20 | -60:22:31.7 | 19.82 | 0.13 | 19.86 | 0.04 | 22.85 | 0.08 | 23.13 | 0.01 | 49 | 23.31 | 23.59 | 2.13 | 0.08 | 2.47 | 0.06 | b |
| LSB J22361-60562 | 22:36:17.87 | -60:56:27.2 | 19.86 | 0.13 | [19.84] | [0.15] | 22.85 | 0.03 | [23.26] | [0.28] | 61 | 23.64 | [24.05] | 3.74 | 0.26 | – | – | o |
| LSB J22364-60405 | 22:36:45.09 | -60:40:50.6 | 22.74 | – | [22.72] | – | 25.41 | 0.28 | [25.82] | [0.40] | – | – | – | 2.22 | 0.59 | – | – | o |
3.3 How many LSB candidates are HSB disks at higher redshift?
Since the surface brightness of an object is only independent of distance in the nearby Universe, it is not trivial to decide whether our candidates are genuine LSB galaxies or dimmed “normal” HSB galaxies at high redshift. At larger distances (z 0.1) the surface brightness increases significantly with the redshift z (e.g. Peacock, 1999)
| (5) |
where represents the measured and the surface brightness corrected for cosmological dimming. For example the surface brightness for a galaxy will be reduced by 1.8 mag arcsec-2 at a distance of z = 0.5. So, without any distance information it is not obvious, if a galaxy with = 23 mag arcsec-2 is a genuine low surface brightness galaxy or a cosmological dimmed normal galaxy. Since LSB galaxies are present for all Hubble types (Schombert et al., 1992), a pure morphological selection can be misleading.
Subtracting the population of higher redshifted galaxies (z 0.15, see below) should provide us a reasonably clean sample of genuine LSB galaxy candidates. Since spectroscopic redshifts for our LSB galaxy candidates are not available yet, we need a method to select the LSB galaxy candidates against the background of higher redshifted galaxies. The relatively large diameter limit, used for the selection of the galaxies, was a first step to keep this contamination low. A natural choice for further selection is the use of photometric redshifts (Koo, 1985; Loh & Spillar, 1986). This method is based on the change of galaxy colors due to the shift of spectral features (e.g. Balmer break, Lyman break) into redder filter bands with increasing redshift. A typical spectral energy distribution of a galaxy (e.g., Sb), therefore, moves along a specific track in a color-color diagram (Liu & Green, 1998). The location and shape of these tracks depends on the knowledge of the spectral energy distribution (and, therefore, the stellar population mix) of the galaxy. Since we have only very limited knowledge about the star formation history of LSB galaxies and, therefore, their spectral energy distributions we cannot use standard photometric redshift methods to select our LSB galaxies directly. However, we know from deep pencil beam redshift surveys (e.g. Lilly et al., 1995), that the dominant contamination to our sample is caused by “normal” HSB disk galaxies at intermediate redshifts (z=0.1 to 0.5). Galaxies with distances z 0.5 have much smaller angular sizes than our diameter limit (Giavalisco et al., 1996). For normal galaxies with redshifts in the range between z=0.15 to 1, the photometric redshift method works well. For example Yahata et al. (2000) obtained photometric redshifts with an accuracy around z 0.09 for redshifts z 1.0. Fernández-Soto et al. (2002) derived an error component for the photometric redshifts following = 0.065 (1 + ) and resulting in an accuracy of z 0.10 for redshifts z 0.5. Due to this relatively large errors it is not possible to derive photometric redshifts for lower redshifted (z 0.15) galaxies. At this point it is important to mention that we do not aim at obtaining photometric redshifts for local galaxies (z 0.15) in the following paragraphs. Due to the large uncertainties of the photometric redshifts this is not feasible. However, as we are inevitably influenced by dimmed high redshift HSB galaxies, the application of the photometric redshift method allows us to extract a reduced sample of most probable intrinsically LSB galaxies for which it is useful to derive spectroscopic redshifts.
| Name | |||||||||||||
|---|---|---|---|---|---|---|---|---|---|---|---|---|---|
| (1) | (2) | (3) | (4) | (5) | (6) | (7) | (8) | (9) | (10) | (11) | (12) | (13) | (14) |
| LSB J22311-60503 | 18.45 | 18.50 | 17.75 | 17.29 | 16.76 | -0.05 | 0.07 | 0.75 | 0.02 | 0.99 | 0.02 | 1.21 | 0.32 |
| LSB J22315-60481 | 20.40 | 20.61 | 19.46 | 18.75 | 18.16 | -0.21 | 0.46 | 1.15 | 0.16 | 1.30 | 0.13 | 1.86 | 0.15 |
| LSB J22322-60142 | 20.76 | 20.31 | 18.83 | 17.80 | 17.26 | 0.46 | 0.59 | 1.48 | 0.21 | 1.57 | 0.12 | 2.51 | 0.19 |
| LSB J22324-60520 | 20.06 | 19.60 | 18.32 | 17.61 | 17.05 | 0.46 | 0.16 | 1.28 | 0.04 | 1.27 | 0.02 | 1.99 | 0.04 |
| LSB J22325-60155 | 19.02 | 19.00 | 18.56 | 18.34 | 17.92 | 0.02 | 0.10 | 0.44 | 0.04 | 0.64 | 0.03 | 0.66 | 0.04 |
| LSB J22325-60211 | 19.96 | 20.10 | 19.14 | 18.60 | 18.09 | -0.14 | 0.16 | 0.95 | 0.06 | 1.05 | 0.04 | 1.50 | 0.05 |
| LSB J22330-60543 | 18.94 | 18.70 | 18.34 | 18.15 | 17.75 | 0.24 | 0.09 | 0.36 | 0.03 | 0.59 | 0.04 | 0.55 | 0.03 |
| LSB J22331-60340 | 21.38 | 21.13 | 19.80 | 18.66 | 18.12 | 0.25 | 0.27 | 1.33 | 0.08 | 1.68 | 0.05 | 2.47 | 0.07 |
| LSB J22341-60475 | 19.51 | 19.57 | 18.51 | 17.90 | 17.31 | -0.06 | 0.13 | 1.05 | 0.04 | 1.20 | 0.02 | 1.67 | 0.04 |
| LSB J22342-60505 | 19.57 | 19.73 | 18.83 | 18.27 | 17.33 | -0.16 | 0.24 | 0.90 | 0.09 | 1.50 | 0.10 | 1.46 | 0.11 |
| LSB J22343-60222 | 19.34 | 19.10 | 18.68 | 18.46 | 17.93 | 0.24 | 0.22 | 0.42 | 0.07 | 0.75 | 0.06 | 0.64 | 0.13 |
| LSB J22345-60210 | 20.27 | 20.15 | 19.08 | 18.47 | 17.92 | 0.12 | 0.18 | 1.07 | 0.06 | 1.16 | 0.04 | 1.68 | 0.05 |
| LSB J22352-60420 | 20.32 | 20.22 | 19.51 | 19.14 | 18.68 | 0.10 | 0.18 | 0.71 | 0.06 | 0.82 | 0.04 | 1.08 | 0.05 |
| LSB J22353-60311 | 19.87 | 19.18 | 18.83 | 18.15 | 18.05 | 0.69 | 0.14 | 0.35 | 0.04 | 0.77 | 0.03 | 0.78 | 0.04 |
| LSB J22354-60122 | 19.75 | 19.77 | 19.26 | 18.99 | 18.53 | -0.02 | 0.13 | 0.51 | 0.05 | 0.73 | 0.04 | 0.78 | 0.04 |
| LSB J22355-60183 | 19.98 | 19.75 | 19.24 | 18.96 | 18.54 | 0.23 | 0.16 | 0.51 | 0.06 | 0.70 | 0.04 | 0.79 | 0.04 |
| LSB J22355-60390 | 20.35 | 20.28 | 18.93 | 18.15 | 17.57 | 0.07 | 0.19 | 1.35 | 0.05 | 1.36 | 0.03 | 2.13 | 0.05 |
| LSB J22361-60223 | 19.94 | 19.86 | 18.62 | 17.96 | 17.39 | 0.08 | 0.15 | 1.24 | 0.04 | 1.23 | 0.02 | 1.90 | 0.04 |
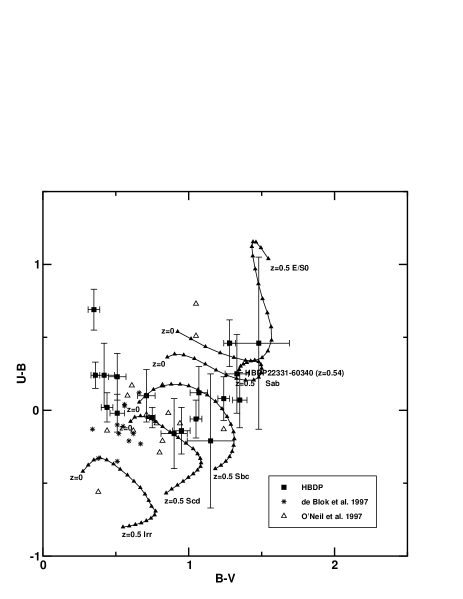
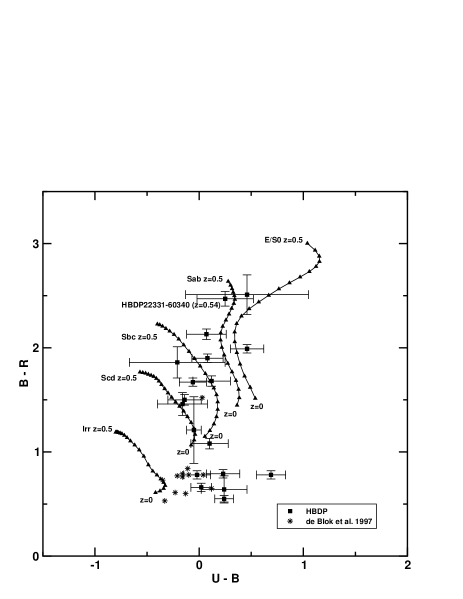
In order to derive photometric redshifts for the higher redshifted galaxies within our sample, we used a multi-color system of Liu & Green (1998). From this work we got the colors of five representative template galaxy Spectral Energy Distributions (SEDs) and a system of six optical and near IR broadband filters, including standard , , , , as used with the GSFC multi-color data. Four of the template SED’s cover the basic range of galaxy types E/S0, Sbc, Scd and Irr (starburst) and resulted from the catalogs of integrated spectrometry of Kennicutt (1992) and Coleman et al. (1980). A fifth SED is a composite spectrum of a Sa and Sab galaxy from Kinney et al. (1996). For these five galaxy types colors were calculated using k-correction and covering a redshift range from z = 0 to z = 1.0 with a resolution of = 0.025. The calculation of the colors were done, assuming no intrinsic evolution of the galaxies.
We used the colors of Liu & Green (1998) in our two color-color diagrams, vs. and vs. for further comparisons (Fig. 1). The derived tracks for each galaxy template were limited to redshifts between = 0 and = 0.5.
Due to the smaller field size of the Goddard data, we only have multi-color information available for 18 of the 37 detected sample galaxies. Therefore, the further analysis is restricted to this much smaller subsample.
The comparison in the color-color diagrams result in a subsample of 9 galaxies with colors equivalent to photometric redshifts z 0.15, which we therefore excluded from our final sample. For these galaxies the positions in the color-color diagram can be used as distance indicators since the accuracy of the photometric redshift determination is small enough to allow a rough estimation redshift (discussion above). For one of the higher redshifted galaxies, LSB J22331-60340, a spectroscopic redshift of 0.543 is available (Glazebrook, K. et al., 2006).
The remaining sample, used for further analysis, consists of 9 genuine, local LSB galaxy candidates. The color-color comparison shows that 7 (marked in Table 5) of them have colors that are significantly different from colors of HSB galaxies with similar Hubble types (see Fig. 1). Hence, they cannot be redshifted galaxies. To test our assumption we added LSB galaxies with good CCD multi-color photometry from de Blok (1997) and O’Neil et al. (1997a) to the diagrams of Fig. 1. These spectroscopically confirmed LSB galaxies are also located in color space outside of the area defined by the redshifted HSB galaxies, showing consistency in color with our LSB galaxies candidates.
Two galaxies of our final selected LSB candidate sample (LSB J22311-60503, LSB J22324-60520) have a location in the color-color diagrams consistent with those of HSBs with redshifts z 0.15. Although their photometric redshift estimation has a large distance uncertainty (0.08), their central surface brightnesses assuming z = 0.15 is still below our LSB threshold of 22.0 mag arcsec-2.
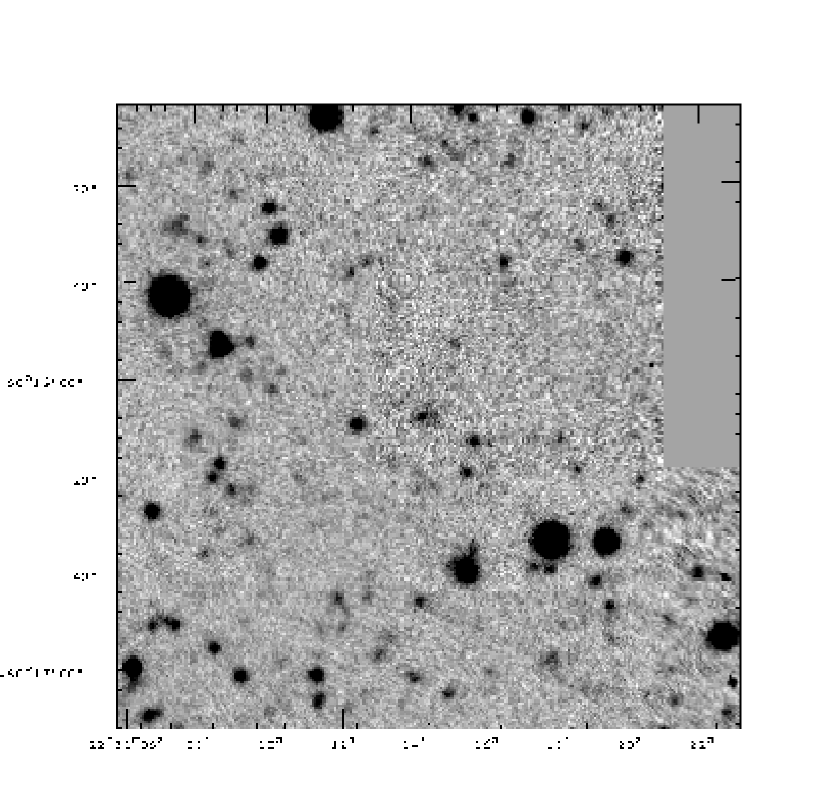
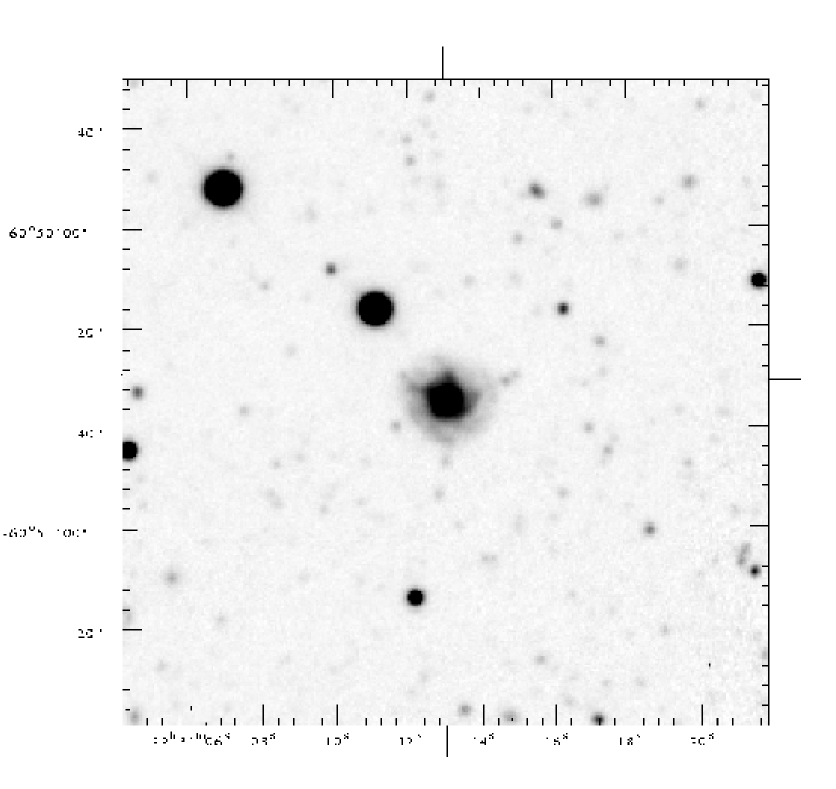
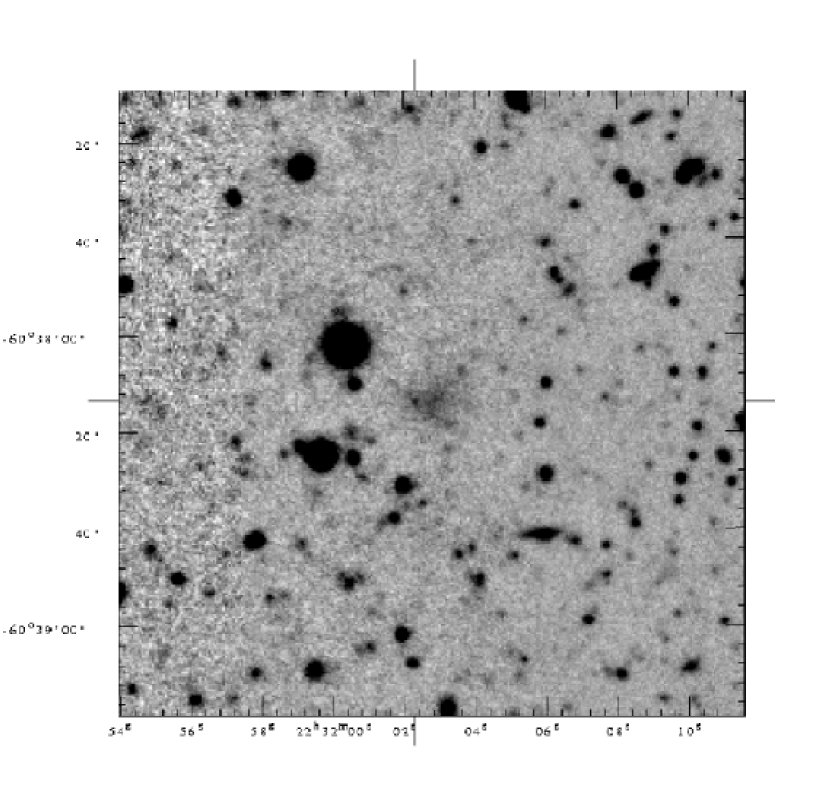
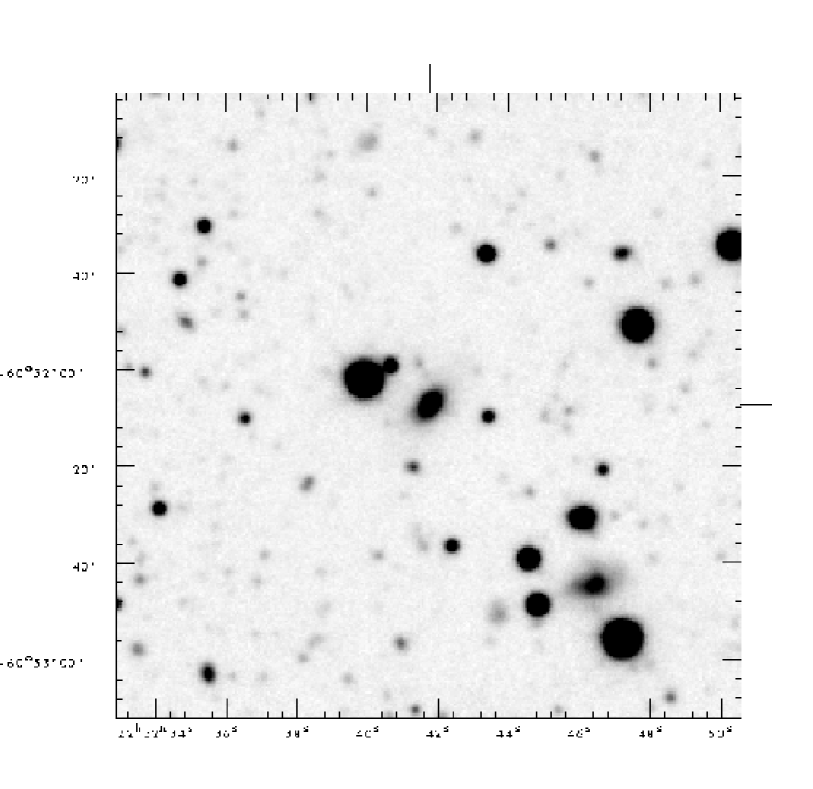
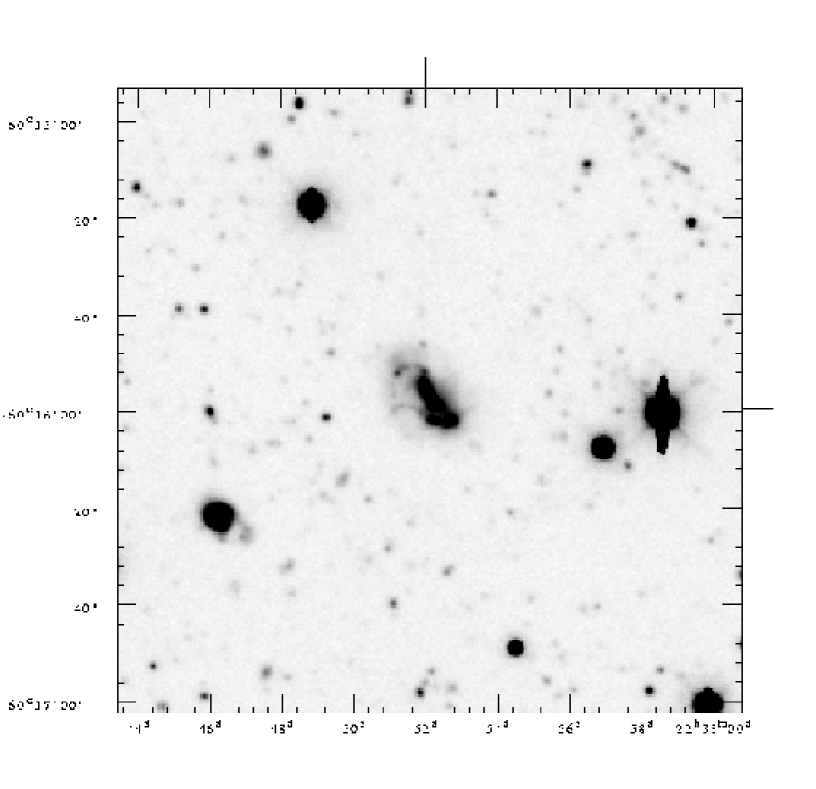
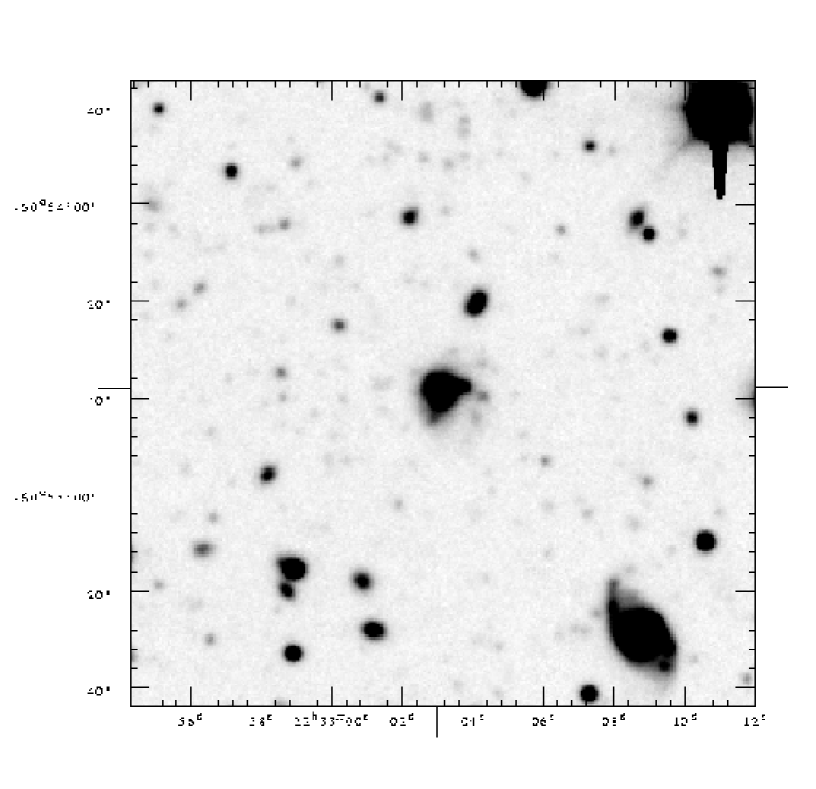
To summarize, with our selection criteria we are able to select a sample of 9 highly probable LSB galaxy candidates out of a sample of 18 candidate galaxies (50 %) having multi-colour information available. Apparently, our original size selection criterion of 10.8 arcsec (25 pixels) works reasonably well in suppressing the redshifted galaxy population. Additionally, we find three extreme low surface brightness candidates ( 25.0 mag arcsec-2) for which the GSFC multi-color data set is not available (LSB J22311-60160, LSB J22320-60381, LSB J22364-60405). Due to the large diameter selection limit used for our sample, the distances of these galaxies are not likely to exceed the 0.5 redshift limit. Correcting their surface brightness assuming they are at z = 0.5 leads to a 1.8 mag arcsec-2 higher surface brightness. Therefore, these galaxies can still be classified as LSB galaxies (e.g., LSB J22320-60381 with = 26.91 mag arcsec-2 could be even at a redshift of z 1.8) and we decided to include these galaxies in our final LSB candidate sample. This leaves us with a final sample of 12 possible LSB galaxy candidates (see Table 5), of which we present the images in Fig. 2. Table 5 is organized in the following way:
Column 1: Galaxy names as used in Table 3.
Column 2&4: Central surface brightnesses as shown in Tabel 3.
Column 3&5: Inclination corrected central surface brightness and derived following Eqn. 4.
Column 6: The letters indicates if the galaxy has an offset in one (co) or both (cob) color-color diagrams or not (n). Galaxies without entry in this column were not detected in all filter bands of the GSFC data.
| Name | |||||
|---|---|---|---|---|---|
| LSB J22311-60160 | 26.52 | 26.79 | [26.93] | [27.20] | – |
| LSB J22311-60503 | 22.39 | 22.50 | 22.55 | 22.66 | n |
| LSB J22320-60381 | 26.86 | 27.09 | 26.91 | 27.14 | – |
| LSB J22324-60520 | 22.25 | 22.73 | 22.30 | 22.78 | n |
| LSB J22325-60155 | 23.26 | 23.66 | 23.82 | 24.25 | cob |
| LSB J22330-60543 | 22.24 | 22.46 | 22.40 | 22.62 | cob |
| LSB J22343-60222 | 23.30 | 24.03 | 23.44 | 24.16 | cob |
| LSB J22352-60420 | 23.16 | 23.88 | 23.47 | 24.19 | co |
| LSB J22353-60311 | 23.39 | 23.47 | 23.56 | 23.64 | cob |
| LSB J22354-60122 | 22.51 | 22.99 | 22.95 | 23.43 | cob |
| LSB J22355-60183 | 22.52 | 23.00 | 22.78 | 23.26 | cob |
| LSB J22364-60405 | 25.41 | – | [25.82] | – | – |
![[Uncaptioned image]](/html/astro-ph/0701797/assets/x9.png)
![[Uncaptioned image]](/html/astro-ph/0701797/assets/x10.png)
![[Uncaptioned image]](/html/astro-ph/0701797/assets/x11.png)
![[Uncaptioned image]](/html/astro-ph/0701797/assets/x12.png)
![[Uncaptioned image]](/html/astro-ph/0701797/assets/x13.png)
![[Uncaptioned image]](/html/astro-ph/0701797/assets/x14.png)
Fig. 2 continued: From left to right and from top to bottom LSB J22343-60222, LSB J22352-60420, LSB J22353-60311, LSB J22354-60122, LSB J22355-60183, and LSB J22364-60405.
In the following paragraph we give a few notes on the 12 most probable
LSB galaxies:
LSB J22311-60160: Very faint object ( = 26.3 mag arcsec-2) found only in the deep image in a region with a lower signal to noise level and it could not be fitted very well by an exponential profile.
LSB J22311-60503: Disk galaxy showing a bright central region and a very faint disk with some spiral structure.
LSB J22320-60381: Faintest LSB candidate in our sample with central surface brightness of = 26.9 mag arcsec-2. Only found in the deep image. The light profile is very well fitted by an exponential profile.
LSB J22324-60520: Disk galaxy with a very bright core, a central surface brightness at our upper limit ( = 22.2 mag arcsec-2), and very faint and diffuse structure in the outer region. Maybe highly inclined.
LSB J22325-60155: Looks like a star forming irregular galaxy, showing diffuse disk-like structure in the outer region.
LSB J22330-60543: Disk galaxy with bright core and diffuse spiral structure.
LSB J22343-60222: Highly inclined galaxy with bright inner part and faint diffuse disk like structure. The radial profile shows a steep decline in the outer regions.
LSB J22352-60420: Highly inclined galaxy showing diffuse disk like structure. The radial profile shows a steep drop in the outer region.
LSB J22353-60311: Appears to be a star forming galaxy with a disk like structure .
LSB J22354-60122: Star forming irregular galaxy. The radial profile shows a steep decline in the outer region.
LSB J22355-60183: Galaxy showing a bright core and some hints for spiral structures. The radial profile has a steep decline in the outer region.
LSB J22364-60405: Very faint LSB galaxy candidate ( = 25.82 mag arcsec-2) found only in the deep image in a region with variable signal to noise level.
4 Results and Discussion
4.1 Selection effects and parameter space
One important aspect that still has to be discussed in more detail are the selection biases that affect our final LSB candidate sample. For our search we only used a diameter and surface brightness but no magnitude limit. We selected all galaxies having diameters larger than 10.8 arcsec and central surface brightness fainter than 22.0 mag arcsec-2. Our object detection limit in surface brightness is about 27 mag arcsec-2 and the limiting surface brightness of the data is about 29 mag arcsec-2. The object selection was done using the data of the NOAO Deep Wide-Field survey, being the most sensitive data at our disposal. We just selected galaxies having diameters larger than 10.8 arcsec (measured by eye on the images), in order to reduce the contamination due to higher redshifted and, therefore, cosmologically dimmed HSB galaxies. Estimating the diameter by eye can lead to an incompletness of galaxies near the diameter limit. Therefore, it is possible that our sample is not representative for the real number of objects close to the diameter limit of our survey. With the surface brightness selection criteria ( 22.0 mag arcsec-2) we just restrict our sample against the high surface brightness objects found in the data. Choosing an upper surface brightness limit of = 22.0 mag arcsec-2 gives us a sufficient overlap to the region of the higher surface brightness galaxies, so that we will not lose objects close to the LSB galaxy surface brightness limit.
A second selection bias concerning the size selection results from the median filter method. For the filtering process we used a kernel with a size of 25 pixel which represents our diameter selection limit. However, this kernel size biases our sample against objects with much larger or smaller sizes. We used the median filter method in order to search for extreme LSB candidates ( 24.5 mag arcsec-2). Therefore, our sample is biased against large objects at the very low surface brightness end.
With regard to the described search criteria we found LSB galaxies having small diameters between 12″ d 36″. The scale-lengths calculated from the profiles are distributed over the range 09 6″.
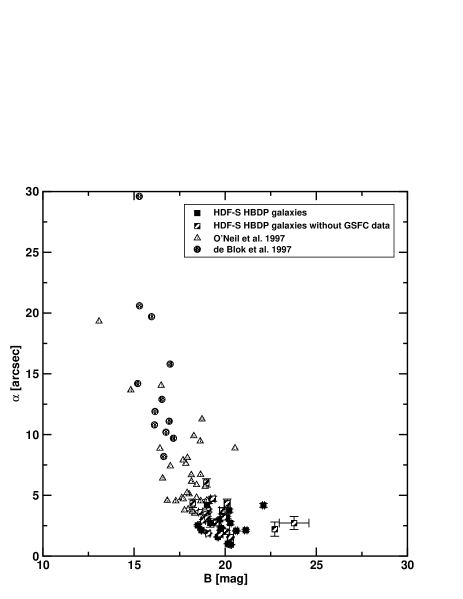
Our LSB candidate sample consists mainly of galaxies which could not be detected in other surveys, which are less sensitive for very low surface brightness outer regions, and they therefore fall below the diameter limits of these surveys. In Fig. 3 we compare our sample with the LSB galaxy samples of O’Neil et al. (1997a, b) and de Blok (1997). This graph shows that we predominantly find LSB galaxy candidates with small angular sizes and low total magnitudes. This would indicate that our sample consists of more distant or rather dwarfish LSB galaxies if compared to the sample of O’Neil et al. (1997a, b).
4.2 Central surface brightness distribution
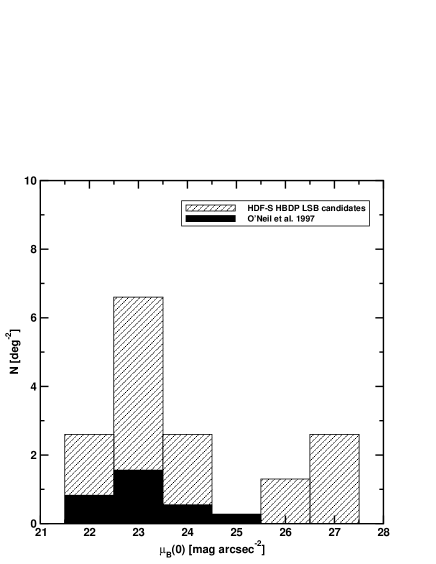

In Fig. 4 we show the band surface brightness distribution of the sample LSB galaxy candidates for the uncorrected (left panel) and the inclination corrected values (right panel). Both distributions show a maximum at a central surface brightness of = 23.0 mag arcsec-2. We compare these distributions to those of O’Neil et al. (1997a, b). In spite of our higher sensitivity in comparison to O’Neil et al. (1997a, b) the maximum is not shifted to much fainter central surface brightness. However, we were able to detect galaxies down to much lower central surface brightnesses.
Furthermore, the distribution of our LSB candidate sample shows an gap around = 24.5 mag arcsec-2), which could be an indication for a second population of very low surface brightness galaxies similar to the one proposed by Kambas et al. (2000). However, the gap could also be a result of selection effects by the use of two different methods to search for the LSB candidates (see Sect. 3.1). The detection limit of our data ( = 27 mag arcsec-2) unfortunately does not allow us to pursue this in more detail. We found three galaxies with very low surface brightness, and especially LSB J22320-60381 has one of the lowest central surface brightness known today ( = 26.86 mag arcsec-2). From the fact that the volume over which galaxies can be detected is a strong function of the central surface brightness of the individual galaxies (Dalcanton et al., 1997) we assume that these three extreme LSB galaxies have a significant impact on the volume densities of LSB galaxies.
4.3 Radial Profiles
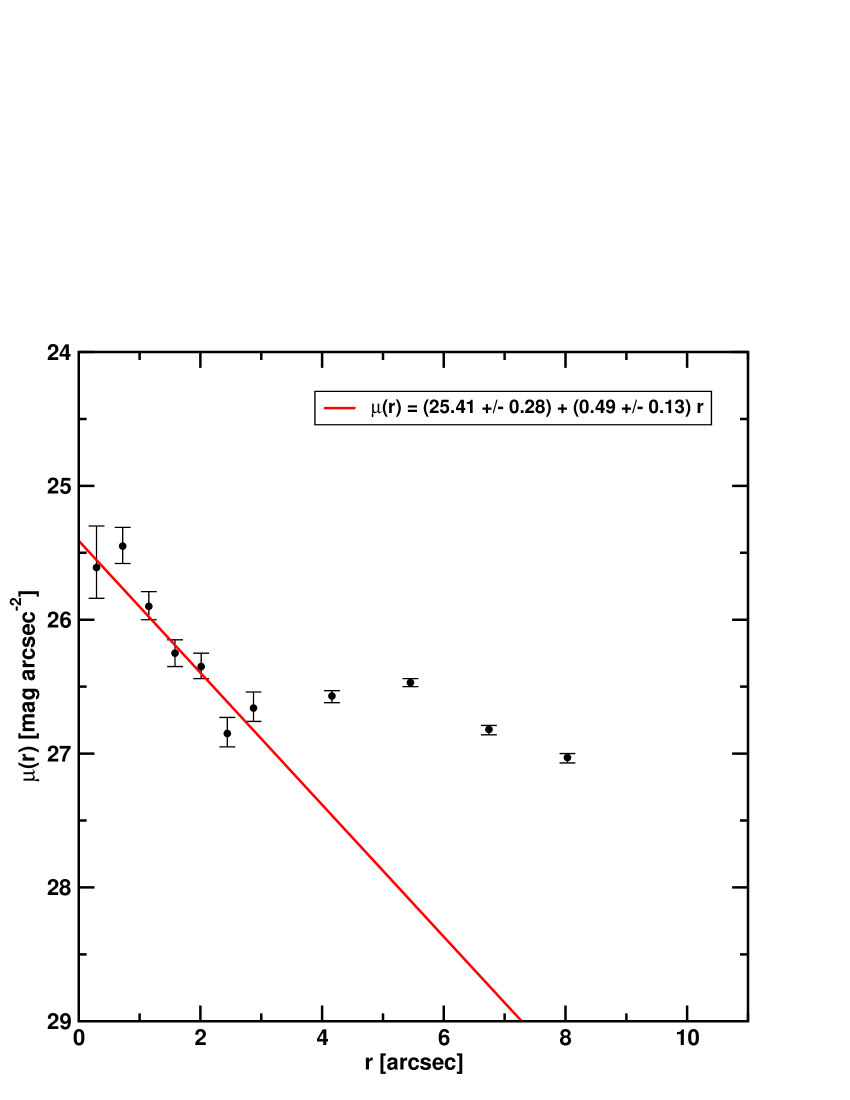
As described in Sect. 3.2 we derived azimuthally averaged radial surface brightness profiles for all 37 LSB galaxy candidates found in the NOAO field (see Figs. in App. A). The derived values for the two most extreme low surface brightness candidates (LSB J22311-60160 = 26.520.29 mag arcsec-2 and LSB J22364-60405 = 25.410.28 mag arcsec-2) have higher uncertainties due to their location in regions with lower signal to noise levels. We find that 21 (57%) of the 37 galaxies do not retain their exponential light distribution until fading into the noise. Their profiles are better fitted by a broken exponential. In all cases where GSFC -band data is available we find the same structure in these B-band profiles, so we are not dealing with a problem of sky subtraction. For 17 of the 37 galaxies the inner exponential zone, with a break at times the inner scale-length, is followed by a downbending, steeper outer region. This structure could be linked to a truncation of the radial light distribution similar to the one observed for HSB disk (van der Kruit, 1979; Pohlen et al., 2002) and irregular galaxies (Hunter & Elmegreen, 2006). On the other side, the remaining 4 galaxies show an inner exponential zone, with a break at times the inner scale-length, which is followed by an upbending, shallower outer region. These kind of profiles, called sometimes antitruncations, are also known for HSB and irregular galaxies (see Erwin et al., 2005; Pohlen & Trujillo, 2006; Hunter & Elmegreen, 2006).
For galaxies with truncated profiles the break appears to be too ’early’ compared to the mean value of 2.5 0.6 times the inner scale-length as observed by Pohlen & Trujillo (2006) for a large sample of nearby, late-type HSB galaxies. However, it is not yet clear what this ratio should be for LSB galaxies. In a sample of irregular galaxies, Hunter & Elmegreen (2006) find typical breaks in the range of times the inner scale-length for their mostly low surface brightness Im systems. Nevertheless, we know that these truncations are also observed for HSB galaxies at higher redshift (Pérez, 2004; Trujillo & Pohlen, 2005) and show up there in the profile spatially slightly ‘earlier’ compared to local galaxies, at times the inner scale length compared to times locally (see Pérez, 2004; Pohlen & Trujillo, 2006). Just concentrating on the 19 galaxies for which GSFC multi-color data is available we find that 6 have radial profiles showing a truncation. Four of these are selected as highly probable LSB candidates and for three of the four LSB candidates the break appears at a mean surface brightness of = 24.4 0.1 mag arcsec-2. This is consistent with the value of = 24.1 mag arcsec-2 given by (Pohlen & Trujillo, 2006) for truncations probably related to star-formation thresholds.
5 Summary and Conclusions
We presented the results of a search for LSB galaxies in a 0.76 deg2 NOAO –band dataset including the Hubble Deep Field-South, which resulted in a sample of 37 galaxies with sizes between 12 d 36 and central surface brightness of 22 mag arcsec-2 27 mag arcsec-2. Using the smaller (0.59 deg2 field of view) and less sensitive GSFC multi-color –band dataset we were able to obtain colors for 18 galaxies.
The galaxy selection was done in the –band NOAO data, using two different search methods: a median filter method for the faintest objects ( 24.5 mag arcsec-2) source extractor program SExtractor for the brighter ones.
In order to constrain the contamination of our sample by high redshift HSB galaxies in the background, we applied two selection criteria. On the one hand, by setting a diameter limit of 10.8 arcsec. On the other hand, by a comparison of the colors of the selected galaxies for which GSFC multi-color information were available (subsample of 18 galaxies), to those of five standard galaxy types. We were thus able to eliminate the 9 most distant objects in our sample, which are not intrinsic LSB galaxies. It was not possible, however, to derive distances for galaxies in the local (z 0.15) Universe due to the large uncertainties of this photometric redshift approach, and our sample will still have a small contamination of moderately (z 0.2–0.5) redshifted, cosmologically dimmed HSB galaxies.
Using these selection criteria we were able to derive a sample of 9 highly probable intrinsic LSB galaxy candidates for which spectroscopic follow-up observation should be carried out. Comparing the colors of our LSB candidate sample to those of the five standard HSB galaxy types we found that 7 occupy a different locus in color-color space, bluer in the and redder in the color for the vs. color-color diagram and bluer in the and redder in the color for the vs. color-color diagram. This seems to be a first hint for a different stellar population mix and, therefore, also for a different star formation history for these galaxies, which also have higher fluxes in the -band (compared to HSB galaxies). This is a possible indication for a more prominent Balmer-bump linked to a younger stellar population.
We also identified three galaxies with very low central surface brightness ( 25.5 mag arcsec-2), for which we have no color information. Due to their relatively large sizes we expect them to have distances of z 0.5, and they cannot be redshifted–dimmed HSBs. In total we ended up with a final sample of 12 possible LSB galaxy candidates in a 0.76 deg2 field. Scaling this result only for the field size of the GSFC we derived a number density of 16 LSB candidates per deg2, which is 4 times higher than the number densities derived for former surveys e.g., the Texas Survey which resulted in 4 LSB galaxies per deg2 (O’Neil et al., 1997a, b).
We did not find any giant LSB galaxiy with diameter larger than 1. In comparison to other surveys we only found galaxies from the small end of the size distribution, with scale-lengths smaller than 6 arcsec (see Fig. 3). This indicates that the majority of the derived sample could consists of more distant or dwarf like LSB galaxies compared to other surveys (e.g. Texas Survey). However, this assumption needs verification from spectroscopic observations.
The sample contains galaxies with moderate color indices but also one galaxy with a very red color index (LSB J22324-60520: -=0.46 mag, -=1.28 mag, -=1.99 mag).
Acknowledgements.
This research was supported by DFG Graduiertenkolleg ”The Magellanic Systems, Galaxy Interaction and the Evolution of Dwarf Galaxies” (Universities Bonn/Bochum). We thank the NOAO Deep Survey team for making the pilot survey data immediately public, and the STIS team at GSFC for the second data set.Appendix A Radial Profiles
Here we show the azimuthally averaged radial surface brightness profiles of the full sample of 37 LSB candidate galaxies found in the NOAO field. They were derived by fitting ellipses to the galaxies using the IRAF task ellipse from the stsdas package. The ellipses were choosen with a starting positions and allowing for only slight recentering by the ellipse task. Therefore the centers of the galaxies could change slightly between fits in the - and B-filter. For the 18 galaxies where filter data is available from the GSFC dataset, we also show the surface brightness profiles in this band. The central surface brightnesses in both filters was estimated fitting a single exponential profile. For this fitting process we did not include data points at radii smaller 0.9 arcsec which are influenced by seeing effects (rounding of profiles). For those galaxies showing a truncation or antitruncation (see Sect. 4.3) in the outer region of the profile we only fit the inner part using a pure exponential approach.


References
- Armandroff et al. (1998) Armandroff, T. E., Davies, J. E., & Jacoby, G. H. 1998, AJ, 116, 2287
- Bertin & Arnouts (1996) Bertin, E. & Arnouts, S. 1996, A&A, 117, 393
- Binggeli et al. (1990) Binggeli, B., Tarenghi, M., & Sandage, A. 1990, A&A, 228, 42
- Bothun et al. (1987) Bothun, G. D., Impey, C. D., Malin, D. F., & Mould, J. R. 1987, AJ, 94, 23
- Coleman et al. (1980) Coleman, G. D., Wu, C. C., & Weedman, D. W. 1980, ApJS, 43, 393
- Dalcanton et al. (1997) Dalcanton, J., Spergel, D. N., Gunn, J. E., Schmidt, M., & Schneider, D. P. 1997, AJ, 114, 2178
- Davies (1990) Davies, J. I. 1990, MNRAS, 244, 8
- de Blok (1997) de Blok, E. 1997, PhD thesis, University of Groningen
- Dell’Antonio et al. (1999) Dell’Antonio, I., Jannuzi, B. T., Smith, M., & Dey, A. 1999, PASP
- Disney & Phillipps (1983) Disney, M. & Phillipps, S. 1983, MNRAS, 205, 1253
- Erwin et al. (2005) Erwin, P., Beckman, J. E., & Pohlen, M. 2005, ApJ, 626, L81
- Fernández-Soto et al. (2002) Fernández-Soto, A., Lanzetta, K. M., Chen, H.-W., Levine, B., & Yahata, N. 2002, MNRAS, 330, 889
- Freeman (1970) Freeman, K. C. 1970, ApJ, 160, 811
- Giavalisco et al. (1996) Giavalisco, M., Livio, M., Bohlin, R. C., Macchetto, F. D., & Stecher, T. P. 1996, AJ, 112, 369
- Glazebrook, K. et al. (2006) Glazebrook, K. et al. 2006, in press
- Hunter & Elmegreen (2006) Hunter, D. A. & Elmegreen, B. G. 2006, ApJS, 162, 49
- Impey & Bothun (1997) Impey, C. & Bothun, G. 1997, ARA&A, 35, 267
- Impey et al. (1988) Impey, C., Bothun, G., & Malin, D. 1988, ApJ, 330, 634
- Kambas et al. (2000) Kambas, A., Davies, J. I., Smith, R. M., Bianchi, S., & Haynes, J. A. 2000, AJ, 120, 1316
- Kennicutt (1989) Kennicutt, R. C., J. 1989, ApJ, 344, 685
- Kennicutt (1992) Kennicutt, R. C., J. 1992, ApJS, 79, 255
- Kinney et al. (1996) Kinney, A. L., Calzetti, D., Bohlin, R. C., et al. 1996, ApJ, 467, 38
- Koo (1985) Koo, D. C. 1985, AJ, 90, 418
- Lilly et al. (1995) Lilly, S. J., Le Fevre, O., Crampton, D., Hammer, F., & Tresse, L. 1995, ApJ, 455, 50
- Liu & Green (1998) Liu, C. T. & Green, R. F. 1998, AJ, 116, 1074
- Loh & Spillar (1986) Loh, E. D. & Spillar, E. J. 1986, ApJ, 303, 154
- McGaugh & Bothun (1994) McGaugh, S. S. & Bothun, G. D. 1994, AJ, 107, 530
- Minchin et al. (2004) Minchin, R. F., Disney, M. J., Parker, Q. A., et al. 2004, MNRAS, 355, 1303
- Nilson (1973) Nilson, P. 1973, Uppsala General Catalog of Galaxies (Ann. Uppsala Astron. Obs., 6)
- O’Neil et al. (2004) O’Neil, K., Bothun, G., van Driel, W., & Monnier Ragaigne, D. 2004, A&A, 428, 823
- O’Neil et al. (1997a) O’Neil, K., Bothun, G. D., & Cornell, M. E. 1997a, AJ, 113, 1212
- O’Neil et al. (1997b) O’Neil, K., Bothun, G. D., Schombert, J., Cornell, M. E., & Impey, C. D. 1997b, AJ, 114, 2448
- Peacock (1999) Peacock, J. 1999, Cosmological Physics (Cambridge University Press)
- Pérez (2004) Pérez, I. 2004, A&A, 427, L17
- Pickering et al. (1997) Pickering, T. E., Impey, C. D., Van Gorkom, J. H., & Bothun, G. D. 1997, AJ, 114, 1858
- Pohlen et al. (2002) Pohlen, M., Dettmar, R.-J., Lütticke, R., & Aronica, G. 2002, A&A, 392, 807
- Pohlen & Trujillo (2006) Pohlen, M. & Trujillo, I. 2006, A&A, 454, 759
- Romanishin et al. (1982) Romanishin, W., Krumm, N., Salpeter, E., et al. 1982, ApJ, 263, 94
- Sabatini et al. (2003) Sabatini, S., Davies, J., Scaramella, R., et al. 2003, MNRAS, 341, 981
- Sabatini et al. (2005) Sabatini, S., Davies, J., van Driel, W., et al. 2005, MNRAS, 357, 819
- Schombert & Bothun (1988) Schombert, J. M. & Bothun, G. D. 1988, AJ, 95, 1389
- Schombert et al. (1992) Schombert, J. M., Bothun, G. D., Schneider, S. E., & McGaugh, S. S. 1992, AJ, 103, 1107
- Teplitz et al. (1998) Teplitz, H. I., Gardner, J. P., Palunas, P., et al. 1998, in American Astronomical Society Meeting, Vol. 193, 7507
- Trujillo & Pohlen (2005) Trujillo, I. & Pohlen, M. 2005, ApJ Lett., 630, L17
- van den Hoek et al. (2000) van den Hoek, L. B., de Blok, W. J. G., van der Hulst, J. M., & de Jong, T. 2000, A&A, 357, 397
- van der Hulst et al. (1993) van der Hulst, J. M., Skillman, E. D., Smith, T. R., et al. 1993, AJ, 106, 548
- van der Kruit (1979) van der Kruit, P. C. 1979, A&AS, 38, 15
- Yahata et al. (2000) Yahata, N., Lanzetta, K. M., Chen, H., et al. 2000, ApJ, 538, 493