The Millennium Galaxy Catalogue: The luminosity functions of bulges and discs and their implied stellar mass densities
Abstract
We derive the luminosity functions of elliptical galaxies, galaxy bulges, galaxy pseudo-bulges and galaxy discs from our structural catalogue of 10,095 galaxies. In addition we compute their associated luminosity and stellar mass densities. We show that spheroidal systems (elliptical galaxies and the bulges of disc galaxies) exhibit a strong color bimodality indicating two distinct types of spheroid which are separated by a core color of mag. We argue that the similarity of the red elliptical and the red bulge luminosity functions supports our previous arguments that they share a common origin and surprisingly find that the same follows for the blue ellipticals and blue bulges, the latter of which we refer to as pseudo-bulges. In terms of the stellar mass budget we find that per cent is currently in the form of discs, per cent in the form of red spheroids ( per cent ellipticals, per cent bulges) and the remainder is in the form of blue spheroidal systems ( per cent blue ellipticals and per cent pseudo-bulges). In terms of galaxy formation we argue that our data on galaxy components strongly supports the notion of a two-stage formation process (spheroid first, disc later) but with the additional complexity of secular evolution occurring in quiescent discs giving rise to two distinct bulge types: genuine ’classical’ bulges and pseudo-bulges. We therefore advocate that there are three significant structures underpinning galaxy evolution: classical spheroids (old); pseudo-bulges (young) and discs (intermediate). The luminous nearby galaxy population is a mixture of these three structural types. The nature of the blue elliptical galaxies remains unclear but one possibility is that these constitute recently collapsed structures supporting the notion of mass-dependent spheroid formation with redshift.
Subject headings:
galaxies: spiral - galaxies: structure - galaxies: photometry - galaxies: fundamental parameters - ISM: dust, extinction1. Introduction
In a recent paper (Driver et al., 2006) we demonstrated that galaxy bimodality is not just evident in color (see Strateva et al., 2001; Baldry et al., 2004) but also in the joint color-structure plane (see also Ball et al., 2006; Park et al., 2006; Choi et al., 2006; Conselice, 2006). In that work we used SDSS photometry and single Sérsic (1963; Graham & Driver, 2005) profile fits to investigate the distribution of 10,095 relatively nearby luminous ( mag) galaxies in the color-Sérsic index plane. The red peak is comprised of highly concentrated, high-Sérsic index systems while the blue peak contains more diffuse, low-Sérsic index systems. This is important as any movement from the blue peak to the red peak will require modifying the orbits, angular momentum and energy of the entire stellar population. A simple inert process (e.g., exhaustion of the gas supply, stripping, etc.) could not achieve this, although a violent major merger event could (e.g., Barnes & Hernquist, 1992). Perhaps more importantly, when the population was segregated by Hubble type we found that while the early-type galaxies (E/S0s, i.e., bulge dominated) lay almost exclusively in the red-concentrated peak, and the late-type spirals (Sd/Irr, i.e., disc dominated) in the blue-diffuse peak, the mid-type spirals (Sabc, i.e., bulge plus disc systems) straddled both peaks with no obvious sign of bimodality. We inferred from this that galaxy bimodality arises because of the two component nature of galaxies and that spheroidal structures (i.e., ellipticals and bulges) will lie exclusively in the red-compact peak and discs in the blue-diffuse peak. As classical bulges lie within thin rotating disc systems this argues for early spheroid formation (via rapid merging or collapse) followed by a more quiescent phase in which the extended disc can form. To explore this further we have performed bulge-disc decomposition of all 10,095 galaxies in the Millennium Galaxy Catalogue (see Allen et al., 2006) by fitting two-component Sérsic-bulge plus exponential-disc models using GIM2D (Simard et al., 2002). In this Letter we report the luminosity functions derived for various component samples (e.g. ellipticals, bulges, discs) and tabulate the associated luminosity and stellar mass densities for each component class.
Throughout this paper we assume a CDM cosmology with , , and adopt (100 km s-1 Mpc-1) for ease of comparison with other results.
2. MGC Component Luminosity Functions
The Millennium Galaxy Catalogue (MGC) is a deep ( mag arcsec-2), wide area ( deg2), -band imaging and redshift survey covering a deg wide strip along the equatorial sky from 10h to 14h 50′. The MGC contains 10,095 galaxies down to mag, of which 9,696 have redshift information. Full details of the imaging survey can be found in Liske et al. (2003), with the spectroscopic follow-up described by Driver et al. (2005; hereafter D05). In Allen et al. (2006) the bulge-disc decompositions were reported for all 10,095 mag galaxies, and a final structural catalogue produced, consisting of bulge-only (Sérsic profiles), disc-only (Sérsic or exponential profiles) and bulge plus disc systems (Sérsic plus exponential profiles).
Luminosity functions are computed using the standard step-wise maximum likelihood (SWML) estimator originally described by Efstathiou, Ellis & Peterson (1988), with samples divided into bins of absolute magnitude. The MGC spectroscopic sample has a nominal Kron magnitude limit of mag. However, here we will use the GIM2D total magnitudes (derived by integrating the light profiles to infinity) so that there is no longer a single limit that applies to the sample as a whole. To accommodate for this, each galaxy now has a unique magnitude limit, defined by: . Following D05, we restrict our sample to galaxies in the redshift range and within carefully defined size and surface brightness boundaries (see D05 and Liske et al. 2006 for full details).
2.1. k+e corrections
In D05 individual k-corrections were derived for each galaxy by comparing the total galaxy broad-band colors () to the 27 spectral templates given in Poggianti (1998) and identifying the best fitting spectrum. Having now separated the MGC galaxies into bulges and discs (see Allen et al., 2006) the global k-correction is not necessarily valid. However, approximately per cent of our sample are best fit by one component profiles (i.e., bulge-only or disc-only galaxies) and for these systems we adopt the k-corrections as previously derived in D05. For the remaining, two-component systems we consider our component colors too coarse to be used to derive robust individual k-corrections (as our decompositions are done in a single filter only). For the case of blue bulges and blue discs the global k-correction is likely to be appropriate for both (assumming that the blue bulge has formed from the disc). In the case of discs surrounding classical red bulges we note that for low- systems the k-correction is likely to be appropriate for the discs but not the bulges. In the case of high- systems we note that Peletier & Bacells (1996) report that such discs are typically redder. We therefore consider it appropriate to continue to adopt the global k-correction for both our discs and blue bulges. For the red bulges, however, we adopt the spectral template most frequently adopted by our single component red ellipticals (a Sa 15 Gyr spectrum). This spectrum can be represented by a fourth order polynomial valid over the redshift range only:
| (1) |
We note that if we follow a similar procedure for the discs and blue bulges the implied characteristic turnover luminosities (shown in Table 1) are systematically reduced by mag and the implied stellar masses reduced by per cent.
To model evolution we assume pure luminosity evolution of the following form:
| (2) |
where is set to for the global luminosity function (see Driver et al., 2005), for blue components (discs, blue bulges, blue ellipticals), and for red components (red bulges and red ellipticals). These values are based on the recent results reported in Zucca et al. (2006) for red and blue systems (their type 1 and 4 respectively). We do not model number evolution as the redshift range is small and our merger rate estimates, based on dynamically close pairs within the MGC, are low (see De Propris et al., 2005 and De Propris et al., 2007).
2.2. Luminosity functions
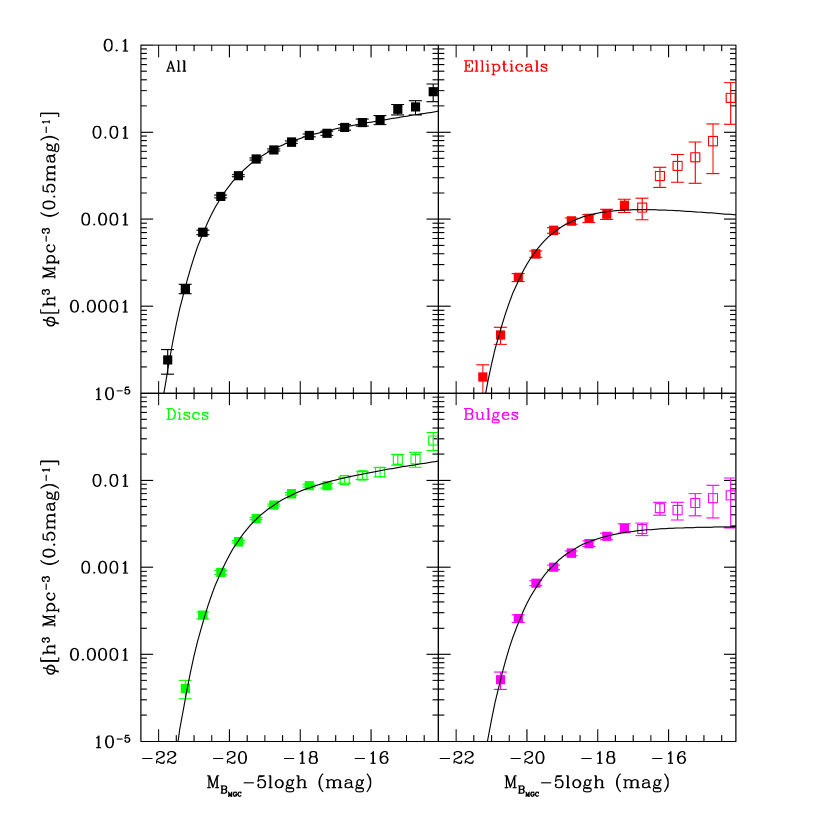
Fig. 1 shows the luminosity distributions and Schechter function fits for our full galaxy sample (upper left), ellipticals only (upper right; i.e. objects with after logical filtering, see Fig. 13 of Allen et al. 2006), discs (lower left) and bulges (lower right). Note that the Schechter function in the upper left differs from that shown in D05 because the magnitudes are now based on Sérsic profiles integrated to infinity rather than Kron magnitudes. This difference is significant, resulting in a brighter value by about mag but a comparable faint-end slope, . Analysis of independent repeat observations of galaxies suggests that our decompositions are valid to good accuracy ( mag and mag, see Allen et al. 2006) for componentss with luminosities with mag. Below this limit our decompositions become increasingly less reliable and these data are shown with open symbols. The most striking result from Fig. 1 is the rapidly rising faint-end slope for the elliptical population. This was noted previously in Driver et al. (2006) and was shown to be due to contamination of the classical elliptical sample by low luminosity blue spheroids (see also Ellis et al., 2005).
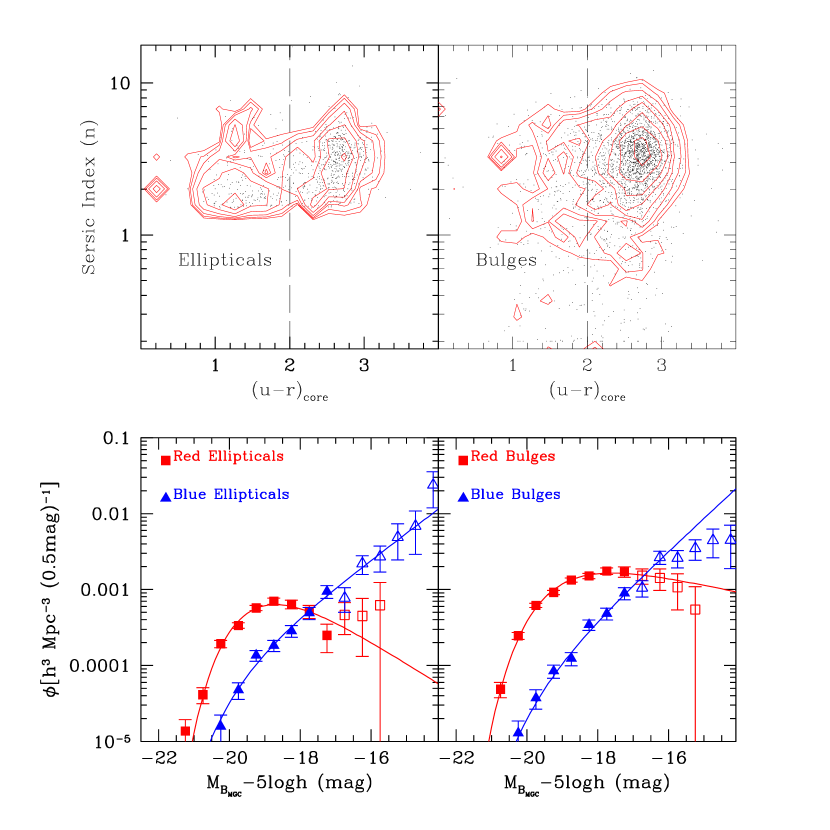
In Fig. 2 we show the color-structure plane defined by SDSS core () PSF color versus component Sérsic index for the ellipticals (upper left) and galaxy bulges (upper right). The bimodality of the ellipticals is striking, with a blue and red population being apparent. The blue sample defines what we label blue ellipticals which were identified in Ellis et al. (2005) and quantified in Driver et al. (2006). A cut at mag provides a clear division. The lower panels of Fig. 2 show the luminosity distributions and Schechter function fits for the blue and red samples. We see that red ellipticals and blue ellipticals follow markedly different trends and it is indeed the blue ellipticals which are responsible for the apparent upturn in the total elliptical galaxy luminosity function at very faint absolute magnitudes. We note that when the bulges are divided in the same manner, the blue bulge luminosity function is very similar to that of the ellipticals, possibly indicating some common origin.
It is tempting to associate the blue bulges with pseudo-bulges (see Kormendy & Kennicutt 2004), which are believed to arise from inner disc instabilities giving rise to a ’swelling’ of the disc in the central region. As many of our blue bulges have mag, where our bulge-disc decompositions become unreliable, we cannot unambiguously confirm this population as pseudo-bulges but for the moment adopt this nomenclature for ease of discussion. The blue ellipticals remain somewhat intriguing and appear to define a new class of object as previously noted by Ellis et al. (2005) and Driver et al. (2006; see also Ilbert et al., 2006 who identify them as a rapidly fading population). We are currently exploring these systems further (Ellis et al., 2007) and for the moment simply flag them as interesting. From their distinct luminosity function it is clear they are predominantly low luminosity systems and could potentially represent the local counterparts to the luminous blue compact galaxies studied by Guzman et al. (1997) and Phillips et al. (1997).
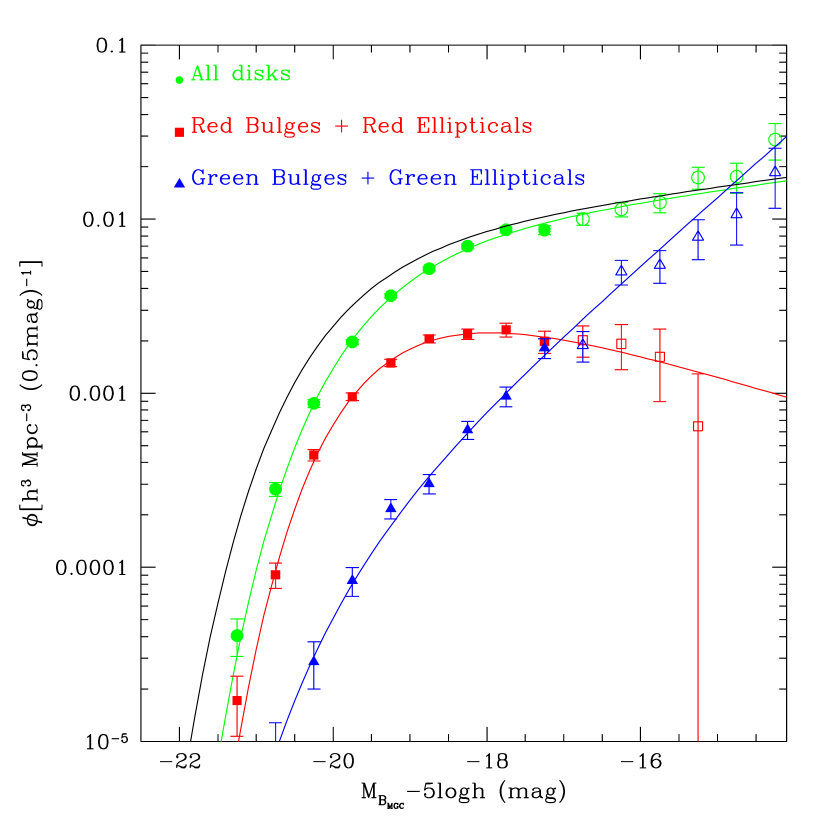
Fig. 3 shows the final component luminosity functions with the red ellipticals and red bulges combined into a single red spheroid group and the blue ellipticals and blue bulges grouped together into a single blue spheroid class. The justification for this is the similarity in the shapes and ranges of the luminosity distributions from Fig. 2.
2.3. Luminosity densities and stellar-mass densities
Table 1 shows the Schechter function values for the luminosity function fits shown in Figs. 1, 2 & 3, along with their associated -band luminosity, , and stellar mass densities, . These are derived using the following expressions:
| (3) |
and
| (4) |
The latter expression is first shown in Driver et al. (2006) and is based on the color to mass-to-light ratios given by Bell & de Jong (2001) which assume a Salpeter-’lite’ IMF. Note that the colour for each galaxy was obtained by matching the MGC to the Sloan Digital Sky Survey first data release (Abazajian et al. 2003).
3. Discussion
From Table 1 we see that per cent of the stellar mass is in the form of galaxy discs, per cent in red elliptical galaxies and per cent in classical red bulges. Previously it has been reported (Bell et al. 2003; Baldry et al. 2004; Driver et al. 2006) that per cent of the stellar mass lies in the red peak dominated by early-type galaxies. As we have now separated the early-type galaxies into bulges and discs one expects that the spheroid (elliptical+bulge) stellar mass density should be lower than the early-type stellar mass density, which of course includes the associated disc components of the lenticular galaxies. Examining the color-structure plane (Fig. 2 upper panels) for ellipticals and bulges we see that the red populations (of each type) lie in the same location. This is indicative of a shared origin for red ellipticals and classical red bulges. When combined the red spheroids account for per cent of the stellar mass density. Hence the bulk of the stellar mass ( per cent) exists in the two classical structures originally defined by de Vaucouleurs (1959).
The remaining per cent lie in the form of blue ellipticals ( per cent) and blue bulges ( per cent). These latter two populations can therefore be considered minor from a cosmological perspective. Furthermore, as the blue bulges are likely to represent either difficulties in the decomposition (e.g., bars) or pseudo-bulges (disc swelling), their stellar mass could arguably be added, in either case, to that of the galaxy discs (i.e., per cent). The nature of the blue ellipticals (previously dubbed blue spheroids) remains uncertain but they appear to constitute a very small fraction of the stellar mass budget, although we must note the near divergent faint-end slopes. The primary conclusion then is that the stellar mass is mainly divided between two distinct structures: blue 2D discs and red 3D spheroids.
Finally we note that the results presented in this Letter are based on -band data and therefore susceptible to dust attenuation (see Shao et al., 2006). Bell & de Jong (2001) argue that the effect on an individual galaxy’s stellar mass is less than one might expect (see their fig. 1) because the observed decrease in total luminosity is offset by the increased stellar mass-to-light ratio inferred from the redenned colors, therefore yielding comparable final stellar masses. We explore this in detail in Driver et al. (2007) and note that while the masses are modified somewhat the final stellar mass breakdown is not dramatically altered.
References
- Abazajian et al. (2003) Abazajian K., et al., 2003, AJ, 126, 2081
- Allen et al. (2006) Allen P., Driver S.P., Graham A.W., Cameron E., Liske J., Cross N.J.G., De Propris R., 2006, MNRAS, 371, 2
- Baldry et al. (2004) Baldry I., Glazebrook K., Brinkmann J., Ivezic Z., Lupton R.H., Nichol R.C., Szalay A.S., 2004, ApJ, 600, 681
- Ball et al. (2006) Ball N., Loveday J., Brunner R.J., 2006, MNRAS, submitted, (astro-ph/0610171)
- Barnes & Hernquist (1992) Barnes J.E., Hernquist L., 1992, Nature, 360, 715
- Bell et al. (2003) Bell E., McIntosh D.H., Katz N., Weinberg M.D., 2003, ApJS, 149, 289
- Bell & de Jong (2001) Bell E., de Jong R.S., 2001, ApJ, 550, 212
- Choi et al. (2006) Choi Y., Park C., Vogeley M., 2006, ApJ, in press, astro-ph/0611607
- Conselice (2006) Conselice C.J., 2006, MNRAS, submitted, astro-ph/0610016
- De Propris et al. (2005) De Propris R., Liske J., Driver S.P., Allen P.D., Cross N.J.G., 2005, AJ, 130, 1516
- De Propris et al. (2007) De Propris R., Liske J., Conselice C., Driver S.P., Graham A.W., Allen P.D., 2007, MNRAS, submitted
- de Vaucouleurs (1959) de Vaucouleurs G., 1959, HDP, 53, 275
- Driver et al. (2005) Driver S.P., Liske J., Cross N.J.G., De Propris R., Allen P.D., 2005, MNRAS, 360, 81
- Driver et al. (2006) Driver S.P., et al., 2006, MNRAS, 368, 414
- Driver et al. (2007) Driver S.P., Popescu C., Tuffs R.J., Liske J., Graham A.W., Allen P.D., De Propris R., 2007, MNRAS, submitted
- Efstathiou et al. (1988) Efstathiou G., Ellis R.S., Peterson B.A., 1988, MNRAS, 232, 431
- Ellis et al. (2005) Ellis S.C., Driver S.P., Allen P.D., Liske J., Bland-Hawthorn J., De Propris R., 2005, MNRAS, 363, 1257
- Ellis et al. (2007) Ellis S.C., Driver S.P., Liske J., Graham A.W., 2007, MNRAS, in preparation
- Graham & Driver (2005) Graham A.W., Driver S.P., 2005, PASA, 22, 118
- Guzman et al. (1998) Guzman R., Jangren A., Koo D.C., Bershady M.C., Simard L., 1998, ApJ, 495, 13
- Ilbert et al. (2006) Ilbert O., et al., 2006, A&A, 453, 809
- Kormendy & Kennicutt (2004) Kormendy J., Kennicutt R.C.Jr., 2004, ARA&A, 42, 603
- Liske et al. (2003) Liske J., Lemon D., Driver S.P., Cross N.J.G., Couch W.J., 2003, MNRAS, 344, 307
- Liske et al. (2006) Liske J., Driver S.P., Allen P.D., Cross N.J.G., De Propris R., 2006, MNRAS, 369, 1547
- Park et al. (2006) Park C., Choi Y., Vogeley M., Gott II J.R., Blanton M.R., 2006, ApJ, in press, astro-ph/0611610
- Peletier & Bacells (1996) Peletier R.F., Bacells M., AJ, 111, 2238
- Phillips et al. (1997) Phillips A.C., et al., 1997, ApJ, 489, 543
- Poggianti (1997) Poggianti B., 1997, A&AS, 122, 399
- Sérsic (1963) Sersic J.-L., 1963, BAAA, 6, 41
- Shao et al. (2006) Shao Z., Xiao Q., Shen S., Mo H.J., Xia X., Deng Z., 2006, ApJ, submitted, astro-ph/0611714
- Simard et al. (2002) Simard L., et al., 2002, ApJS, 142, 1
- Strateva et al. (2001) Strateva I., et al., 2001, AJ, 122, 1861
- Zucca et al. (2006) Zucca E., et al., 2006, A&A, 455, 879
| Sample | ||||||
|---|---|---|---|---|---|---|
| (mag) | ( Mpc mag) | ( Mpc-3) | ( Mpc-3) | |||
| All | ||||||
| All Discs | ||||||
| Bulges | ||||||
| Ellipticals | ||||||
| Blue Ellipticals | aaThese luminosity functions are potentially divergent within the specified errors, giving rise to extreme luminosity and stellar mass densities. As we do not know whether these distributions continue to diverge we infer the luminosity and stellar mass densities required for a fully self-consistent table, i.e., the stellar mass of blue spheroids is derived by subtracting the red ellipticals’ stellar mass from the total ellipticals’ stellar mass, etc. | aaThese luminosity functions are potentially divergent within the specified errors, giving rise to extreme luminosity and stellar mass densities. As we do not know whether these distributions continue to diverge we infer the luminosity and stellar mass densities required for a fully self-consistent table, i.e., the stellar mass of blue spheroids is derived by subtracting the red ellipticals’ stellar mass from the total ellipticals’ stellar mass, etc. | ||||
| Red Ellipticals | ||||||
| Blue Bulges | aaThese luminosity functions are potentially divergent within the specified errors, giving rise to extreme luminosity and stellar mass densities. As we do not know whether these distributions continue to diverge we infer the luminosity and stellar mass densities required for a fully self-consistent table, i.e., the stellar mass of blue spheroids is derived by subtracting the red ellipticals’ stellar mass from the total ellipticals’ stellar mass, etc. | aaThese luminosity functions are potentially divergent within the specified errors, giving rise to extreme luminosity and stellar mass densities. As we do not know whether these distributions continue to diverge we infer the luminosity and stellar mass densities required for a fully self-consistent table, i.e., the stellar mass of blue spheroids is derived by subtracting the red ellipticals’ stellar mass from the total ellipticals’ stellar mass, etc. | ||||
| Red Bulges | ||||||
| Ellipticals + Bulges | ||||||
| Red (Ellipticals + Bulges) | ||||||
| Blue (Ellipticals + Bulges) | aaThese luminosity functions are potentially divergent within the specified errors, giving rise to extreme luminosity and stellar mass densities. As we do not know whether these distributions continue to diverge we infer the luminosity and stellar mass densities required for a fully self-consistent table, i.e., the stellar mass of blue spheroids is derived by subtracting the red ellipticals’ stellar mass from the total ellipticals’ stellar mass, etc. | aaThese luminosity functions are potentially divergent within the specified errors, giving rise to extreme luminosity and stellar mass densities. As we do not know whether these distributions continue to diverge we infer the luminosity and stellar mass densities required for a fully self-consistent table, i.e., the stellar mass of blue spheroids is derived by subtracting the red ellipticals’ stellar mass from the total ellipticals’ stellar mass, etc. |