11email: valcheva@phys.uni-sofia.bg, evgeni@phys.uni-sofia.bg, japet@phys.uni-sofia.bg 22institutetext: European Southern Observatory, Ave. Alonso de Cordova 3107, Casilla 19, Santiago 19001, Chile
22email: vivanov@eso.org
Carbon Stars and C/M Ratio in the WLM Dwarf Irregular Galaxy
We identify the rich Carbon star population of the Magellanic-type dwarf irregular galaxy WLM (Wolf-Lundmark-Melotte) and study its photometric properties from deep near-IR observations. The galaxy exhibits also a clear presence of Oxygen rich population. We derive a Carbon to M-star ratio of C/M =0.560.12, relatively high in comparison with many galaxies. The spatial distribution of the AGB stars in WLM hints at the presence of two stellar complexes with a size of a few hundred parsecs.
Using the Hi map of WLM and the derived gas-to-dust ratio for this galaxy N(Hi)/E( )=6010 [1021 at. cm-2 mag-1] we re-determined the distance modulus of WLM from the IR photometry of four known Cepheids, obtaining (mM)0=24.840.14 mag. In addition, we determine the scale length of 0.750.14 kpc of WLM disk in -band.
Key Words.:
Galaxies: individual: WLM, distance, gas-to-dust ratio, scale length, C/M ratio – Galaxies: Local Group, irregular – Stars: AGB, Carbon1 Introduction
WLM (Wolf-Lundmark-Melotte; also DDO 221; Wolf wol09 (1909), Melotte mel26 (1926)) is a dwarf irregular Local Group member. Earlier photographic surveys of the galaxy were presented in Ables & Ables (abl77 (1977)) and Sandage & Carlson (san85 (1985)). The first CCD observations of WLM were performed by Ferraro et al. (fer89 (1989)) who reported significant variations in the recent star-formation rate across the galaxy. They also detected uniform underlying relatively old stellar population (1 Gyr). Later on, Minniti & Zijlstra (min97 (1997)) derived from and -band photometry a distance modulus (m-M)0=24.750.1 mag and [Fe/H]= 1.450.2. Hodge et al. (hod99 (1999)) reported the first HST observations of WLM. They resolved the sole globular cluster (Ables & Ables abl77 (1977)) and obtained (m-M)0=24.730.07 mag, [Fe/H]= 1.520.08 and an age of 14.80.6 Gyr, typical for the old globulars in the Milky Way. Dolphin (dol00 (2000)) concluded that the WLM started to form stars about 12 Gyr ago, with approximately half of the star-formation occurring during the last 9 Gyr, also based on HST imaging.
Recently, Venn et al. (ven03 (2003)) determined [Fe/H]= 0.29 from high-resolution spectroscopy of two WLM blue supergiants. They found depleted stellar Oxygen abundance by a factor of five, in comparison with the Oxygen abundance of the Hii regions. Even though later Lee et al. (lee05 (2005)) reduced the discrepancy, some unusual chemical evolution history is required to explain the observations because the enhanced stellar abundance would put WLM well above the metallicity-luminosity relation.
These results make it important to study the Carbon star in WLM because of their sensitivity to the metal abundance. Besides, AGB stars are representative for the stellar population with ages between 1 – 10 Gyr and can be used as a observational constraint to the properties of the post-main sequence stellar evolution. Initially, the behavior of the C/M ratio is understood at least qualitatively (Scalo & Miller sca81 (1981), Iben & Renzini ibe83 (1983)). Large number of studies of AGB stars in Local group galaxies was performed using optical narrow band imaging. It is turn out to be an easy way to separate M-type from Carbon stars (Albert et al. al00 (2000), Battinelli & Demers bat04 (2004)). The progress in the recent years made it possible to produce the first observational calibrations of the C/M ratio versus metallicity relation (Groenewegen gro06 (2006), Cioni & Habing cio05 (2005), Battinelli & Demers bat05 (2005)).
As AGB stars are almost the brightest cool stars it is easy to be investigated in the near-IR range. The interest in this region of the spectrum grow up strongly in the last three years (Cioni & Habing cio03 (2003), cio05 (2005), Kang et al. kang05 (2005), kang06 (2006), Sohn et al. sohn06 (2006)). Here we report analysis of the Carbon stars in WLM from near-IR imaging.
2 Observations and data reduction
The observations of WLM were made in Dec 2004 under non-photometric conditions. In order to estimate the foreground contamination an additional field located 14.8 arcmin South from the center of the galaxy, far enough to eliminate the galaxy contribution, was observed in Jul 2006 (hereafter ”clear sky” field). The near-IR imaged and spectrograph SofI (Son of ISAAC) at the ESO NTT (New Technology Telescope) on La Silla was used. The instrument is equipped with 10241024 Hawaii HgCdTe array with 18.5 micron square pixels and scale of 0.288 arcsec pixel-1, giving a field of view of 4.924.92 arcmin2. We alternated between the target and a clear patch of sky nearby. To minimize the effects of array cosmetics and to improve the sky subtraction we introduced a small random jitter of up to a few tens of arcseconds between the sequential images. In total, we collected 10 images for both fields in and 20 on the galaxy and 15 on the ”clear sky” field in . Each of the images in is the average of s exposures and of s exposures in . The total integration time was 10 min in (hereafter for simplicity) and in 21.33 min on the galaxy and 16 min on the ”clear sky”.
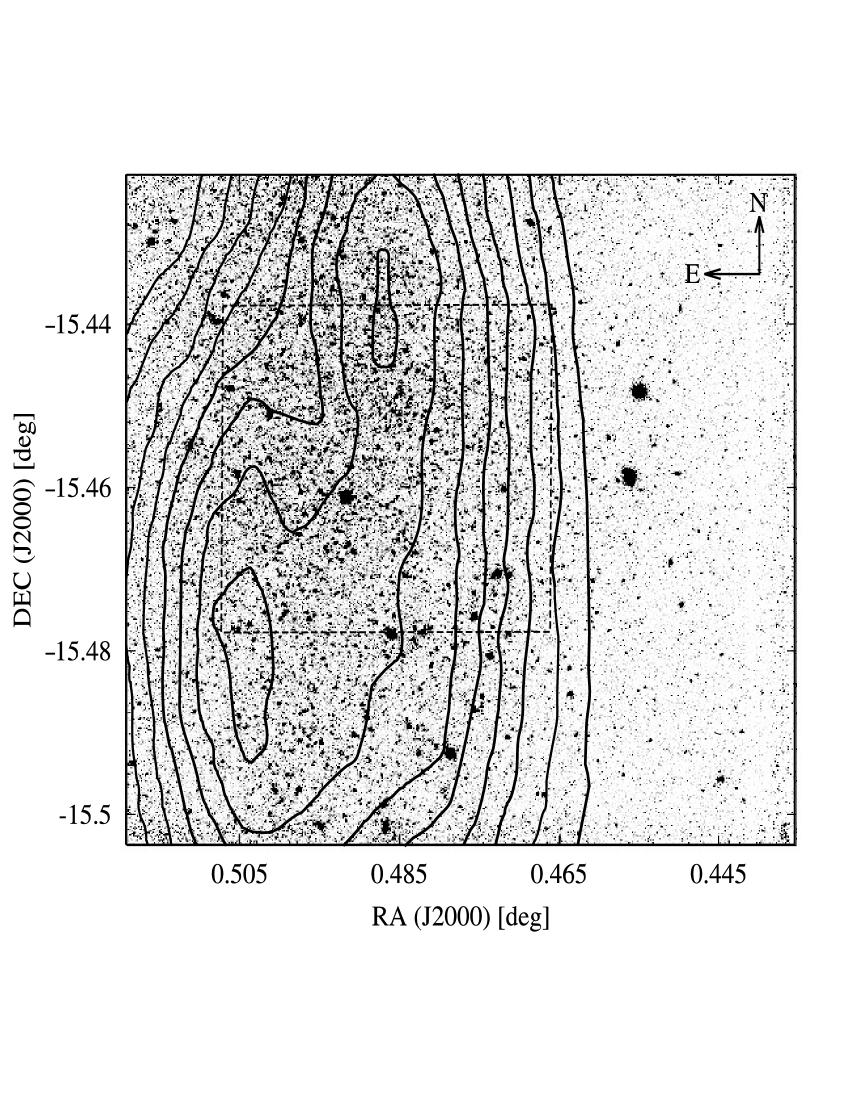
The data reduction followed the typical steps. First, we created a sky for each filter by median combination of the off-target images using suitable upper limits and rejection algorithms to exclude the stars present in the sky field. Next, we subtracted the sky from each image, and divided it by the dome flat. The dome flats are preferable in comparison with the sky flats because they allow us to remove the variable bias level, found in some Hawaii detectors. To account for the uneven illumination of the dome flat screen, we applied an illumination correction. It was derived from the photometry of a standard star, placed on 16 positions across the field of average view, in a 44 grid. Finally, the individual images were aligned and combined to form the final image (Fig. 1).
The photometric calibration was performed by comparing our instrumental photometry with the measurements from the 2MASS Point Source Catalog:
| (1) |
| (2) |
based on 18 common stars. Here and are the 2MASS systematic magnitudes, and and are the instrumental magnitudes. No statistically significant color terms were found.
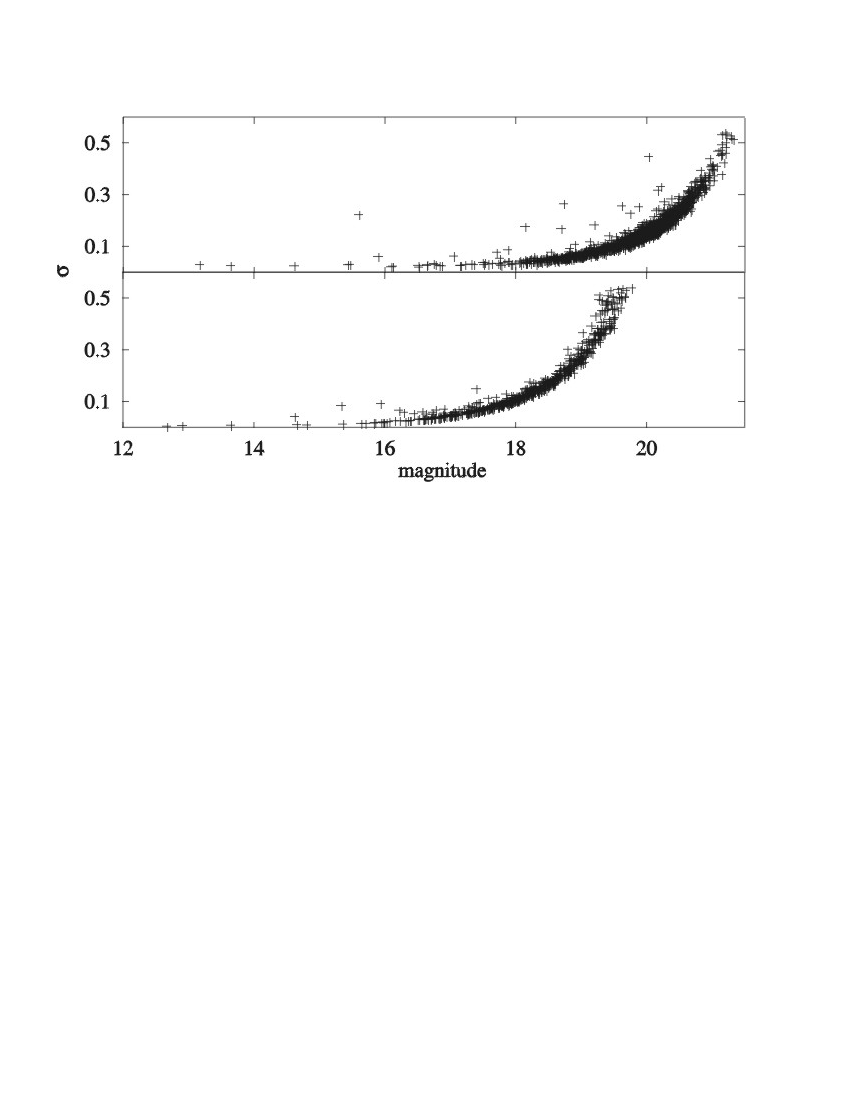
The photometry was performed with the IRAF DAOPHOT package. In galaxy field 1550 stars were detected in and 739 in with threshold of respectively 4 and 3 above the background. The instrumental magnitudes for each filter were obtained by using constant Gaussian PSF. The positions and magnitudes of all measured stars matched in both and frames with maximum tolerance of 3 pixels (0.86 arcsec) are given in Tabl. 1. The measurement errors are plotted in Fig. 2.
The reduction and calibration procedures for ”clear sky” field follow the analogical steps. The photometric equations obtained from 7 2MASS stars
| (3) |
| (4) |
were used to transform the magnitudes of 89 stars in and 67 in into 2MASS magnitudes. Matching procedure gives in total 50 common stars in and .
| No | R.A. | Dec. | Note | ||
|---|---|---|---|---|---|
| 1 | 00:01:45.62 | 15:30:06.6 | 19.713 (0.135) | 18.268 (0.131) | M05 LC 120 |
| 2 | 00:01:46.86 | 15:29:44.0 | 18.150 (0.047) | 16.737 (0.058) | C |
| 3 | 00:01:47.40 | 15:29:49.1 | 19.762 (0.119) | 18.376 (0.155) | C |
| 4 | 00:01:47.50 | 15:27:54.8 | 19.222 (0.073) | 18.402 (0.140) | |
| 5 | 00:01:47.99 | 15:27:47.5 | 19.408 (0.092) | 17.487 (0.065) | BD04 |
| 6 | 00:01:48.20 | 15:26:49.0 | 19.327 (0.088) | 17.855 (0.097) | C |
| 7 | 00:01:48.34 | 15:28:08.5 | 19.402 (0.107) | 17.462 (0.096) | C |
| 8 | 00:01:48.42 | 15:27:08.6 | 19.078 (0.069) | 18.273 (0.118) | |
| 9 | 00:01:48.79 | 15:27:35.2 | 19.800 (0.130) | 18.849 (0.232) | |
| 10 | 00:01:48.80 | 15:27:16.8 | 19.132 (0.068) | 18.037 (0.108) | BD04 |
| 11 | 00:01:49.09 | 15:27:06.3 | 19.712 (0.109) | 18.985 (0.255) | |
| 12 | 00:01:49.11 | 15:29:03.3 | 19.708 (0.114) | 19.501 (0.418) | |
| 13 | 00:01:49.26 | 15:26:53.4 | 13.177 (0.029) | 12.683 (0.004) | |
| 14 | 00:01:49.33 | 15:28:24.1 | 19.495 (0.092) | 18.920 (0.253) | |
| 15 | 00:01:49.50 | 15:26:06.4 | 18.821 (0.056) | 18.021 (0.103) | |
| 16 | 00:01:49.56 | 15:27:31.0 | 15.615 (0.222) | 14.631 (0.042) | G |
| 17 | 00:01:49.57 | 15:28:00.6 | 18.921 (0.075) | 17.781 (0.090) | |
| 18 | 00:01:49.79 | 15:29:42.1 | 19.211 (0.076) | 18.764 (0.217) | |
| 19 | 00:01:49.88 | 15:26:32.3 | 18.833 (0.091) | 17.404 (0.090) | C |
| 20 | 00:01:49.94 | 15:26:20.7 | 19.196 (0.076) | 18.640 (0.192) |
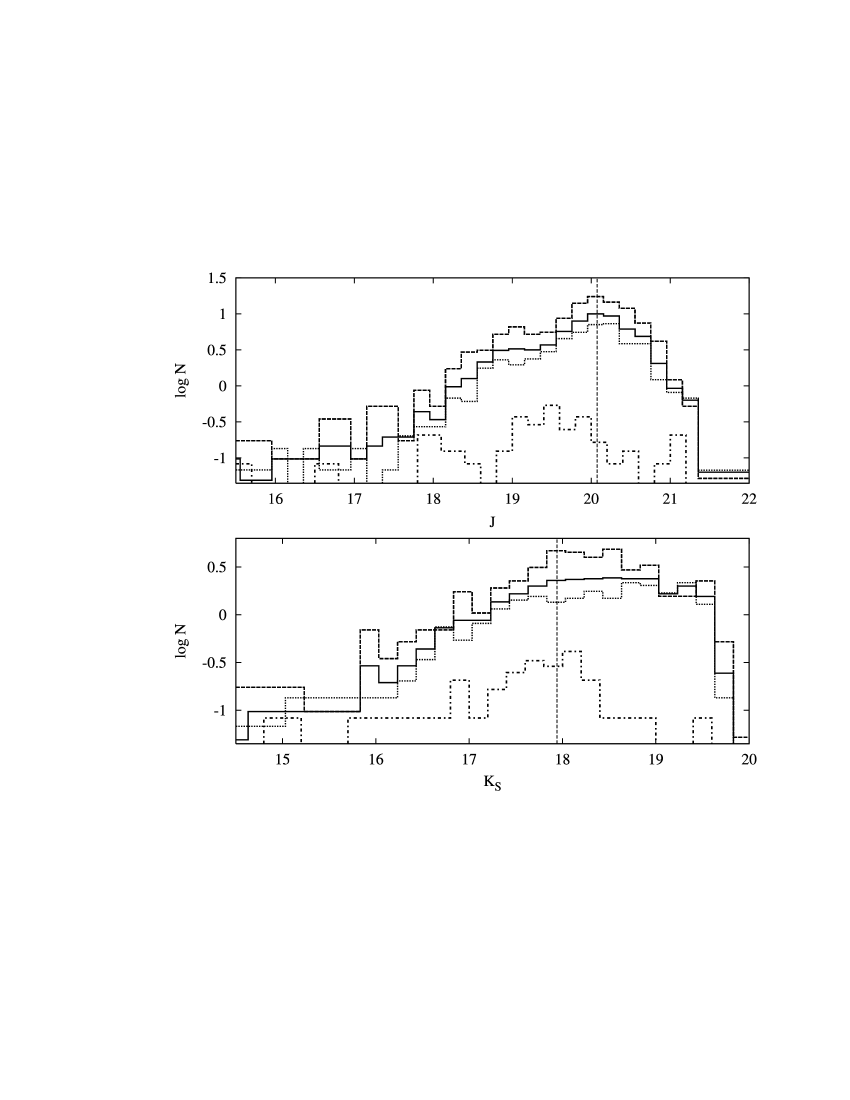
The luminosity functions in and are shown in Fig 3. The number of stars in each bin is normalized to 1 square arcmin. We tested the completeness limits variations across the galaxy by splitting the field into an “inner” part, containing the area with maximum Hi column densities and an “outer” part, respectively 5.76 and 14.77 square arcmin (see Fig 1). The crowding effects are limited to mag. We adopted 20.1 mag and 17.9 mag. For comparison the luminosity function of ”clear sky” is also shown in Fig 3. On average the LF is nearly an order lower then the galaxy one.
3 Color-Magnitude Diagram
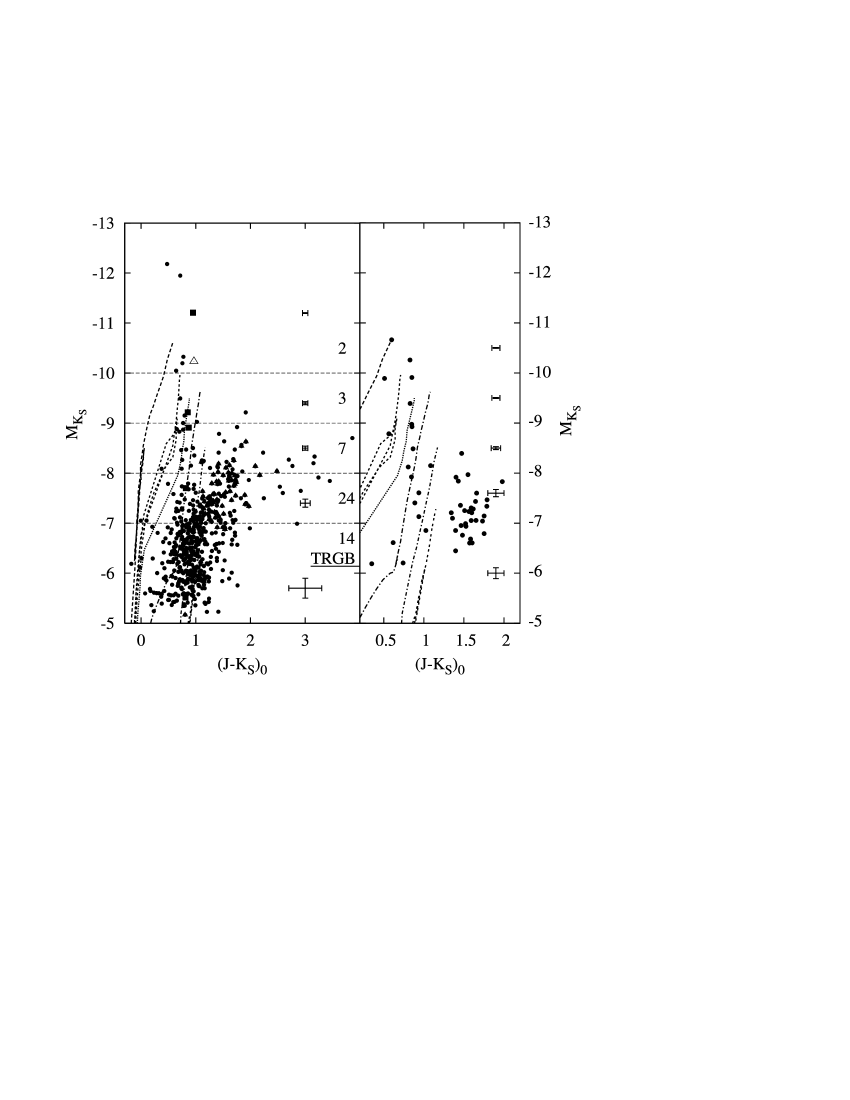
The color-magnitude diagram of WLM is shown in Fig. 4 (top panel). We used distance modulus (mM)0=24.85 mag – an average of the estimates of: (i) Minniti & Zijlstra (min97 (1997)) who derived (mM)0=24.750.1 mag from the -magnitude of the red giant branch (hereafter RGB) tip and (ii) Rejkuba et al. (rej00 (2000)) who obtained (mM)0=24.950.13 mag from -band photometry of the horizontal branch. These two values agree within the errors and they are derived from different methods and data sets. Corrections for the Galactic extinction were made using E()=0.037 mag (Schlegel et al. schleg98 (1998)). Here and throughout the paper we use the extinction law of Rieke & Lebofsky (rieke85 (1985)).
For the high Galactic latitude of WLM (b= –) we expect the foreground contamination to be negligible. This is confirmed from the number of stars found under similar observational conditions in our ”clear sky”, which is just 9% of all stars in the galaxy field. Color-magnitude diagram was construct using the same distance modulus and Galactic extinction and is shown in Fig. 4 (right panel). In such way a true estimation of the Galaxy contamination can be made by counting the stars in 1 magnitude bins in . The numbers are given in the right on the Fig. 4 (left panel).
The comparison with isochrones of Bertelli et al. (ber94 (1994)) indicate that the majority of the stars are 1-10 Gyr old, with a significant population of AGB and Carbon stars with ()01 mag. Only a handful of blue stars with ()01 mag and 8 mag are detected. We also identified on our images a number of variable stars from Sandage & Carlson (san85 (1985)) and Mora et al. (in preparation ).
The RGB properties versus metallicity calibrations of Ivanov & Borissova (iva02 (2002)) predict that the RGB tip for the WLM metallicity is located at 6.14 mag. Unfortunately, the incompleteness of the photometry in this magnitude range prevents us from analysis of the RGB properties.
4 Carbon stars identification and C/M ratio in the WLM
WLM is unusually rich of Carbon star, along with two other dwarf galaxies – IC 1613 and NGC 6822 – according to Cook et al. (cook86 (1986)). Recently, Battinelli & Demers (bat04 (2004)) surveyed WLM using narrow band CN-TiO filters and identified 149 Carbon stars and practically no M-type AGB stars (77 identified Carbon stars in our field are marked in Tabl. 1 with BD04). They also found an extremely high C/M ratio of WLM: 12.43.7.
The IR photometry allows us to carry out an independent census of the Carbon stars, following the method applied on the Magellanic Clouds (Cioni & Habing cio03 (2003)), NGC 6822 (Cioni & Habing cio05 (2005), Kang et al. kang06 (2006)), NGC 185 (Kang et al. kang05 (2005)) and NGC 147 (Sohn et al. sohn06 (2006)). It is found that the color distribution of all AGB stars have a well pronounced discontinuity at some point, M-type stars have a peak follow by a red tail of Carbon stars. We separated the Carbon rich from the Oxygen rich stars using the color distribution of the stars above the RGB tip (Fig. 6, the inset) and found color limit at ()0=1.20 mag. A similar dereddened limit was found by Cioni & Habing (cio05 (2005)) for NGC 6822 and Sohn et al. (sohn06 (2006)) for NGC 147: ()0=1.24 and ()0=1.28, respectively.

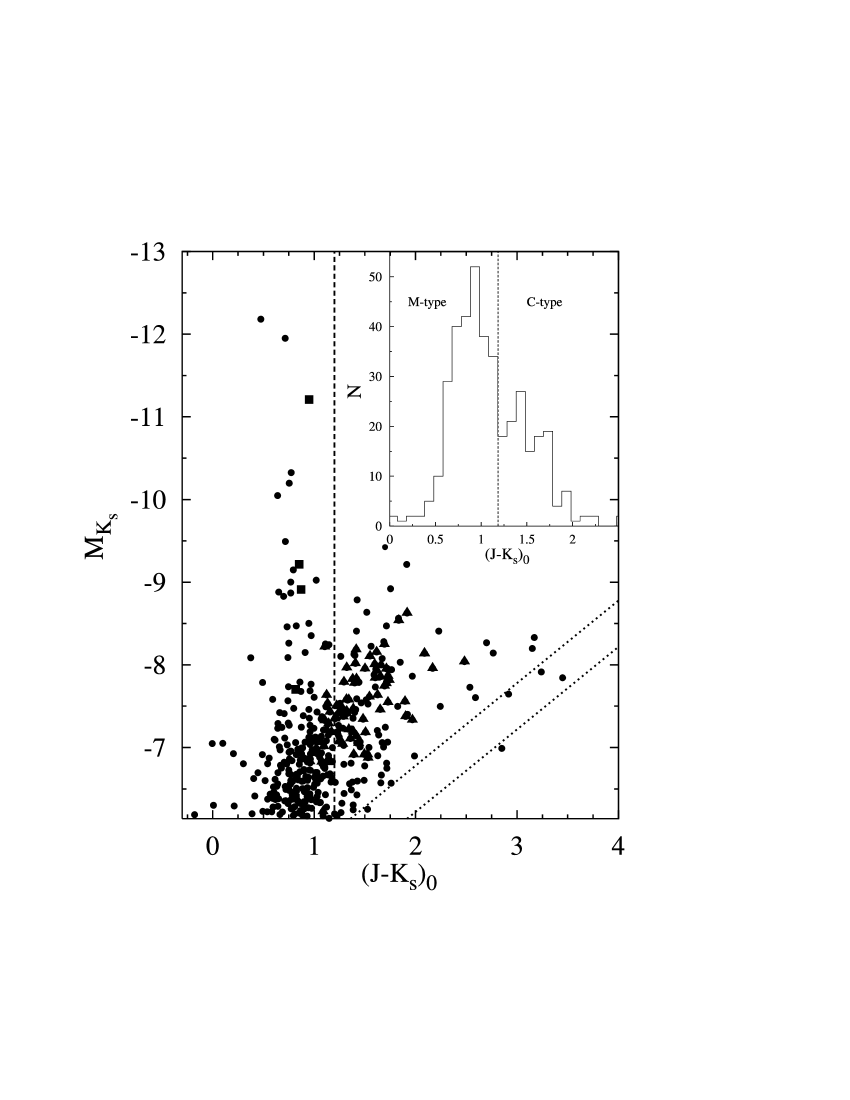
Integrating over the two parts of the histogram we obtain 146 Carbon stars and 259 M stars. The latter number includes all stars with spectral types M0 and later (M0, M1, M2 etc.) which sometimes is designated as M0+. Using the same criteria on the “clear sky” field we obtain 31 C stars and 19 M stars as all of them are above the RGB tip. Taking into account the latter numbers this will reduce our C stars to 115 and the M star to 240.
The luminosity functions for our Carbon star sample and for the 77 cross-identified Carbon stars (shown in Fig. 6 with solid triangles) from Battinelli & Demers (bat04 (2004)) are shown in Fig. 5. To eliminate the binning effects we created for each data set two luminosity functions shifting the bin centers by half of the bin width and averaged them. We fitted the luminosity function with a Gaussian, in two iterations, excluding the values that deviated more than 3. The final fits have mean of =17.35 mag, =0.71 mag for our sample and =17.33 mag, =0.51 mag for the 77 Carbon stars from Battinelli & Demers (bat04 (2004)) which corresponds to = mag and =7.53 mag, respectively.
Previous studies in some LG galaxies in the near IR lead to identical mean absolute K magnitude of the C stars: =7.930.36 mag (Kang et al. kang05 (2005)), =7.560.47 mag (Sohn et al. sohn06 (2006)) and =7.600.50 mag (Kang et al. kang06 (2006)) for NGC 185, NGC 147 and NGC 6822, respectively. in WLM is comparable with these values in 1 level and support this assumption. The sample of galaxies include dwarf irregulars and dwarf ellipticals but is not representative for wide range of metallicity and a possible influence over the mean absolute K magnitude can not be entirely excluded.
Next, we derived a C/M ratio of 0.560.12 (foreground corrected ratio 0.48), using the Carbon and M-type stars we identified above the RGB tip. However, Cioni & Habing (cio05 (2005)) pointed that this classification method omits the early type Carbon stars that might be bluer than the adopted color limit. The incompleteness due to this effect can be estimated by comparison of our Carbon star list and that of Battinelli & Demers (bat04 (2004)) – it yielded additional 15 Carbon stars among the M stars, bringing the C/M ratio up to 0.660.11 (0.58). The difference between the two values is small, considering the Poisson uncertainties given here.
Both values obtained here are smaller by a factor of 20 than the result of Battinelli & Demers (bat04 (2004)): C/M0+12.4. The large difference is due to the presence of M-type AGB population, which is almost entirely absent in Battinelli & Demers (bat04 (2004)) survey of WLM. We can only speculate that this difference is related to the narrow band filter centered at TiO absorption feature – prominent for spectral types later than M3. Their method probably omits early M type stars. Furthermore, the low metallicity of WLM diminishes additionally the TiO feature strenght and makes the detection of M type stars more difficult.
5 Spatial distribution of the stellar populations
Our data cover most of the main body of WLM, allowing us to study the spatial distribution of stellar populations. We created 2-dimensional histograms (Fig. 7) with 22.522.5 arcsec2 bins, corresponding to linear scale of 100100 pc at the distance of the galaxy. The distributions were smoothed by a box car function of width 2.
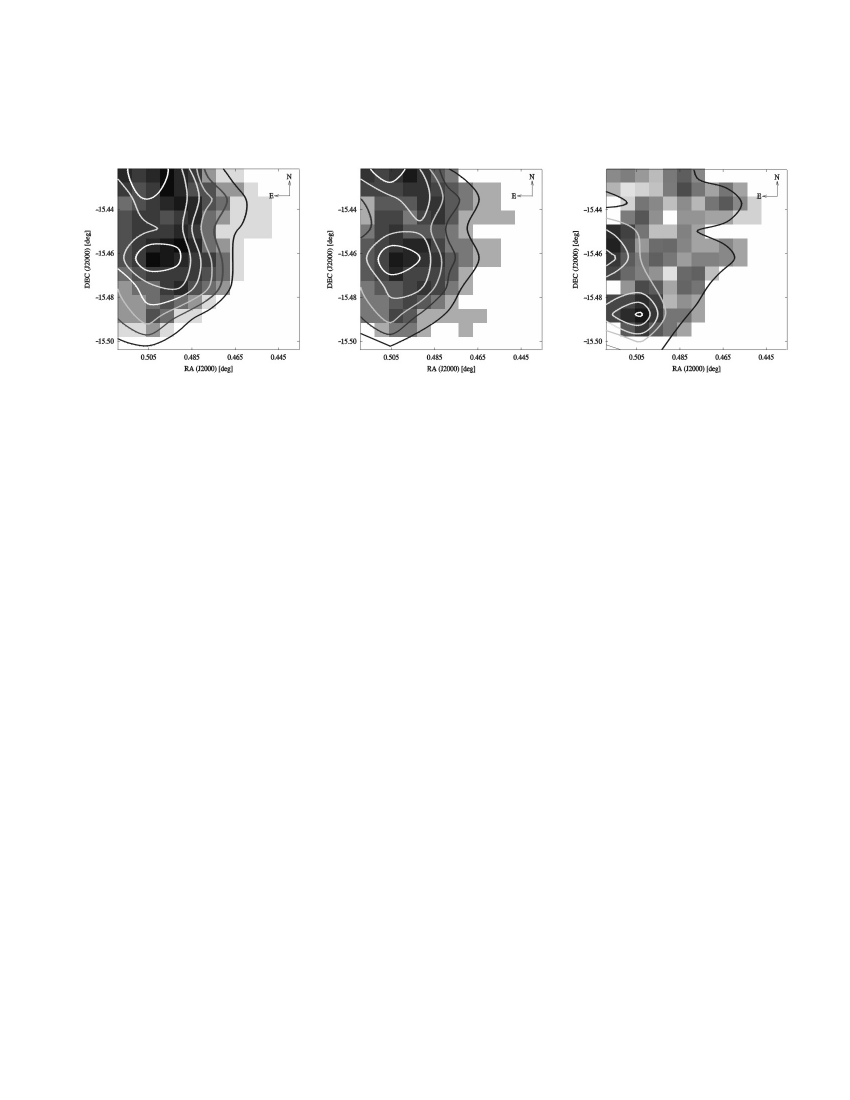
The histograms indicate no major difference between the stellar distributions. There are two peaks, corresponding to complexes with typical sizes of a few hundred parsecs. The C/M ratio exhibits a more complicated behavior – the peak is slightly offset from the peak of the stellar distributions. Further studies are necessary to verify if this reflects a real metallicity or an age gradient across the galaxy.
6 Miscellaneous
6.1 Cepheid distance to WLM in the near-IR
We identified 5 Cepheids from the list of Sandage & Carlson (san85 (1985)) on our -band image (the image is too shallow to detect them). We derived a distance to WLM adopting the period-luminosity relation of Gieren, Fouque & Gomez (gie98 (1998)):
| (5) |
where is the absolute -band magnitude of the Cepheids and P is the period in days.
The distances to individual Cepheids are listed in Tabl. 2. We removed the Milky Way extinction using =0.033 mag. To correct for the internal extinction towards individual Cepheids we used the Hi map of Jackson et al. (jac04 (2004)). The hydrogen surface densities were converted into extinction assuming gas-to-dust ratio N(Hi)/E()=6010.0 [1021 at. cm-2 mag-1]. This value is an extrapolation based on a linear least squares fit (Fig. 8) of the gas-to-dust ratio versus log(O/H)+12:
| (6) |
with r.m.s.=2.

This relation is based on gas-to-dust ratio estimates for: the solar neighborhood (Bohlin et al. bohl78 (1978); marked MW in Fig. 8), the M 31 outskirts (Cuillandre et al. cul01 (2001); M 31o), LMC (Junkkarinen et al. junk04 (2004); LMC) and SMC (Jakobsson et al. jak04 (2004); SMC). The abundances are taken from Russell & Dopita (rus90 (1990)) for LMC and SMC. In case of the Milky Way we used the Galactic metallicity gradient from Esteban et al. (est05 (2005)), and for M 31 – the metallicity gradient of Smartt et al. (sma01 (2001)). Note that this is a preliminary calibration, based on a limited number of measurements. More gas-to-dust ratios are necessary to derive a reliable relation.
Finally, we assumed that the Cepheids are located on the WLM mid-plane and therefore, the extinctions are due only to half of the total hydrogen column densities. The extinction intrinsic to WLM does not exceed 0.015 mag, due to the high gas-to-dust ratio of the galaxy.
Rejecting the outlier No. 66 (see Table 2), we obtain a median distance modulus of (mM)0=24.840.14 mag. We tentatively assume that the error is given by the maximum deviation. In addition, there are systematic errors of 0.03 mag for the zero-point of the period-luminosity relation (Equ. 5), and 0.02 mag for the LMC distance adopted in Gieren et al. (gie98 (1998)).
| No | Period, days | (mM)J | (mM)0 | |||
|---|---|---|---|---|---|---|
| 7 | 20.108 (0.155) | 7.6712 | -4.880 | 24.988 | 0.048 | 24.940 |
| 8 | 20.016 (0.150) | 7.3754 | -4.827 | 24.843 | 0.047 | 24.796 |
| 21 | 19.829 (0.124) | 9.33306 | -5.146 | 24.975 | 0.044 | 24.931 |
| 48 | 19.724 (0.160) | 8.53000 | -5.024 | 24.748 | 0.048 | 24.700 |
| 66 | 20.197 (0.189) | 4.54714 | -4.170 | 24.367 | 0.040 | 24.327 |
6.2 Variable stars in WLM
6.3 Structural parameters of WLM
Structural parameters of galaxies are determined more reliably from IR images rather than optical ones because the effects of the intrinsic extinction are diminished. Our images do not encompass the entire galaxy but nevertheless we are able to determine approximately the scale length along the major axis. To do that we averaged the pixel values in a 63.4-arcsec wide strip (300 pc at the distance of WLM), crossing the center of the galaxy in North-South direction. We used the -band image because of the higher signal-to-noise ratio. The average flux values along the semi-major axis are shown in Fig. 9. An exponential law fit over the central 1 kpc region of WLM yielded a scale length of 0.750.14 kpc, similar to the scale length of 0.9 kpc determined by Fisher & Tully (fish75 (1975)). The inset in Fig. 9 shows histograms of the scale lengths for dwarf galaxies in the Local Group from the compilation of Mateo (mat98 (1998)).

The bright – and younger – stars in the galaxy are resolved on our images, but the fainter – and older ones – not. We addressed the question if there is a different scale length for different stellar populations by excluding the bright stars from this analysis: we averaged the -band image with a 6161 pixel median filter, effectively removing the resolved stars. The derived scale length for “older” population was 0.710.04 kpc, again for the central 1 kpc of the galaxy. Our estimates have to be treated with caution because the strip is not perfectly aligned along the major axis.
7 Discussion and summary
This work adds another object to the list of galaxies with homogeneously determined C/M0+ ratios from near-IR photometry: LMC, SMC, NGC 6822, NGC 147, NGC 185 and now the WLM. This is an opportunity for independent check of the results from narrow band Carbon star surveys. The number of data points is still limited and did not allow us to test if using only C/M ratios derived from IR observations can reduce the spread of the relation but this is the objective of our further studies. We obtained for the WLM a C/M ratio of 0.60.1 and a peak of the Carbon stars luminosity function of =7.51 mag.
To measure the intrinsic reddening in WLM we used the Hi map of WLM (Jackson et al. (jac04 (2004)), and we adopted a linear dependence of the gas-to-dust ratio on the metallicity: N(Hi)/E()=(585)[log(O/H)+12]+(51744). The gas-to-dust ratio for the WLM is 6010 [1021 at. cm-2 mag-1]. This allows us to measure the extinction along the line of sight towards individual Cepheids and by period-luminosity relation for the Cepheids (Gieren gie98 (1998)) in the IR we determined the distance to the WLM – (mM)0=24.840.14 mag, similar to the previous estimates. To probe the significance of used PL relation we re-determined the distance modulus using the PL relation calibrated by Testa et al. (testa06 (2006)) for the Cepheids in two LMC young clusters. This results in distance modulus between 24.76 and 25.00, depending on the assumed pulsation models. Finally, we fitted the surface brightness distribution along the main axis of WLM with an exponential low yielding a scale length of 0.750.14 kpc, typical value for the dwarf irregular galaxies.
Acknowledgements.
This work obtained a limited support by the grants F-1302/03 and VU-F-201/06 of the Bulgarian Scientific Foundation. Also, this publication makes use of data products from the Two Micron All Sky Survey, which is a joint project of the University of Massachusetts and the IR Processing and Analysis Center/California Institute of Technology, funded by the National Aeronautics and Space Administration and the National Science Foundation. This research has made use of the SIMBAD database, operated at CDS, Strasbourg, France. The authors thank Dr. M.-R. Cioni for the useful comments and the anonymous referee for the help in improving the article.References
- (1) Ables, H.D. & Ables, P.G. 1977, ApJS, 34, 245
- (2) Albert, L., Demers, S., Kunkel, W.E. 2000, ApJ, 119, 2780
- (3) Battinelli, P & Demers, S. 2004, A&A, 416, 111
- (4) Battinelli, P & Demers, S. 2005, A&A, 434, 657
- (5) Bertelli, G., Bressan, A., Chiosi, C., Fagotto, F., & Nasi, E. 1994, A&AS, 106, 275
- (6) Bohlin, R., Savage, B., Drake, J. 1978, ApJ, 224, 132
- (7) Cioni, M.-R. L. & Habing, H.J. 2003, A&A, 402, 133
- (8) Cioni, M.-R. L. & Habing, H.J. 2005, A&A, 429, 837
- (9) Cook, K.H., Aaronson, M., & Norris, J. 1986, ApJ, 305, 634
- (10) Cuillandre, J., Lequeux, J., Allen, R.J., Mellier, Y., Bertin, E. 2001, ApJ, 554, 190
- (11) Dolphin, A.E. 2000, ApJ, 531, 804
- (12) Esteban, C., García-Rojas, J., Peimbert, M., Peimbert, A., Ruiz, M.T., Rodrígues, M. & Carigi, L. 2005, ApJS, 618, 95
- (13) Ferraro, F.R., Fusi Pecci, F., Tosi, M., Buonanno, R. 1989, MNRAS, 241, 433
- (14) Fisher, J.R. & Tully, R.B. 1975, A&A, 44, 151
- (15) Gieren, W.P., Fouque, P., Gomez, M. 1998, ApJ, 496, 17
- (16) Groenewegen, M.A.T. 2006, pnbm.conf., 108
- (17) Hodge, P.W., Dolphin, A.E., Smith, R.T., & Mateo, M. 1999, ApJ, 521, 577
- (18) Iben, I. & Renzini, A. 1983, ARA&A, 21, 271
- (19) Ivanov, V.D., & Borissova, J. 2002, 390, 937
- (20) Jackson, D.C., Skillman, E.D., Cannon, J.M., Côté, S. 2004, AJ, 128, 1219
- (21) Jakobsson, P. et al. 2004, A&A, 427, 785
- (22) Junkkarinen, V., Cohen, R., Ross, D., Beaver, E.A, Burbidge, E.M., Lyons, R., Madejski, G. 2004, ApJ, 614, 658
- (23) Lee, H., Skillman, E.D., & Venn, K.A. 2005, ApJ, 620, 223
- (24) Kang, A., Sohn, Y.-J., Rhee, J., Shin, M., Chun, M.-S., Kim, Ho-Il, 2005, A&A, 437, 61
- (25) Kang, A., Sohn, Y.-J., Kim, H.-I., Rhee, J., Kim, J.-W., Hwang, N., Lee, M.G., Kim, Y.-C., Chun, M.-S. 2006, A&A, 454, 727
- (26) Mateo, M. 1998, ARA&A, 36, 435
- (27) Melotte, P.J. 1926, MNRAS, 86, 636
- (28) Minniti, D. & Zijlstra, A.A. 1997, AJ, 114, 147
- (29) Mora, M., Minniti, D., Catelan, M., Zijlstra, A., & Rejkuba, M. (in preparation) A&A
- (30) Rejkuba, M., Minniti, D., Gregg, M.D., Zijlstra, A.A., Alonso M.V., & Goudfrooij, P. 2000 ApJ, 120, 801
- (31) Rieke, G.M., & Lebofsky, M.J. 1985, ApJ, 288, 618
- (32) Russell, S.C. & Dopita, M.A. 1990, ApJS, 74, 93
- (33) Sandage, A., & Carlson, G. 1985, AJ, 90, 1464
- (34) Scalo. J.M. & Miller, G.E. 1981, ApJ, 248, L65
- (35) Schlegel, D.J., Frankbeiner, D.P., Davis, M., 1998, ApJ, 500, 525
- (36) Smartt, S., Crowther, P., Dufton, P., Lennon, D., Kudritzky, R., Herrero, A., McCarthy, J., Bresolin, F. 2001, MNRAS, 325, 257
- (37) Sohn, Y.-J., Kang, A., Rhee, J., Shin, M., Chun, M.-S., Kim, Ho-Il 2006, ApJ, 445, 69
- (38) Testa, V., Ferraro, F. R., Ripepi, V., Musella, I., DallÓra, M., Mucciarelli, A., Marconi, M., Mateo, M. 2006, MmSAI, 77, 263
- (39) Venn, K.A., Tolstoy, E., Kaufer, A., Skillman, E.D., Clarkson, S.M., Smartt, S.J., Lennon, D.J., & Kudritzki, R.P. 2003, AJ, 126, 1326
- (40) Wolf, M. 1909, Astron. Nachr, 183, 187