The Spitzer c2d Survey of Large, Nearby, Interstellar
Clouds:
VI. Perseus Observed with MIPS
Abstract
We present observations of 10.6 square degrees of the Perseus molecular cloud at 24, 70, and 160 m with the Spitzer Space Telescope Multiband Imaging Photometer for Spitzer (MIPS). The image mosaics show prominent, complex extended emission dominated by illuminating B stars on the East side of the cloud, and by cold filaments of 160 m emission on the West side.
Of 3950 point sources identified at 24 m, 1141 have 2MASS counterparts. A quarter of these populate regions of the vs. [24] diagram that are distinct from stellar photospheres and background galaxies, and thus are likely to be cloud members with infrared excess. Nearly half (46%) of these 24 m excess sources are distributed outside the IC 348 and NGC 1333 clusters. NGC 1333 shows the highest fraction of stars with flat or rising spectral energy distributions (28%), while Class II SEDs are most common in IC 348. These results are consistent with previous relative age determinations for the two clusters. A significant number of IRAS PSC objects are not recovered by Spitzer/MIPS, most often because the IRAS objects were confused by bright nebulosity. There is no evidence for 24 m source variability to 10% between the 3-6 hours of our two observation epochs.
The intercluster region contains several tightly clumped (0.1 pc) young stellar aggregates whose members exhibit a wide variety of infrared spectral energy distributions characteristic of different circumstellar environments. One possible explanation is a significant age spread among the aggregate members, such that some have had time to evolve more than others. Alternatively, if the aggregate members all formed at roughly the same time , then remarkably rapid circumstellar evolution would be required to account for the association of Class I and Class III sources at ages 1 Myr.
We highlight important results for the HH 211 flow, where the bowshocks are detected at both 24 and 70 m; and for the debris disk candidate BD +31643, where the MIPS data shows the linear nebulosity to be an unrelated interstellar feature. Our data, mosaics, and catalogs are available at the Spitzer Science Archive for use by interested members of the community.
1 Introduction
The Spitzer Space Telescope Legacy program “From Molecular Cores to Planet-Forming Disks” (c2d; Evans et al. 2003) selected five large star-forming clouds for mapping with the Infrared Array Camera (IRAC, 3.6, 4.5, 5.8, and 8 m; Fazio et al. 2004) and the Multiband Imaging Photometer for Spitzer (MIPS, 24, 70, and 160 m; Rieke et al. 2004). These clouds were selected to be within 350 pc, to have a substantial mass of molecular gas, and to have a range of cloud properties, thereby allowing studies of star formation in isolation, in groups, and in clusters. The goals of this aspect of the c2d project (see Evans et al. 2003 for more information) include determining the stellar content of the clouds, the distributions of the youngest stars and substellar objects, and the properties of their disks and envelopes. All of these Spitzer cloud studies represent the first unbiased mid-infrared surveys across entire clouds at this sensitivity and spatial resolution, where in the past only targeted, small-field-of-view observations have been possible.
Perseus is one of five nearby star forming clouds mapped with IRAC and MIPS by c2d, also including Chamaeleon II, Lupus I, III & IV, Ophiuchus and Serpens (see Evans et al. 2003 for an overview). Previous papers in this series presented IRAC observations of Serpens (Harvey et al. 2006), Perseus (Jørgensen et al. 2006, hereafter J06) and Chamaeleon II (Porras et al. 2007) and MIPS observations of Chamaeleon II (Young et al. 2005) and Lupus I, III and IV (Chapman et al. 2007).
The Perseus molecular cloud is a source of active star formation with few high-mass stars, none earlier than early B. While nowhere near as chaotic as the Orion star forming region, it is also not as quiescent as the Taurus molecular cloud, and so provides an “intermediate” case study. IC 348 and NGC 1333 are the two densest and most famous star-forming clusters in this region, containing numerous stars 1-2 Myr old. Ongoing star formation is certainly occurring throughout the cloud, including in named regions such as L1448 and B5; there are deeply embedded Class 0 objects found outside the two major clusters (see, e.g., J06).
The Perseus cloud is large enough that different parts of it may be at significantly different distances; see the discussion in Enoch et al. (2006). Following that paper, and J06, we take the distance to Perseus to be 250 pc, though we acknowledge that there may indeed be a substantial distance gradient across the cloud, or there might even be multiple pieces located at several different distances.
The Perseus cloud is rich in both point sources and complex extended emission. IRAS observations revealed more than 200 apparent point sources and complex ISM structures, including a large ring thought to be an H II region, G159.618.5, excited by HD 278942 (Andersson et al. 2000). Ridge et al. (2006) argue that the ring is behind the main Perseus cloud. Hatchell et al. (2005) find via a survey at 850 and 450 m a high degree of point-source clustering and filamentary structures throughout the cloud. Enoch et al. (2006) also find strong point-source clustering in their 1.1 mm continuum survey. The Spitzer/IRAC study of Perseus by J06 concluded (a) that there are significant numbers of stars being formed outside of the two main clusters (IC 348 and NGC 1333); (b) the fraction of Class I, Class II, and “flat spectrum” young stellar objects (YSOs) differs between the two rich clusters and the extended cloud population; and (c) that deeply embedded Class 0 objects are detected, with very red [3.6][4.5] colors (but not similarly red [5.8][8] colors).
MIPS observations at 24 m ( resolution), 70 m ( resolution), and 160 m ( resolution) can elucidate many aspects of the ongoing star formation in Perseus. Although the emission from stellar photospheres is falling rapidly at 24 m, emission from circumstellar material makes many of the young cluster members still quite bright at 24 m, so MIPS finds the young stars easily. Emission from the cloud itself becomes increasingly prominent in the MIPS 24, 70, and 160 m bands, allowing dusty molecular material in the temperature range 120-20 K to be probed. MIPS reveals complex extended emission throughout the Perseus region at all three of its wavelengths.
This paper presents MIPS data covering more than 10.5 square degrees in Perseus. We also use information obtained from the IRAC data for Perseus from J06. As a result of observational constraints (see §2 below) the IRAC data cover only about one-third the area of the MIPS data (IRAC covers 3.86 square degrees), so we use the IRAC data where possible, but large areas of our map have no IRAC data at all.
The goals of this paper are to present the MIPS data in a format similar to that found in the other papers in the series, to discuss some of the high-level conclusions drawn from these data, and to highlight some of the interesting objects we have found. Because this paper is part of a series, there is synergy with both the papers that have gone before and those to come. Because the IRAC data, where they exist, are usually important for understanding the objects seen in the Perseus map, there are extensive references to J06; for example, SEDs for some objects discussed there were deferred to this paper for presentation. Similarly, there are references to future work throughout this paper. One such future paper will present a complete list of YSO candidates associated with Perseus using the combined IRAC and MIPS data, which is beyond the scope of this paper. As part of the c2d ancillary data, there has been a paper on the Bolocam 1.1 mm continuum survey of Perseus (Enoch et al. 2006) and one on the JCMT/SCUBA sub-mm maps from the COMPLETE team as compared to the Spitzer data (Jørgensen et al. 2006b).
This paper can be broadly divided into three major parts. First we give the details of the observations, reductions, and source extraction (§2). This is followed by a presentation of the ensemble MIPS results for the entire Perseus cloud (§3). Finally, §4 gives a focused discussion of noteworthy stellar aggregates and individual young stars. The main results of our study are summarized in §5.
2 Observations, Data Reduction, and Source Extraction
| field | map center | first epoch AORKEY | second epoch AORKEY |
|---|---|---|---|
| per1 | 3h47m05.0s,+32d38m23.0s | 5780992 | 5787648 |
| per2 | 3h44m30.7s,+32d06m08.1s | 5781248 | 5787904 |
| per3 | 3h42m34.5s,+31d55m33.0s | 5781504 | 5788160 |
| per4 | 3h40m39.0s,+31d37m53.0s | 5781760 | 5788416 |
| per5 | 3h37m42.0s,+31d16m41.0s | 5782016 | 5788672 |
| per6 | 3h33m34.0s,+31d08m57.0s | 5782272 | 5788928 |
| per7 | 3h31m10.6s,+30d51m12.0s | 5782528 | 5789184 |
| per8 | 3h29m10.0s,+31d11m00.0s | 5782784 | 5789440 |
| per9 | 3h30m54.0s,+30d00m48.0s | 5783040 | 5789696 |
| per10 | 3h28m26.0s,+30d39m55.0s | 5783296 | 5789952 |
| per11 | 3h26m11.0s,+30d32m03.0s | 5798656 | 5790208 |
2.1 Observations
The MIPS observations of Perseus were conducted on 18-20 Sep 2004 and covered 10.5 square degrees; they were designed to cover the =2 contour, which then by extension completely covered the c2d IRAC map of Perseus. The center of this large map is roughly at (J2000) = 3h37m, 311130, or galactic coordinates =160, 19.5, or ecliptic coordinates (J2000) 59.5, +11.5.
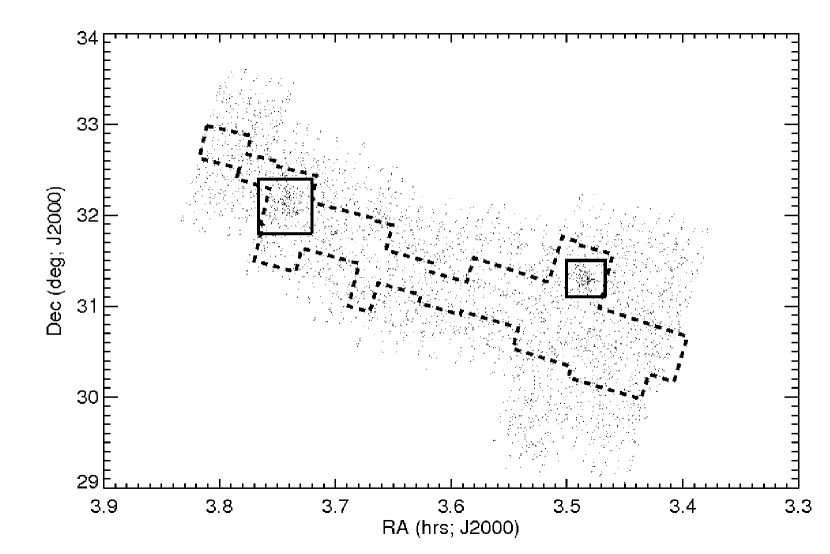
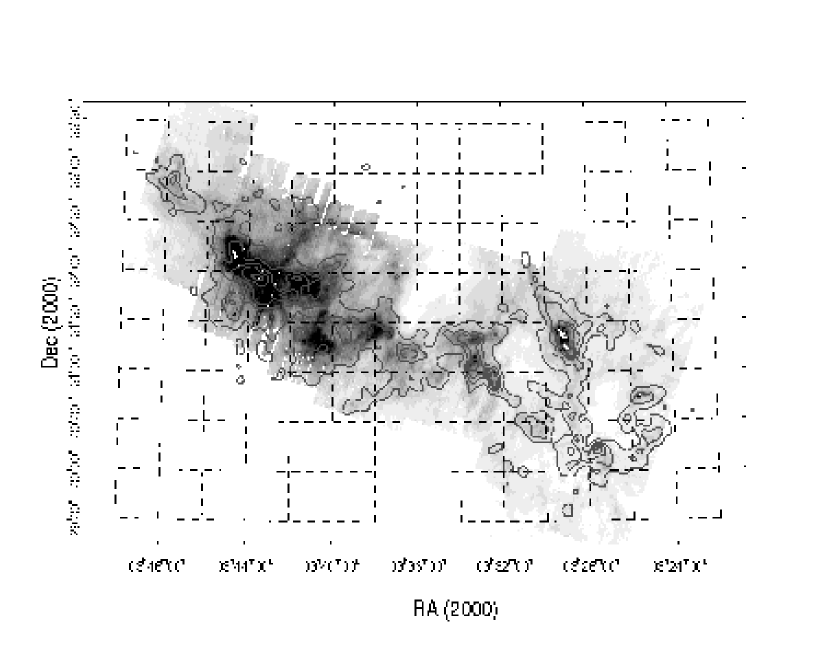
These observations were part of Spitzer program id 178; “AORKEYs” labeling the datasets in the Spitzer Archive are given in Table 1. Fast scan maps were obtained at two separate epochs. At each epoch, the spacing between adjacent scan legs was 240. The second epoch observation was offset 125 in the cross-scan direction from the first, to fill in the 70 m sky coverage which was incomplete at each individual epoch. Furthermore, the second epoch scan was also offset 80 from the first along the scan direction, to maximize 160 m map coverage in the combined epoch mosaic. These mapping parameters resulted in every part of the map being imaged at two epochs at 24 m and only one epoch at 70 and 160 m, with total integration times of 30 sec, 15 sec, and 3 sec at each point in the map (respectively). The 160 m maps have some coverage gaps, and suffer from saturation (particularly in NGC 1333 and IC 348). Figure 1 shows the region of 3-band coverage with MIPS, and the 4-band coverage with IRAC. At about 10.5 square degrees, the MIPS observations cover a much larger area than the IRAC observations, which cover only 4 square degrees. The three main reasons for this apparent mismatch are entirely instrumental: (1) we are constrained by the ecliptic latitude to observe with scan legs in a particular orientation (the maximum rotation is about 10), (2) we are limited in the available choices for scan leg lengths, and (3) MIPS covers large areas very efficiently, so we can easily cover large areas with MIPS in much less time than for IRAC.
The c2d MIPS observations were designed for even coverage (all to the same exposure time depth), independent of the GTO observations of IC 348 (Lada et al. 2006) and NGC 1333 (R. Gutermuth et al. in prep.). The GTO observations of these regions are not included in the discussion here, primarily to enable discussion of a catalog obtained to uniform survey depth. This is different from the c2d IRAC observations of Perseus discussed in J06, where the GTO observations provided the images for one of the two epochs.
The two observation epochs were separated by 3 to 6 hrs to permit asteroid removal in this relatively low ecliptic latitude (+11–12) field. Indeed, by comparing the 24 m maps obtained at the two epochs, at least 100 asteroids are easily visible, ranging in flux density from at least as faint as 0.6 to as bright as 30 mJy. Some asteroids are clearly visible even at 70 m. The asteroids in this and other c2d cloud maps will be discussed further in K. Stapelfeldt et al., in preparation.
We started with the SSC-pipeline-produced basic calibrated data (BCDs), version S11.4. For a description of the pipeline, see Gordon et al. (2005). As in Chapman et al. (2006), each MIPS channel was then processed differently and therefore is discussed separately below. Mosaics and source catalogs from these data were delivered back to the SSC for distribution; see http://ssc.spitzer.caltech.edu/legacy/ for additional information. Multiple deliveries were made; the data discussed here were part of the 2005 data delivery.
Figures 2, 3, and 4 show the individual mosaics by channel, and 5 shows a 3-color image with all three channels included. (For an indication of where “famous” regions are, please see Fig. 16, which indicates several objects highlighted for discussion below.) There is substantial extended emission in all three MIPS channels throughout the MIPS maps. In the 70 and 160 m channels, the MIPS instrument uses internal stimulator flashes to calibrate the data (for more information, see the Spitzer Observer’s Manual, available at the SSC website111http://ssc.spitzer.caltech.edu/). For most of a scan leg, the correct calibration can be obtained via an interpolation. On the ends of scan legs, it necessarily must use extrapolation solutions. When the ends of the scan legs run across particularly bright emission, as they do in some cases here (particularly in the “ring” of bright emission), the absolute calibration is not as good as it is in darker regions. Fluxes obtained in these regions have larger errors than the rest of the map.
The IC 348 and NGC 1333 regions are encompassed by the overall Perseus cloud map dataset. To explore difference between the memership of these two clusters and the more broadly distributed Perseus young stellar population, we have chosen to consider the IC 348 and NGC 1333 stellar populations separately from the rest of the cloud; see Figure 1. We have defined the regions belonging to the clusters based on the surface density of 24 m sources. The region we define to be IC 348 is given by a box bounded by the coordinates =55.8 to 56.5 (3.720h to 3.767h, or 03h43m12.0s to 03h46m00.0s), =31.8 to 32.4 (or +314800.0 to +322400.0). This region is larger than what has historically been assumed to encompass the cluster, and large enough (0.36 square degrees) to include the 300 likely cluster members (with the new likely members) found by Lada et al. (2006), but not so large that it includes substantial numbers of likely field members. (Note that this box includes most of the new members found by Cambresy et al. 2006, but does not include their farthest southwest part of the cluster.) The region we define to be NGC 1333 is given by a box bounded by the coordinates =52 to 52.5 (3.467h to 3.500h, or 03h28m00.0s to 03h30m00.0s), =31.1 to 31.5 (or +310600.0 to +313000); this region is 0.17 square degrees. In both cases, for ease of comparison, these regions are the same as those used in J06.
2.2 MIPS-24
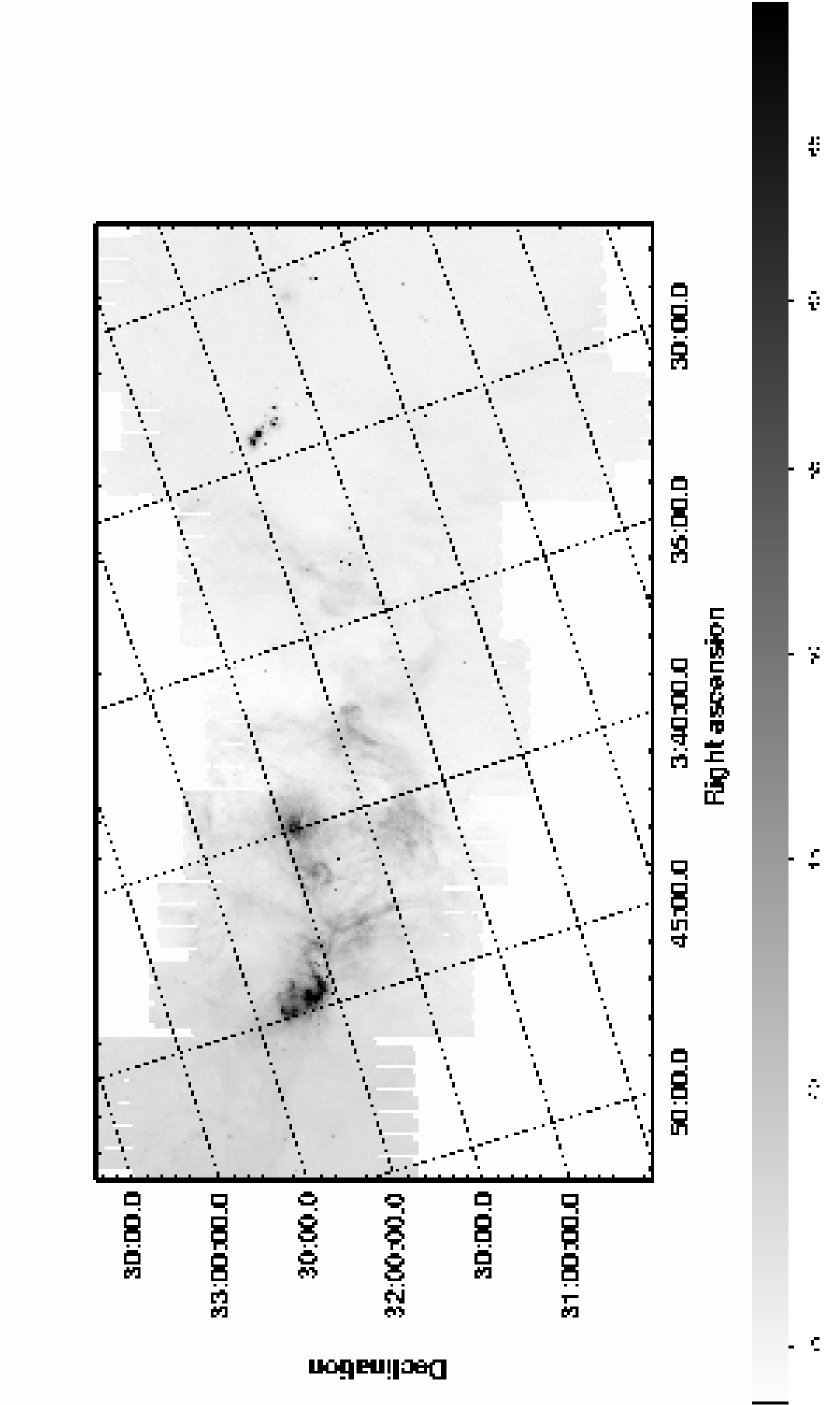
As discussed in Chapman et al. (2006), standard c2d pipeline processing on the S11 BCDs (2005 delivery) was used for MIPS-24 (Evans et al. 2005; see also Young et al. 2005). In summary, the c2d reduction starts with the pipeline-produced BCDs, and then further processes them to remove artifacts, e.g., “jailbars” near bright sources. A mosaic was then constructed from the entire data set using the SSC MOPEX software (Makovoz & Marleau 2005); see Figure 2. Sources were extracted from the mosaic and bandmerged into the catalog along with 2MASS (Skrutskie et al. 2006) and IRAC-1,2,3,4 measurements. For more details on this process, please see Chapman et al. (2006). The uncertainty on the flux densities derived at 24 m is estimated to be 15%.
The high-quality catalog we assembled consisted of all detections at MIPS-24 from the last 2005 delivery where the c2d catalog detection quality flag (see the 2005 c2d Delivery Document, available online linked from http://ssc.spitzer.caltech.edu/legacy/) was ‘A’ or ‘B,’ which translates to a signal-to-noise ratio of 5, and where the object was detected at both epochs. While resulting in a shallower survey than would be possible using other combinations of flags, this ensures that no asteroids are included in the catalog. The extraction pipeline flags some objects as extended (“imtype” flag); no filter was imposed on these extended objects to create the catalog we used, but only 8 of the objects in our catalog are flagged as extended.
There were 3950 total point sources detected at 24 m meeting our criteria, ranging from 0.603 to 3530 mJy (comparable to the saturation limit; see below). The source surface density is about 370 sources per square degree. The zero point used to convert these flux densities to magnitudes was 7.14 Jy, based on the extrapolation from the Vega spectrum as published in the MIPS Data Handbook. About 30% of these objects had identifiable 2MASS counterparts at .
The faint limit of the catalog of 24 m sources is a function of the nebular brightness across the field, but what might be less obvious is that the saturation limit for point sources with MIPS-24 is also a function of location in the cloud because the total flux density registered by the detector is that due to the point source itself plus any surrounding extended nebular emission. Because the extended emission at 24 m varies from 450 MJy sr-1 in IC 348 to 100 MJy sr-1 in NGC 1333 to 1 MJy sr-1 in the darker parts of the cloud, the completeness of the 24 m catalog at both the bright and faint limits is a function of location in the cloud. For example, as will be seen in the source counts discussion (§3.1), there are fewer faint sources in the clusters than in the field, and fewer bright sources in NGC 1333 than in IC 348. This may indeed be entirely due to the brightness of the background. An additional issue when considering completeness is the resolution; the resolution of MIPS-24 (, 2.55 pixel size) is poorer than IRAC or 2MASS (). Source multiplicity and confusion may also affect the completeness of the catalog, particularly in dense regions such as the clusters.
2.3 MIPS-70
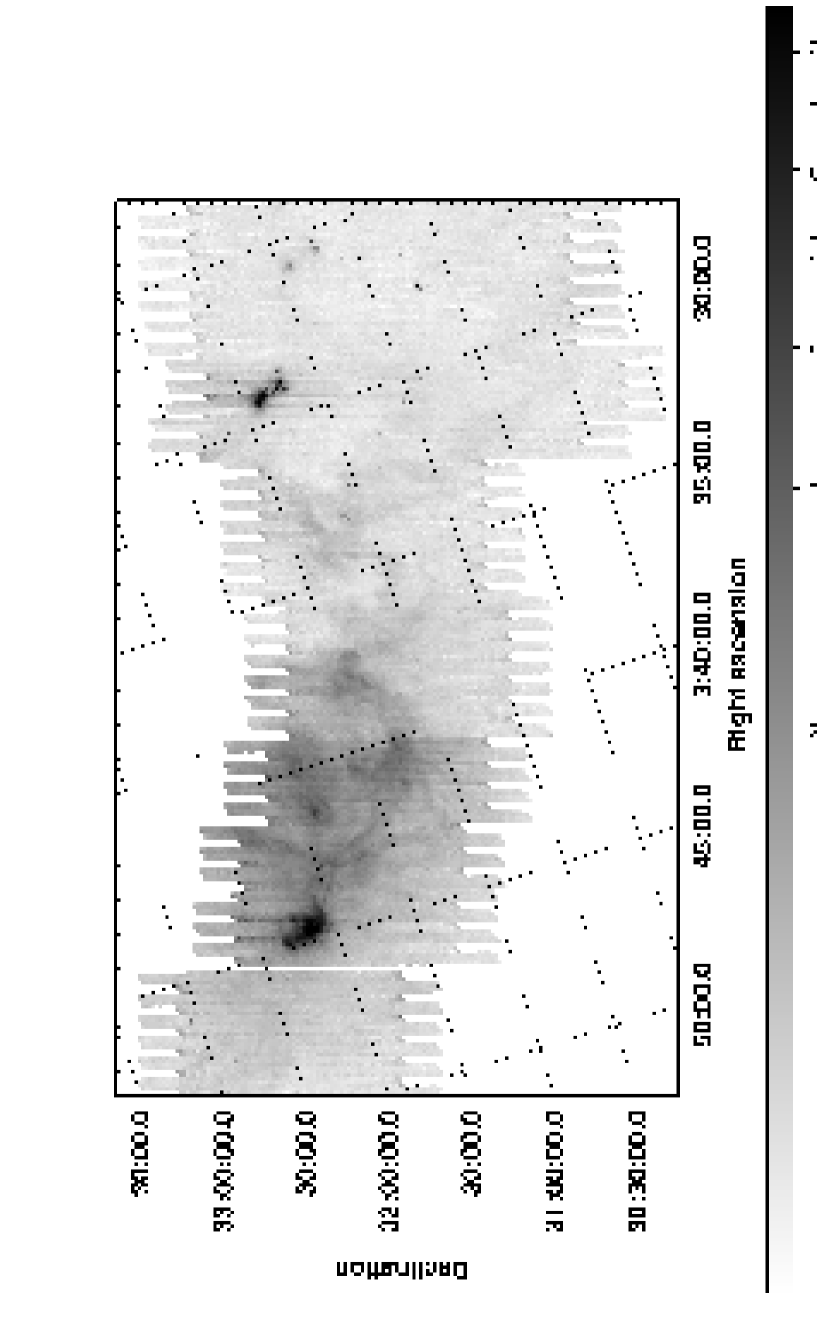
To reduce the MIPS-70 data, we started with the automated pipeline-produced BCDs. The SSC produces two sets of BCDs; one is simply calibrated, and the other has spatial and temporal filters applied that attempt to remove instrumental signatures in an automated fashion. These filtered BCDs do not conserve flux for extended emission, nor for bright point sources, but they do conserve flux for the fainter point sources. We started with both the filtered and unfiltered S11 BCD products. Then, we mosaicked these individual BCDs into one filtered and one unfiltered mosaic using the MOPEX software. We resampled the pixels to be 4 square (smaller than the native pixel scale of ) to better enable source extraction. The unfiltered mosaic is presented in Figure 3 to better show the extended emission.
We defined the point response function (PRF) from clean and bright point sources selected from this large mosaic, and then using this, performed point source detection and extraction using the APEX-1 frame option of MOPEX. The initially-produced source list was cleaned for instrumental artifacts via manual inspection of the 70 m image and comparison to the 24 m image; e.g., if there was some question as to whether a faint object seen at 70 m was real or an instrumental artifact, and comparison to the 24 m image revealed a 24 m source, then the 70 m object was retained as a real source. This catalog also has the same limitations as was found at 24 m; the brightness of the nebulosity drowns out the faintest objects in the clusters, and contributes to saturation of the brightest point-source objects (particularly in the clusters) as well. And, the resolution at 70 m () is coarser than it is at 24 m (), which complicates source matching to and source extraction in confused regions such as the clusters. For all of these reasons, the 70 m catalog is not necessarily complete and unbiased, particularly in the regions of bright ISM and/or the faintest end.
Based on a comparison of PRF and aperture photometry fluxes, we empirically determined the limit between where PRF fitting photometry on the filtered image was more appropriate (fainter than mJy), and where aperture photometry with an aperture radius of 32 on the unfiltered image was more appropriate (brighter than this level). There were 19 objects brighter than mJy, for which we used aperture photometry with a 32 aperture and a 17% aperture correction. The estimated uncertainty on our point source fluxes is 20%. No color corrections were applied. Sources that were determined by APEX to be extended were not fitted, so sources that appear at initial manual inspection to be point-like but are actually resolved in the 70 m maps do not appear in our catalog.
There were 139 total point sources detected at 70 m, ranging from 64 mJy222An A0 photosphere with a 70 m flux density of this value would have 2.9 mag. to 97 Jy333Although the instrument’s published saturation limits are about half of this value, some useful information can still be extracted from the first few reads of the BCDs. Note that the measured value of the flux of this bright object prior to the aperture correction is 80 Jy. This value may not necessarily be well-calibrated, as it is indeed quite bright.; the surface density is about 13 sources per square degree. About 90% of the 70 m objects had identifiable counterparts at 24 m. The zero point used to convert the flux densities to magnitudes was 0.775 Jy, based on the extrapolation from the Vega spectrum as published in the MIPS Data Handbook.
2.4 MIPS-160
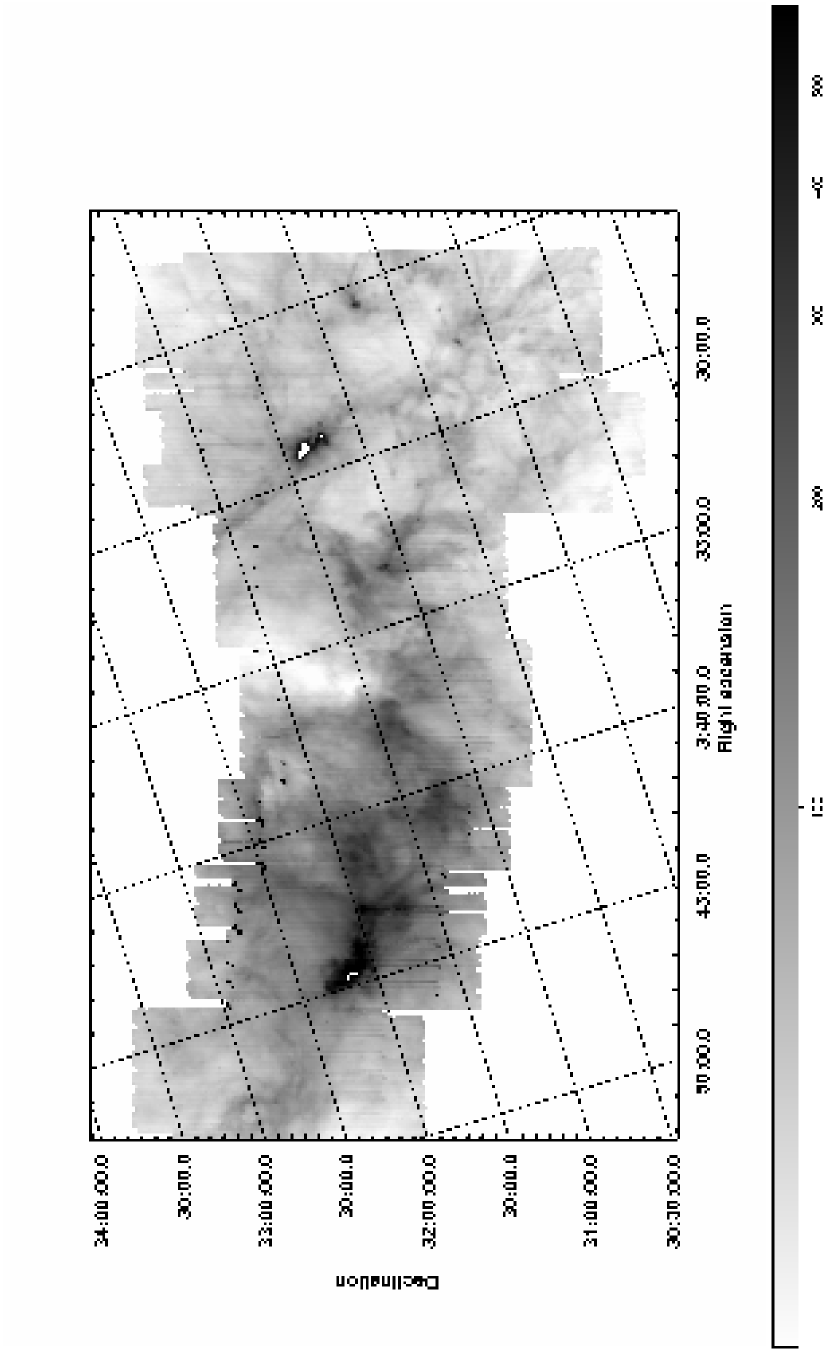
For the 160 m data, we started with the S11.4 SSC BCDs. To create the mosaics that appear in the Figures in this paper (such as Figure 4), we used MOPEX to mosaic the unfiltered BCDs and resampled the mosaics to have 8 pixels (half the native pixel scale). In order to “fill in” the gaps in the map caused by incomplete coverage, we used a two-dimensional 33 (native) pixel boxcar median to interpolate across missing (“NaN”) pixels. No attempt was made to interpolate across saturated regions, nor was any further filtering applied to remove instrumental signatures.
In order to obtain point source flux densities, we started with the unfiltered 160 m pipeline products and created mosaics with pixels of similar size to the native pixel scale. Photometry was then performed with APEX-1-frame PRF fitting on this mosaic. Because of the complexity of the extended emission in this channel, APEX can be confused. APEX’s initial source list was cleaned by hand, and only flux densities from those point sources considered reliable were retained. Not all emission peaks seen on the mosaic were retained; as for 70 m, only unresolved point sources are included. Similarly, saturated sources, or close multiples, or low signal-to-noise sources, are not included. As with the other MIPS wavelengths, in regions of particularly bright ISM (at 160 m, the ISM is bright enough that this restriction is no longer limited just to the clusters), point sources may be lost due to saturation or (at the faint end) to simply being drowned out by the nebulosity. And, finally, source confusion is a particularly difficult problem here, where the resolution is .
There are 28 total point sources in our catalog detected at 160 m (see Figure 13), ranging from 0.67 to 18 Jy. About 60% of the 160 m objects had identifiable counterparts at 24 and 70 m; many of the 160-only objects are lacking shorter-wavelength counterparts because the shorter wavelengths are saturated. The zero point used to convert the flux densities to magnitudes was 0.159 Jy, based on the extrapolation from the Vega spectrum as published in the MIPS Data Handbook.
No color corrections were applied, nor was any attempt made to remove the contribution from the blue filter leak. As discussed in the Spitzer Observer’s Manual and the MIPS Data Handbook (available on the SSC website), stars fainter than 5.5 mag will not produce a detectable leak signal above the confusion level. Of the 12 objects detected at both and 160 m, all of them have fainter than 5.5. We conclude that the leak is not important for our objects. We estimate an overall 160 m flux uncertainty of 20%.
2.5 Bandmerged Source Catalogs and Statistics
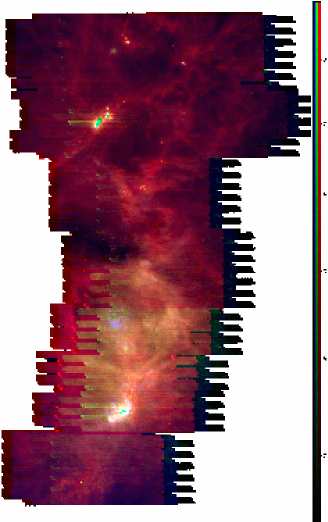
A multi-wavelength mosaic using MIPS data can be found in Figure 5. The extended emission is particularly dramatic and complex when compared across all of the MIPS wavelengths.
The c2d project mapped this cloud in IRAC as well; the IRAC map (see J06) covers less than half the area covered by MIPS (see Fig. 1), so there are large parts of the MIPS map which do not have IRAC coverage. The IRAC source extractions discussed in J06 were bandmerged with the MIPS sources (see Chapman et al. 2006 or Harvey et al. 2006 for much more discussion on this multi-wavelength bandmerging process) and these were included in our catalog.
Table 2 presents some statistics on the ensemble catalog spanning -band through 160 m. Whereas only 37% of the MIPS-24 objects in the entire catalog have an IRAC match at some band, 92% of the MIPS-24 objects in the region covered by IRAC have a match in at least one IRAC band. There are near-IR data covering this entire region from 2MASS, but 2MASS is relatively shallow; only 29% of the MIPS-24 sources have -band counterparts.
We wish to remind our readers of the discussion in §2 above, namely, that due to bright nebulosity, particularly in the clusters, both the faintest sources and the brightest sources (due to saturation) may not be present in the catalog. For example, about half of the 70 m objects that lack 24 m counterparts and about half of the 160 m objects lacking 70 and 24 m counterparts are lacking those counterparts solely because the shorter wavelength counterpart is saturated.
| item | overall | IC 348 | NGC 1333 | rest of cloud | IRAC coverage region |
|---|---|---|---|---|---|
| 24 m | 3950 | 252 | 166 | 3532 | 1602 |
| 70 m | 139 | 11 | 21 | 107 | 85 |
| 160 m | 28 | 0 | 1 | 27 | 15 |
| 24 m & 70 m | 121 | 9 | 13 | 99 | 85 |
| 24 m, 70 m, & 160 m | 16 | 0 | 0 | 16 | i 13 |
| 24 m & 2MASS K | 1141 | 146 | 78 | 917 | 557 |
| 24 m & any IRAC band | 1476 | 205 | 146 | 1125 | 1476 |
| 70 m & any IRAC band | 91 | 10 | 16 | 65 | 83 |
| 160 m & any IRAC band | 19 | 0 | 1 | 19 | 15 |
The c2d IRAC study by J06 selected YSO candidates using a preliminary SED classification scheme that required a source to be detected in one or more IRAC photometric bands. Perseus YSO candidates (“YSOc”) selected in this fashion were statistically described by J06 and are not reproduced here. A new result presented here for those objects discussed in J06 is that 80% have MIPS-24 counterparts, 13% have MIPS-70 counterparts, and 2% have MIPS-160 counterparts. In the region of Perseus not covered by IRAC, we are limited to using colors to select YSO candidates. Further discussion of the global properties of these candidates appears below. An upcoming paper by S.-P. Lai et al. will synthesize data from IRAC, MIPS, and groundbased surveys and present a list of all YSO candidates in this cloud based on Spitzer data. A separate study by M. Enoch et al. will include very cold Spitzer objects associated with millimeter emission. Jørgensen et al. (2006b) discus a comparison between the JCMT/SCUBA sub-millimeter and Spitzer data in Perseus.
Finally, in the present paper, we give only a statistical picture of the cloud population compared to the extragalactic source backgrounds. As with the other c2d papers in this series, our comparison extragalactic source background is data from the Spitzer Wide-area InfraRed Extragalactic Survey (SWIRE; Lonsdale et al. 2003), which were retrieved for the ELAIS N1 field (Surace et al. 2005), and processed through the same steps as for the molecular cloud data. For further discussion of these steps, see Harvey et al. (2007, submitted).
2.6 Summary of Observations
This paper presents 10.5 square degrees of Perseus as observed with MIPS at 24 m ( resolution), 70 m ( resolution), and 160 m ( resolution). It references bandmerged complementary data obtained with IRAC (3.6, 4.5, 5.8, and 8 m) and 2MASS () over this same region. There were 3950 point sources detected at 24 m, 139 point sources at 70 m, and 28 point sources at 160 m. The sensitivity limits for all three bands are a function of location on the sky because the sky brightness changes substantially at all three bands; it is brightest in the clusters IC348 and NGC 1333. The rest of the analysis of the ensemble of point sources in Perseus separates out the objects found in the clusters from the rest of the cloud, and compares them (where possible) to similar observations of one of the SWIRE fields, expected to be populated entirely by galaxies.
3 Global Results Across the Perseus Cloud
3.1 Source Counts
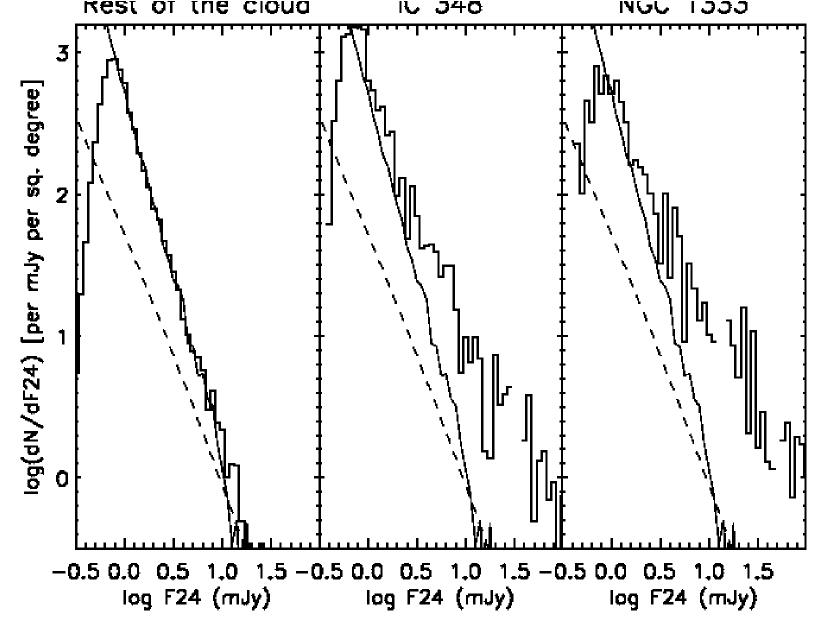
MIPS sources in Perseus are a combination of cloud members, foreground/background stars in the galaxy, and the extragalactic background. Figure 6 shows the observed Perseus 24 m differential source counts in comparison to observed source counts from the SWIRE ELAIS N1 extragalactic field, and to the prediction for galactic star counts in the IRAS 25 m band from the Wainscoat et al. (1992) model provided by J. Carpenter (2001, private communication). In the IC 348 and NGC 1333 clusters, there is a clear excess of cloud member sources above both backgrounds, for flux densities 2-3 mJy. In IC 348, there is suggestion of an excess even at the 1 mJy level. In NGC 1333, the source counts turn over at higher flux densities, presumably due to reduced sensitivity caused by source crowding and bright extended emission. Across the much larger “rest of the cloud” region, an excess of on-cloud sources is seen only for flux densities 10 mJy; below this level, the Perseus source counts follow the extragalactic background. Galactic star counts make only a minor contribution to the MIPS source counts in Perseus, in contrast to the four other clouds surveyed by c2d (Evans et al. 2003). This is a natural consequence of Perseus’ location at =160, , whereas the four other clouds are located toward the inner galaxy and closer to the galactic plane.
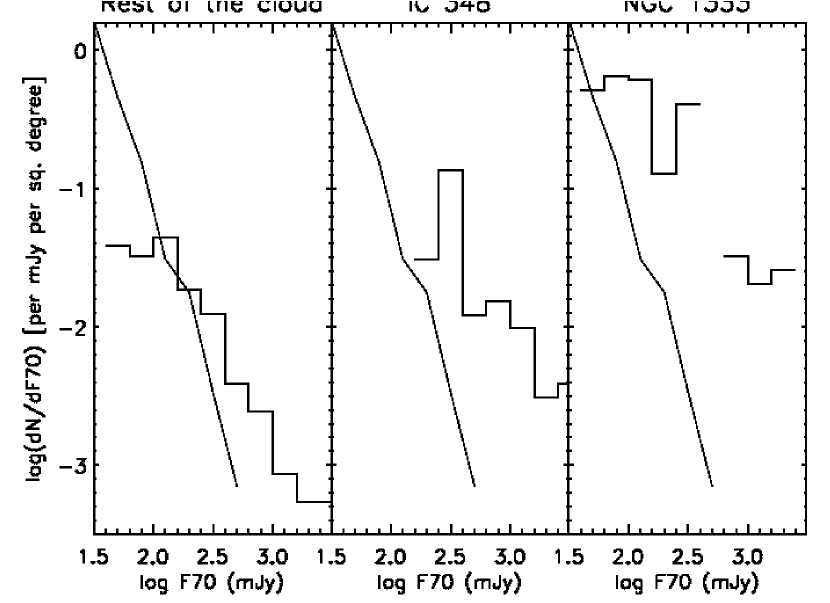
Figure 7 shows 70 m source counts in Perseus, along with extragalactic background counts from the SWIRE ELAIS N1 field. In the extended cloud outside the clusters, a clear excess in source counts is present above a flux density of 200 mJy. A similar result is found in IC 348. In NGC 1333, however, the flux density limit above which cluster number counts exceed the extragalactic background is about 65 mJy. The brightest measurable objects in Perseus are found in NGC 1333, where there is a clear excess of these relative to other parts of Perseus. It should be noted (see discussion in §2.3 above) that the brightest sources (flux densities 20 Jy) are under-represented in these plots due to saturation effects, that the faintest sources are both subject to the completion limitations discussed above and more difficult to detect in regions of high surface brightness, and that only point sources are included.
3.2 Recovery of IRAS Sources
| item | … at 24 | … at 70 m |
|---|---|---|
| 12 m PSC real (IRAS qual=3) detections | 51 | 51 |
| cleanly retrieved | 34 (67%) | 19 (37%) |
| completely missing | 1 ( 2%) | 16 (31%) |
| confused by nebulosity | 11 (21%) | 15 (29%) |
| resolved as multiple | 5 (10%) | 1 ( 2%) |
| 25 m PSC real (IRAS qual=3) detections | 56 | 56 |
| cleanly retrieved | 34 (61%) | 31 (55%) |
| completely missing | 0 ( 0%) | 6 (11%) |
| confused by nebulosity | 13 (23%) | 17 (30%) |
| resolved as multiple | 9 (16%) | 2 ( 4%) |
| 60 m PSC real (IRAS qual=3) detections | 88 | 80 |
| cleanly retrieved | 32 (36%) | 35 (44%) |
| completely missing | 9 (10%) | 8 (10%) |
| confused by nebulosity | 42 (48%) | 36 (45%) |
| resolved as multiple | 5 (6%) | 1 ( 1%) |
| 100 m PSC real (IRAS qual=3) detections | 78 | 75 |
| cleanly retrieved | 10 (13%) | 9 (12%) |
| completely missing | 41 (52%) | 40 (53%) |
| confused by nebulosity | 25 (32%) | 25 (33%) |
| resolved as multiple | 2 (3%) | 1 ( 1%) |
| 12 m FSC real (IRAS qual=3) detections | 56 | 57 |
| cleanly retrieved | 48 (86%) | 24 (42%) |
| completely missing | 4 (7%) | 27 (47%) |
| confused by nebulosity | 2 (3.5%) | 5 (9%) |
| resolved as multiple | 2 (3.5%) | 1 (1%) |
| 25 m FSC real (IRAS qual=3) detections | 52 | 50 |
| cleanly retrieved | 38 (73%) | 26 (52%) |
| completely missing | 1 ( 2%) | 10 (20%) |
| confused by nebulosity | 8 (15%) | 11 (22%) |
| resolved as multiple | 5 (10%) | 3 ( 6%) |
| 60 m FSC real (IRAS qual=3) detections | 0 | 0 |
| 100 m FSC real (IRAS qual=3) detections | 0 | 0 |
The MIPS data for the Perseus molecular cloud offer an opporunity to assess how successful the IRAS survey was in identifying point sources in a complex region. We now explicitly compare the IRAS PSC (Beichman et al. 1988) and IRAS FSC (Moshir et al. 1992) results in this region to the Spitzer c2d images and catalogs described in this paper. Complex extended emission is present in all three MIPS bands, posing a significant source of confusion to the large IRAS aperture measurements. Many of the IRAS PSC objects were detected at 60 or 100 m only, with only upper limits at 12 and 25 m; so even without Spitzer data, one might suspect that such sources might correspond to texture in the extended emission. As we will show below, the Spitzer data comparison clearly shows that significantly fewer spurious sources appear in the FSC than in the PSC.
The statistics are presented in Table 3. An IRAS data quality flag of 3 means a solid detection, whereas data quality flags of 1 indicate upper limits. “Cleanly retrieved” means that IRAS reported a single source at a given location, and the corresponding MIPS image shows a single object which in several cases was saturated. “Completely missing” means that no source appears at that location in the corresponding MIPS image, and there is no immediately apparent reason for the discrepancy. In contrast, “confused by nebulosity” means that the corresponding MIPS image shows structured nebulosity that could be confused for a point source in the large IRAS beams. Finally, “resolved as multiple” means that MIPS finds multiple far-infrared sources where IRAS reported only one.
As can be seen in Table 3, most of the 12 and 25 m highest-quality PSC point sources are either retrieved or it is clear why a point source was reported for that location. Overall, 20-30% of the “point sources” at 12 and 25 m resolve into knots of nebulosity. Essentially none of these 12 and 25 m point sources are undetected at 24 m, but a much larger fraction are completely missing at 70 m – this is likely to be a result of the lower sensitivity of 70 m compared to 24 m combined with the lower expected flux density from stars at 70 m compared with the shorter wavelengths.
There are many more “point sources” reported at 60 and 100 m (than at 12 and 25 m) in the PSC. A much lower fraction of these objects are recovered; many more of these are completely missing or fall apart into nebulosity when viewed with MIPS. More than half of the 100 m point sources are completely missing, and 25-40% of the 100 and 60 m point sources are clearly confused by nebulosity.
Surprisingly few IRAS sources are resolved into multiple objects by Spitzer. However, our results may be a lower limit on the true number of such objects, as we did not consider the individual error ellipses for each IRAS source. Two IRAS sources clearly resolved into stellar aggregates are discussed below in §4.1.2 and 4.1.3.
Overall, a much larger fraction of FSC objects are recovered by MIPS than PSC objects. This is largely due to the FSC being far more cautious about claiming to detect point sources in the presence of cirrus confusion: no 60 or 100 m detections are listed in this region in the FSC, whereas the PSC lists numerous detections that appear to be spurious. At 12 and 25 m, unrecognized asteroids may be responsible for the lower recovery rate of PSC sources relative to the FSC. We conclude that the IRAS FSC is much more robust for studies of stellar sources in regions with complex extended emission, and should be used in preference to the IRAS PSC unless Spitzer/MIPS data are available. A list of high-quality IRAS detections that are missing or fall apart into nebulosity in our Perseus MIPS dataset appears in Appendix A.
We note for completeness that direct comparison of the measured MIPS and IRAS flux densities for the same sources are greatly complicated by the different calibration approaches of the two instruments, requiring detailed knowledge of the underlying SED of the objects in question and large color corrections. This is beyond the scope of this paper.
3.3 Color-Magnitude and Color-Color Plots
| item | rest of cloud | IC 348 | NGC 1333 |
|---|---|---|---|
| number objects with and 24 m | 917 | 146 | 78 |
| number with [24]2, 14 | 138 | 107 | 52 |
| number with [24]2, 14, and Class I [24] color | 9 (6%) | 7 (6%) | 4 (7%) |
| number with [24]2, 14, and “flat” [24] color | 12 (8%) | 5 (4%) | 11 (21%) |
| number with [24]2, 14, and Class II [24] color | 105 (76%) | 92 (85%) | 35 (67%) |
| number with [24]2, 14, and Class III [24] color | 12 (8%) | 3 (2%) | 2 (3%) |
| SSTc2d name | [24]aaObjects where 9.7 mag. | [70]bbObjects where [70] 15 mag. | [24][70]ccObjects where [24][70]7 mag. | missed matchddObjects which were detected at 70 without a 24 counterpart, or detected at 160 without 24 or 70 counterparts. | other name | notes |
|---|---|---|---|---|---|---|
| 032637.4+301528 | yes | yes | … | … | IRAS 03235+3004 | see §4.2 and J06 |
| 032800.4+300801 | yes | … | … | … | IRAS 03249+2957 | see J06 |
| 033015.1+302349 | yes | yes | … | … | IRAS 03271+3013 | see §4.1.1 |
| 034202.1+314801 | yes | … | … | … | … | see §4.1.2 |
| 032845.3+310541 | yes | yes | … | … | HH 340 | see §4.2 |
| 033925.5+321707 | yes | … | … | … | … | see §4.2 |
| 032839.6+311731 | yes | … | … | … | LAL 68 | in NGC 1333 |
| 032858.4+312217 | yes | … | … | … | LAL 166 | in NGC 1333 |
| 032903.3+312314 | yes | … | … | … | LAL 191 | in NGC 1333 |
| 032912.9+311814 | yes | … | … | … | ASR 30 | in NGC 1333 |
| 033309.5+310531 | yes | … | … | … | … | in B1 region |
| 033316.6+310755 | yes | yes | … | … | IRAS 03301+3057 | in B1 region; see J06 |
| 033925.5+321707 | … | yes | … | … | IRAS 03363+3207 | see §4.2 |
| 032548.2+305537 | … | yes | … | yes, but ext@24 | BD+30540 | see §4.5 |
| 032904.2+311608 | … | yes | … | yes, but sat@24 | … | in NGC 1333, see §3.3.2 |
| 033554.4+304500 | … | yes | … | … | 2MASS 03355439+3045011 | see §3.3.2 |
| 034443.9+320136 | … | yes | … | … | IRAS 03415+3152 | on edge of IC348; see §3.3.2 |
| 032910.5+311330 | … | … | yes | … | IRAS 4 A1/A2 | in NGC 1333 |
| 033121.0+304530 | … | … | yes | … | IRAS 03282+3035 | see J06 |
| 033316.5+310652 | … | … | yes | … | B1-d | see J06 |
| 033218.0+304946 | … | … | yes | … | IRAS 03292+3039 | see §4.2 and J06 |
| 034356.9+320304 | … | … | yes | … | IC 348 MMS | see §4.6 |
| 034741.6+325143 | … | … | … | yes, no 24 | B5 IRS 1 | see J06 |
| 032851.6+304502 | … | … | … | yes, no 24 | LkHa 325 | see §3.3.4 |
| 033227.5+310236 | … | … | … | yes, no 24,70 | … | in B1 region, shorter saturated |
| 033310.3+312108 | … | … | … | yes, no 24,70 | … | in B1 region, shorter saturated |
| 033327.0+310647 | … | … | … | yes, no 24,70 | … | in B1 region, shorter saturated |
| 032842.8+311744 | … | … | … | yes, no 24,70 | … | shorter saturated |
| 034107.8+314411 | … | … | … | yes, no 24,70 | … | shorter saturated |
| 033511.5+312026 | … | … | … | yes, no 24,70 | … | very weak @160, real? |
| 032923.9+313320 | … | … | … | yes, no 24,70 | … | diffuse@160, offset from nearby bright obj |
| 033046.4+303242 | … | … | … | yes, no 24,70 | … | diffuse@160, offset from nearby bright obj |
3.3.1 The vs. Diagram
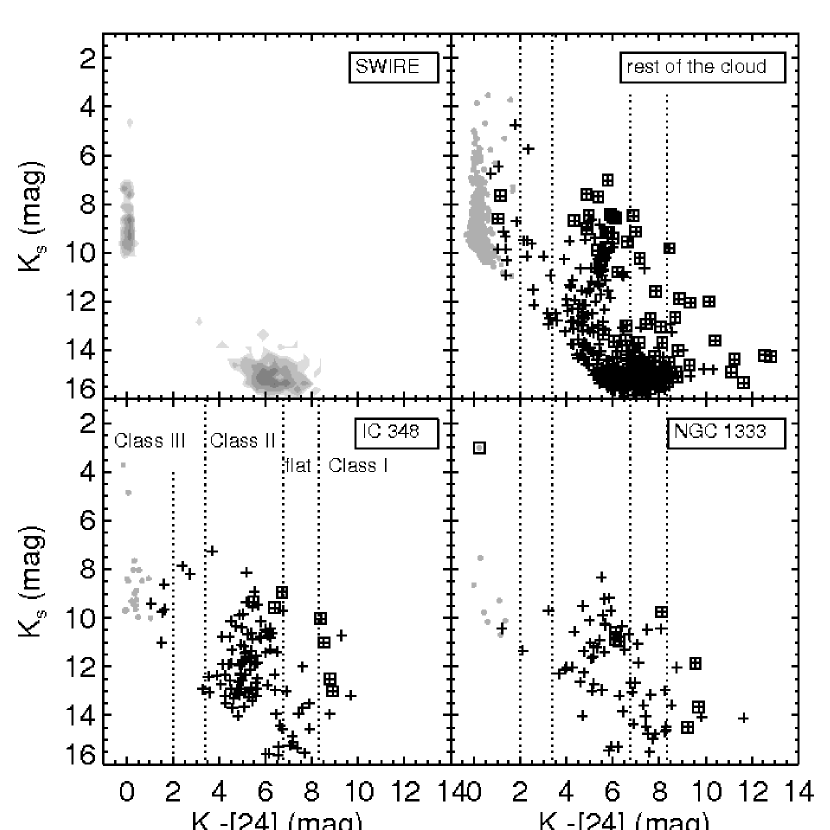
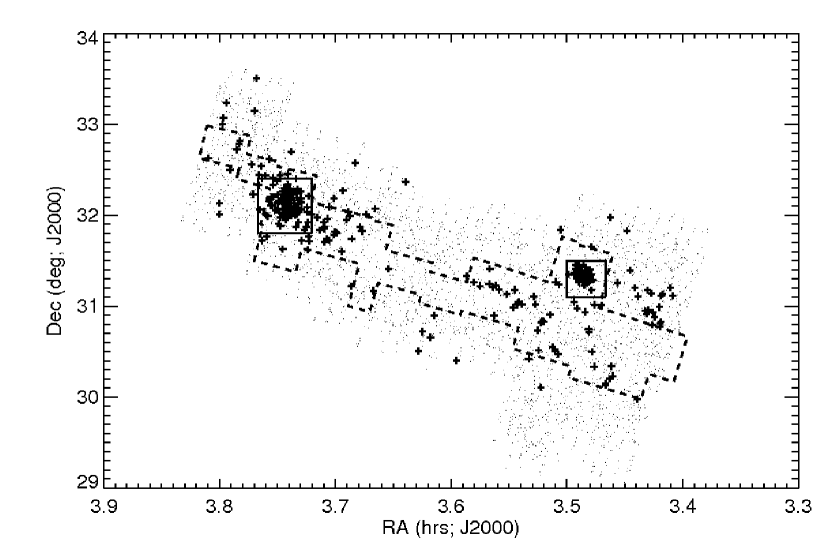
Figure 8 shows the vs. color-magnitude diagram (CMD) for Perseus, combining our results with 2MASS survey data. Ordinary stellar photospheres (likely foreground or background stars) have 0. The lack of sources in the lower left of the vs. plot is entirely a sensitivity effect, explained as follows. Our magnitudes are limited to those found in 2MASS, e.g., to brighter than 16th magnitude in this region. Our 24 m survey goes down to about 1 mJy (see Fig. 6), which, for a stellar photosphere, corresponds to about 10, so we do not see any stellar photospheres with fainter than 10. As we move to redder objects, source matches to fainter are obtainable down to the 2MASS sensitivity limit. Background galaxies become numerous at 14.
The top left panel of Figure 8 shows data from the SWIRE extragalactic survey, as discussed above, which have been flux-trimmed to match the c2d survey sensitivity. Since all of the objects in SWIRE are likely foreground stars or background galaxies, this panel shows which regions of the CMD are least likely to provide a clean sample of likely YSOs: objects with 2 and 14 are least likely to be part of the galactic or extragalactic backgrounds, and thus likely to be young stellar objects with a 24 m excess. There are many such stars with excesses in the “rest of the cloud” despite some expectations that there would be little star formation outside of the canonical clusters. Looking at the IC 348 and NGC 1333 clusters, there are comparatively not many stars nor background galaxies; most of the objects are likely young cluster members.
There remains a possibility that some of the objects seen at 24 m and having a [24] color suggestive of disks may be background AGB stars. Harvey et al. (2005,2006) find that any AGB star in our Galaxy is likely to be saturated in the c2d IRAC observations, but the MIPS survey effectively reaches a different depth. The galactic coordinates of Perseus are (160, 19.5), toward the galactic anticenter and a significant angle out of the plane; the expected background star counts are relatively small. Assuming as a worst-case scenario that the Milky Way disk is 15 kpc radius and 1.5 kpc thick, the furthest reaches of our Galaxy that could be included in these observations of Perseus are 1-4 kpc away. We compared Fig. 8 with data from Blum et al. (2006) obtained in the LMC. Assuming the LMC is at 44 kpc, and correcting for the relative distances along the line of sight to Perseus, a typical ABG star would appear so bright as to be saturated in the 2MASS survey. Only 0.06% of the distance-adjusted LMC sample would be unsaturated and appear in Figure 8 – equivalent to just one of the 1141 2MASS sources within the Perseus map area. Larger AGB counts would be expected if the background population was highly reddened, but this is unlikely given that only 2% of the MIPS map area lies above the A 10 contour. We therefore conclude that vast majority of 297 objects with 2 and 14 are likely to be young stars associated with the Perseus clouds.
As a simple first attempt at classifying the objects found throughout our map into Class I, flat, Class II, and Class III objects, we can use the observed [24] colors and assign an index following Greene et al. (1994), where [24] values 8.31 are Class I objects, those between 6.75 and 8.31 are flat spectrum objects, those between 3.37 and 6.75 are Class II objects, and those with 3.37 are Class III. Note that the formal Greene et al. classification puts no lower limit on the colors of Class III objects (thereby including those with SEDs resembling bare stellar photospheres, and allowing for other criteria to define youth). In our case, since we know little about many of these new objects, we have minimized the contamination from foreground/background stars by requiring [24]2, and limited the contamination from background galaxies by requiring 14. Note that there are likely to be true Perseus members that are excluded by these (conservative) criteria, but identifying them is beyond the scope of this paper. The number of reported Class III objects we derive are certainly lower limits to the true values. Table 4 summarizes the numbers of the objects that meet these criteria found in each region. Comparable fractions (7%) in both of the clusters and the rest of the cloud have colors consistent with Class I objects. A much larger fraction of objects in NGC 1333 (21%) than IC 348 (only 4%) have colors consistent with the “flat” classification, while only 8% of the sources in the rest of the cloud have flat SEDs. Our results for the frequency of Class I and flat spectrum SEDs differs from J06, who reports that 47% of the Perseus YSO population outside the two clusters fall into these SED categories. The different results can be traced to how YSO candidates are selected. The MIPS “rest of cloud” area covers 10 square degrees, whereas the IRAC ”rest of cloud” area of J06 is a factor of 3 smaller, and covers a region of higher extinction. The 140 MIPS YSO candidates outside the clusters are selected from their postion in the vs. diagram, implicitly limiting this selection to objects bright enough to be detected at in 2MASS; J06 considers 144 YSO candidates selected using the 2005 c2d SED classification scheme combining IRAC and MIPS measurements, with no flux cutoff. The J06 results therefore extend to less luminous YSOs than we have considered here. The MIPS data show that the abundance of bright Class I and flat spectrum sources is not higher in the rest of the cloud versus the NGC 1333 and IC 348 clusters. The results of J06 suggest that faint objects of these types are more abundant in the intercluster region of Perseus.
Just from Figure 8, it can be seen that there are many more Class II objects in IC 348 than in NGC 1333; 85% of the candidate young objects have colors consistent with Class II objects in IC 348, whereas 67% of the objects in NGC 1333 have similar Class II colors. These numbers suggest that NGC 1333 is younger than IC 348, consistent with expectations that IC 348 should be 1-2 Myr (e.g., Lada et al. 2006 and references therein) and NGC 1333 should be younger at 1 Myr (e.g., Wilking et al. 2004 and references therein). From Fig. 8, in the “rest of the cloud,” there are many more stars and background galaxies than in the clusters. Somewhat surprisingly, as was found in J06, there are many YSO candidates in the rest of the cloud as well; in sheer numbers, there are as many candidate young objects outside the clusters as in the clusters. Using the relative fractions of “flat” and Class II object colors as a proxy for age, objects in the rest of the cloud are intermediate in age, on average, between IC 348 and NGC 1333. However, there is also a larger fraction of Class III objects in the “rest of the cloud” (8%) than there is in either of the clusters (2-3%). These Class III objects are located essentially randomly across the cloud.
Of course, for much of this region, we have more information than just and 24 m measurements, and a more sophisticated classification scheme can be implemented. In the clusters, because these regions have IRAC coverage, essentially all of the YSO candidates have already been identified and classified (using the 2005 c2d classification scheme as described there) as part of J06; additional discussion will be provided by S.-P. Lai, in preparation. In the “rest of the cloud,” there are vast regions without 4-band IRAC data; these include 36 objects with excesses (e.g., with 14 and 2) that are additional YSO candidates. A few of these are found near the ends of MIPS scan legs where their photometry is less reliable, and thus could be spurious. But most are likely to be true cloud members, especially those clustered near L1448 on the far northwest side of the MIPS mosaic. Figure 9 shows where all 300 sources with excesses are located in our mosaic. Most of these are projected against the regions of highest extinction covered by the IRAC data of J06.
The objects in Fig. 8 that also have 70 m detections are generally the brightest objects. This is effectively an instrumental artifact in the following sense. The intrinsic instrumental point source sensitivity is worse at 70 than at 24 m; for our observing strategy, the expected 1- point source sensitivity is 0.25 mJy at 24 m and 14.5 mJy at 70 m. The faintest object we actually see in this cloud at 24 m is 100 times fainter than the faintest object seen at 70 m. Based on very simple SEDs, we expect that Class 0 objects through Class III objects could have a 24:70 m flux ratio of 10 to 0.1. Thus, only the brightest cloud member objects will be detected at 70 as well as 24 m. Conversely, most of the objects detected at 70 m are bright enough that they are likely cloud members. There are three objects detected at 70 m with 3 whose SEDs through 24 m resemble photospheres. They are SSTc2d 032740.5+311539 (also known as VSS IX-12 [Vrba et al. 1976]), SSTc2d 032807.6+311040 (also known as VSS IX-11 and IRAS 03250+3100), and SSTc2d 032820.9+294757 (also known as SAO 75942). VSS IX-11 is in NGC 1333 (a portion with only 2-band IRAC coverage), and it appears to retain a stellar (Rayleigh-Jeans) slope through 70 m. The other two objects (VSS IX-12 and SAO 75942) are from outside the clusters, in regions with no IRAC coverage, and they both appear to have a clear excess at 70 m, suggesting Class II SEDs. VSS IX-12 is extremely faint at 70 m; SAO 75942 is a clear detection. Additional followup observations (such as MIR spectroscopy) will be needed required to determine if these are true debris disks objects.
Low luminosity cloud members are particularly interesting objects for study. Unfortunately the SWIRE observations show that there is a large population of red background galaxies at 14, and so it is not generally possible to distinguish faint YSOs from background galaxies using broad-band photometry alone. An important exception is the case of the reddest sources; at 9.7, there are no background galaxies with 2MASS counterparts. There are 12 such objects in Perseus (see Table 5); these are potentially the most embedded and therefore youngest cloud members. Four are located in NGC 1333, and two more are in the B1 region. IRAS 03301+3057 is one of the reddest objects in the entire cloud, turning up as red by using more than one criterion (see Table 5).
3.3.2 The vs. Diagram
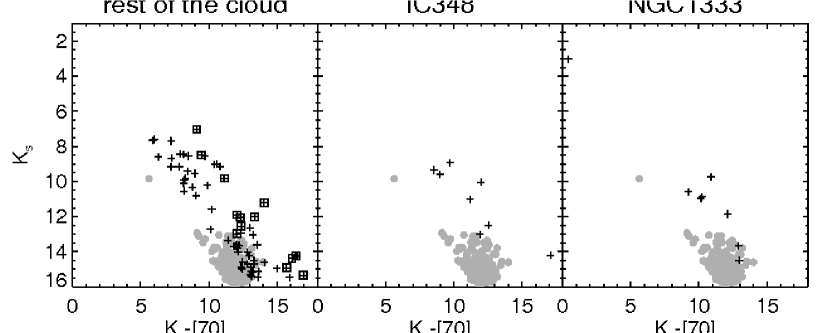
Figure 10 shows the vs. color-magnitude diagram for Perseus, with data for the full SWIRE survey included for comparison. The morphology of this parameter space is similar to that of Figure 8 in that the survey sensitivity limits create the absence of points in the lower left, stellar photospheres are in the upper left (only one very bright Perseus object, in NGC 1333, appears in this region), and likely galaxies are fainter in . There are roughly two clumps of objects in Perseus; the fainter clump is reasonably well-matched in color and to the objects found in SWIRE. There are very few such candidate galaxies in the two clusters because the bright ISM cuts off the sensitivity at a shallower level than elsewhere in the cloud. The SWIRE survey, because it is deeper than the c2d surveys, has objects that extend bluer in [70] at the faintest values than are found in Perseus. However, the reddest objects in SWIRE at these magnitudes levels are , all with . The reddest objects (redder than ) are therefore likely to be Perseus cloud members, and correspond to the most highly embedded objects. Most of these very red objects are distributed outside the two clusters, with only one in IC 348.
The brighter clump of objects (with 10) are also likely YSO candidates, and there are such candidates in all three Perseus regions; there is even one in SWIRE, suggesting that perhaps not all of the brighter objects are guaranteed to be YSOs. There is just one very bright object at 70 that is a likely stellar photosphere – it is SSTc2d 032807.6+311040 (also known as VSS IX-11 and IRAS 03250+3100), in NGC 1333. There is only one photosphere because of the shallow limits of our survey; this object, as bright as it is in , is near our detection limit in 70 m. There are not many objects in Perseus that are bare photospheres and also bright enough at 70 m to be detected by our survey.
We attempted to compare these observed colors with IRAS measurements of two famous well-known young objects in Taurus from Kenyon and Hartmann (1995), even though the IRAS and MIPS bandpasses are not well-matched. DO Tau is a CTTS with a color of 9.4 mag, and IRAS 04016+2610 is a more embedded object with a color of 13.3 mag. The brighter CTTS would be found in the brighter clump of young candidate objects, were it at the Perseus distance. The fainter, more embedded object would appear on the bright side of the clump that is more consistent with SWIRE galaxy colors. Therefore, some of the objects with colors consistent with SWIRE galaxies could also be candidate YSOs; one cannot simply make a brightness cut to cleanly distinguish between YSOs and galaxies.
As with the 70 m detections in Fig. 8, here only the brighter objects are also detected at 160 m. The effects of the bright nebulosity in the clusters is vividly apparent, as no objects in this plot in the clusters are also detected at 160 m.
There are nine very red objects with [70] 15 mag, a region of color space in which no background SWIRE galaxies are seen. They are listed in Table 5. For some of these sources, 24 micron fluxes were not available due to saturation or extended emission.
3.3.3 The [24] vs. [24][70] Diagram
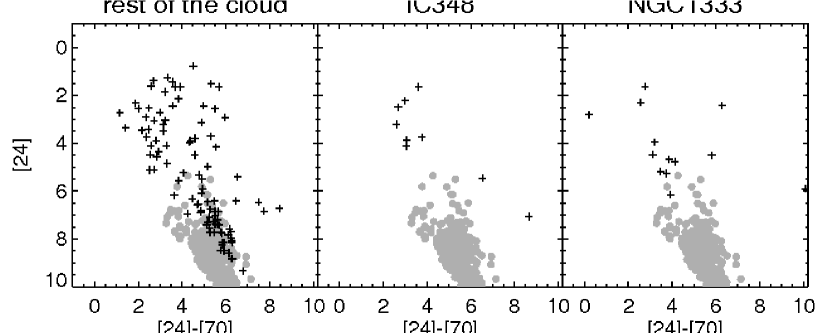
Figure 11 is an all-MIPS color-magnitude diagram, presenting [24] vs. [70] for objects in Perseus, and again, for comparison, objects in the full SWIRE survey. As in Figure 10, (a) the deeper SWIRE survey extends to bluer objects for the faintest 24 m values in the Perseus survey; (b) objects found in Perseus with 24 m and colors consistent with those found in SWIRE are potentially galaxies, though there are clearly objects in Perseus with redder colors for a given 24 m flux density than are found in SWIRE; and (c) the brighter objects are likely to be cluster members.
The Perseus population from the “rest of the cloud” in Fig. 11 does not have two clumps that are as distinct as those found in Fig. 10; it is much more dispersed, both in the [24] and in the [24][70] directions. It is difficult to make comparisons between the clusters and the rest of the cloud because there are so few objects available in the clusters; as before, for IC 348 and NGC 1333, the brightness of the nebulosity enforces a brightness cutoff such that there are few faint and red objects detected. The nebula is bright enough that it also limits the number of brighter legitimate cluster members that can be detected in this parameter space. Certainly a young and/or embedded population is present in the rest of the cloud. A significant distance dispersion could broaden the distribution of objects seen in the “rest of the cloud” in comparison to the clusters, or the increased number of objects could simply better represent the true distribution of young objects. At the faintest levels, the reddest SWIRE objects are found near 7, so the handful of objects found to be redder than that are likely to be cloud members and highly embedded.
There are five very red objects with [24][70]7 mag, and they appear in Table 5. They are all young, very embedded objects. SSTc2d 032910.5+311330 is by far the reddest object, with [24][70]=10.1; its position is consistent with IRAS 4 A1/A2 in NGC 1333, which is indeed a well-known embedded object (see, e.g., Reipurth et al. 2002, Choi 2005, Rebull et al. 2003, or Mott & Andre 2001, and references therein). Although this object is clearly detected in 70 m, the IRAS 4B and 4C components are nearby and also clearly detected, so the 70 m flux as measured for IRAS 4A may have imperfectly accounted for contributions from IRAS 4B and C, affecting the [24][70] color as measured.
3.3.4 The [70][160] vs. [24][70] Diagram
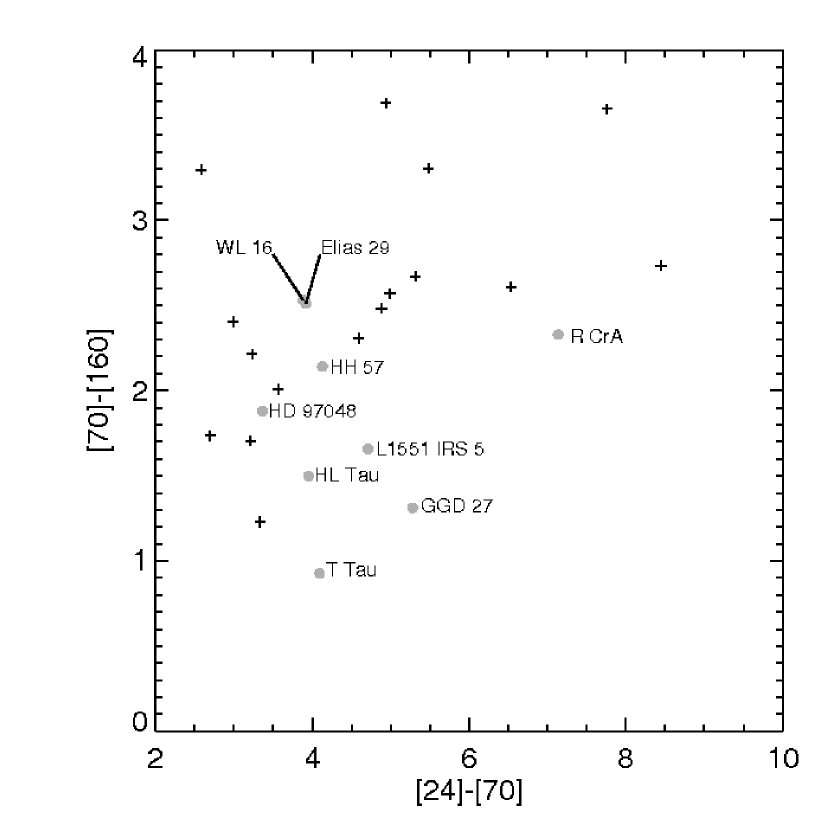

Figure 12 shows the MIPS color-color diagram for Perseus. Included for comparison on this plot are colors calculated for MIPS bands from ISO SWS data for a variety of very famous well-studied embedded objects from A. Noriega-Crespo (private communication). This parameter space has not been commonly explored until very recently, in part because the “famous” regions of most clusters have bright enough nebulosity (as we do in our clusters here) so as to preclude detection at at least one of the three MIPS bands. In the case of Perseus, the large area we have covered with our MIPS map includes many interesting objects in regions beyond the famous clusters. All of the Perseus objects in Figure 12 are from the “rest of the cloud” where the nebulosity is low enough to enable measurements at all three MIPS wavelengths; the colors of these objects, despite being from the “rest of the cloud,” are clearly consistent with being young stars. The locations of these objects are shown in Figure 13. Only one object is detected at 160 m within our defined cluster regions (it is in NGC 1333; see Fig. 13), and that object has no measured (e.g., unsaturated) counterpart in the catalog at 24 and 70 m. We expected that none of these objects are likely to be extragalactic in that the sensitivity of our 160 m survey is such that it is really only likely to probe galactic objects, e.g., cluster members. However, one object may be extragalactic; see the discussion in Section 4.2 below which discusses each of these objects detected at all three MIPS bands.
There are several objects detected at the longer MIPS bands but lacking counterparts at the shorter MIPS bands. These could be indicative of very embedded objects, but, because our survey becomes shallower and shallower at longer wavelengths, they are also often objects where the shorter-wavelength counterpart is simply saturated. There are 18 objects with 70 m measurements but no 24 m counterparts; four of note appear in Table 5. As can be seen in the table, most of these objects fall into one of two categories: objects that are saturated at 24 m (10 of these, most of which are in NGC 1333), and objects that are faint and/or extended at 24 m (4 objects). The last of these objects, LkHa 325, is relatively isolated and seems to have a 70 m PSF peak slightly offset from the 24 m peak; this could be an instrumental effect in that the detection is on the edge of a scan leg, which could affect the centering of the detection.
Finally, we looked for objects with 160 m measurements but no 24 or 70 m counterparts; there are 8 such objects, and they appear in Table 5. Five of these objects are saturated at the shorter wavelengths. Two objects are diffuse and the center of their 160 m emission is clearly offset from the center of a nearby star seen at the shorter wavelengths. We suspect that the emission in these cases arises in a clump of ISM material heated by an adjacent stellar source.
3.4 24 m Variability
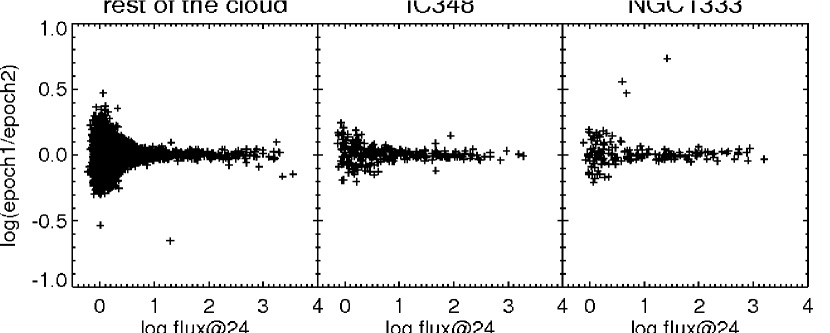
To reject asteroids, two 24 m observations separated by 3-6 hrs were made for every position in the MIPS Perseus map. This dataset provides an opportunity to search for time variability of cloud members and extragalactic background sources on this timescale. Figure 14 shows the ratio of flux densities measured at the two epochs, as a function of the combined 24 m flux density. The results show an RMS difference of 10% between epochs, consistent with our expected measurement uncertainties. Below flux densities of 10 mJy, the detected signal/noise ratio falls below 10, and the dispersion between the measurements increases accordingly. Several objects appear as outliers from this general distribution. Investigation of these individually shows that they suffer from one of several defects: they fall on the edges of the map (where photometry is less reliable), are contaminated by artifacts from nearby bright objects (as in the case of NGC 1333), are confused by bright extended emission, or are extended and thus not measured accurately by our point-source-fitting photometry. The apparent variability in all these cases is therefore of instrumental origin. We therefore conclude that none of the 4,000 24 m sources in Perseus shows real variability above the 10% level on timescales of 3-6 hours.
3.5 Large-Scale Extended Emission
Bright extended emission is present at all three wavelengths throughout the MIPS Perseus mosaics (Figs. 2-5). While MIPS has much more sensitive detectors than IRAS had, it also samples much smaller pixel/beam sizes. The result is that in our MIPS fast scan observations, the achieved surface brightness sensitivity is only incrementally better than that of IRAS, and the majority of the extended structures we see have direct counterparts in the IRAS maps. The major value added by the MIPS observations is a factor of 3-5 better spatial resolution, enabling studies of structural detail in the extended emission. A drawback is that MIPS saturates on the extended emission in parts of IC 348 and NGC 1333 at 70 and 160 m.
At 24 m (Fig. 2), the brightest extended emission is seen on the East side of the cloud complex where several B stars act as illuminating sources. The largest single feature is the 1.4 diameter IRAS ring illuminated by HD 278942 (Andersson et al. 2000; Ridge et al. 2006). Even with the added resolution supplied by MIPS, the ring edges remain diffuse – unlike a swept-up shell. A prominent 24 m nebulosity surrounds the central star, and is discussed further in Sect. 4.4. A second, much smaller ring appears within the larger one. Its center is offset to the East by 7, and it appears to be illuminated by the IRAS source 03382+3145. Bright emission in IC 348 takes the form of a large cavity open to the northwest, again with diffuse edges. The peculiar structure in the 24 m nebulosity at the center of IC 348 is discussed below (§4.3). With the exception of local nebulosities illuminated by BD+30549 (in NGC 1333) and BD+30540 (see §4.5), there is very little 24 m extended emission in the West side of the cloud complex.
At 70 m (Fig. 3), the extended emission structure is similar to that seen at 24 m. One important difference is that the nebulosity around HD 278942 fades considerably. Streaking artifacts appear along the scan direction after a scan crosses over a bright source.
At 160 m (Fig. 4), however, a wealth of new structure appears in the extended emission. On the West side of the cloud complex, a bright filament appears along the B1 submm ridge (Enoch et al. 2006), and extends southwest to the Per 6 stellar aggregate (see §4.1.1. Another large filament of 160 m emission extends northeast to southwest across NGC 1333, and continues down towards L1455. There is extended emission around L1448. Just South of IC 348, a East-West region of 160 m emission becomes prominent, offset from the 24 m emission in the direction away from the illuminating stars. To appear so prominently at 160 m while going largely unseen at 24 and 70 m, these regions must trace cold cloud material. This is confirmed by a comparison of the distribution of 160 m emission to the contours of visual extinction (Figure 15; J06 and Enoch et al. 2006). The extinction follows the 160 m emission closely, except for the large ring illuminated by HD 278942. The extended emission around this star, which was so bright at 24 m, is not detected at 160 m.
Finally, the 160 m extended emission also highlights the presence of three large voids on the West side of the Perseus cloud complex. The darkest of these is centered at =03h35m40s, =+3150; two others are present at =03h31m, =+31 and =03h27m10s, =+3030 (between L1455 and L1448). These voids have characteristic sizes of (3 pc at a distance of 250 pc). Smaller voids are also present. The absence of young stars and extended emission in these voids, and the corresponding concentration of star formation along the nearby extended emission/extinction filaments, is similar to what is seen in the Taurus molecular clouds (Hartmann 2002).
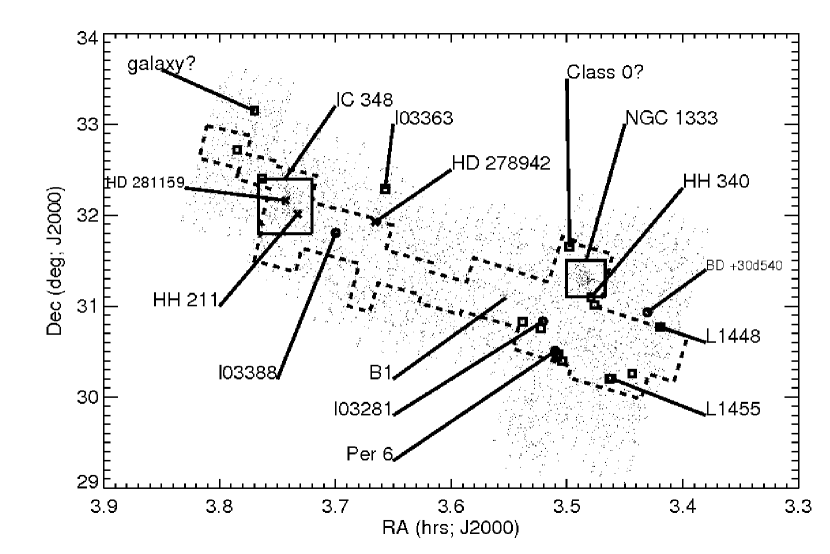
4 Results & Discussion for Individual Regions & Objects
This large map is incredibly rich in interesting objects and features. In this section, we select several objects or small groups of objects to discuss in more detail. Fig. 16 shows the locations of these specific objects within the overall Perseus cloud. Table 6 lists the MIPS flux densities for the point sources discussed here (IRAC flux densities are available from the online c2d delivered catalogs). estimates for individual stars were made using the method described in Evans et al. (2005). The SEDs presented below are all in in cgs units (erg s-1 cm-2), against in microns. In these SEDs, we have included the 2MASS and IRAC data from J06, but have not comprehensively included every other flux measurement from the literature of these objects, if relevant; some objects presented here are entirely new. Some objects whose SEDs are presented here were mentioned in J06, but their SEDs were deferred for presentation until this paper.
4.1 Spectral Energy Distributions in Young Stellar Aggregates
The term “stellar aggregates” was originally coined by Strom et al. (1993) in their near-infrared study of the young stellar population of the Orion L1641 cloud. They defined them as “regions of enhanced stellar surface density” – “sparse groups …likely to be gravitationally unbound, transient structures.” They applied the term to isolated stellar groups 1 pc in size (14 at the assumed distance of Perseus) and with as many as several dozen members. Their underlying assumption was that the aggregate members were born contemporaneously (i.e., are coeval) from a single parent molecular cloud core.
Throughout the Perseus map, and outside the two large clusters, there are several small groups of 24 m sources that fit the above definition of a stellar aggregate. In some of them, the stars are distributed in small linear strings or arcs, similar to those seen in NGC 2264 (Teixeira et al. 2006). The distribution of stars often follows structure in the millimeter continuum and 160 m emission (see Fig. 5). In this section, we discuss three new aggregates of stars, two of which appeared to the IRAS survey as single objects.
4.1.1 Per 6: A New Aggregate Between L1455 and B1
There is a ridge of molecular gas that extends southwest from B1 towards L1455. Roughly in between B1 and L1455, Ladd et al. (1994) find an ammonia core they dubbed Per 6. Olmi et al. (2005) find here two cores, an N2H+ core, and, slightly offset, a CS core. Hatchell et al. (2005) find an 850 m core here (# 81); Enoch et al. (2006) find 3 millimeter continuum cores in this region (Bolo 60, 61, 62). Based on sub-millimeter continuum and NIR extinction maps, in between Enoch’s Bolo 61 and 62, Kirk et al. (2006) find what they dub an “extinction core” (their #25) and an “extinction super core” (their #6). The Per 6 region also contains 4 IRAS sources, IRAS 03271+3013, IRAS 03273+3018, IRAS 03275+3020, and IRAS 03276+3022.
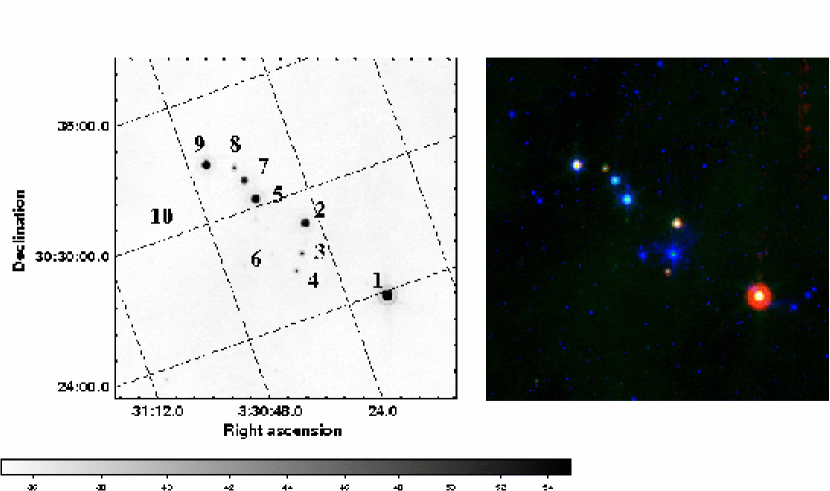
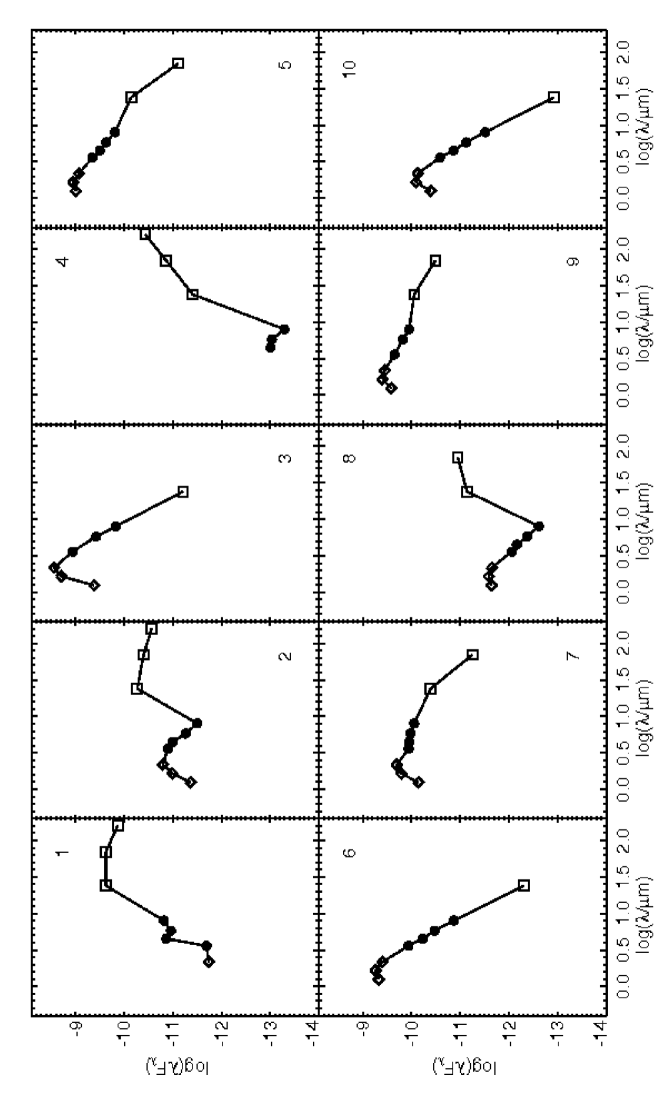
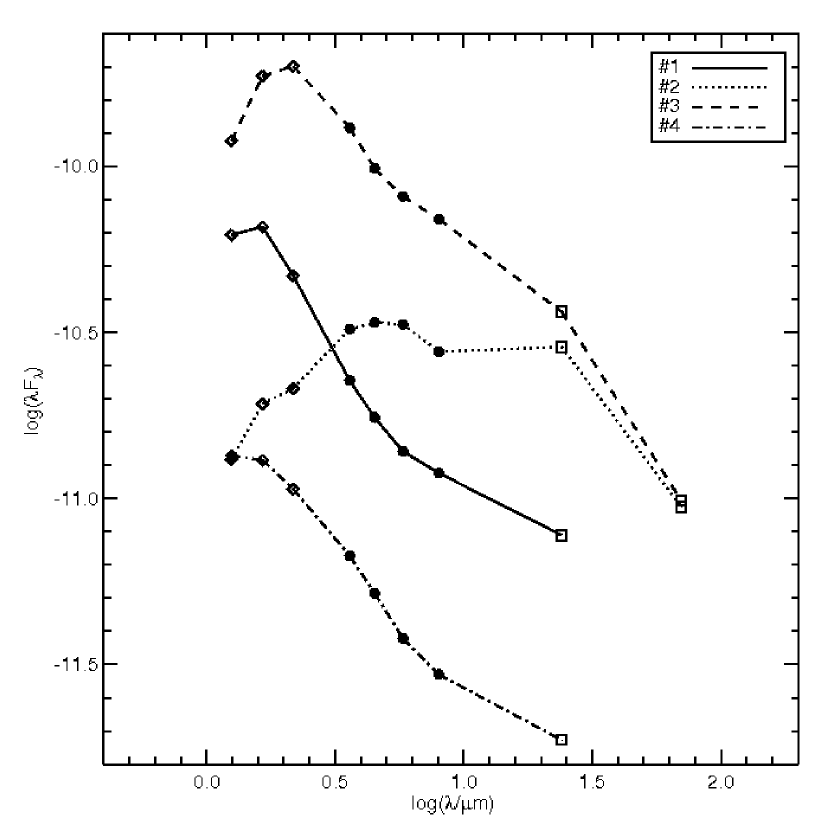
In this Per 6 region, there is a grouping of 10 objects detected at MIPS wavelengths, 8 of which are bright at 24 m, 7 of which are detected at 70 m, and 3 of which are detected at 160 m. Figure 17 contains a 24 m image and a key to object numbers for this discussion, as well as a three-color image using 4.5, 24, and 70 m. SEDs for all of these Per 6 components can be found in Figure 18. There is a diversity of SED types present here, ranging from apparent photospheres, to Class 0 candidates. Additionally, there are 8 objects in this region with similar SEDs, which are very faint at all available bands and undetected by 2MASS; these objects are most likely background galaxies, so they are not included in the subsequent discussion here.
All of the bright objects are located within a region (0.8 0.2 pc at a distance of 250 pc). The positions of the Ladd et al., Olmi et al., and Hatchell et al. cores are coincident with source #1, the brightest 24 m source in the grouping, so we will refer to this new aggregate of young objects as “near Per 6,” or simply “Per 6.”
Enoch et al. (2006) found three cores here, one of which, Bolo 60, is coincident with source #1. Core Bolo 62 is coincident with source #4, and the core Bolo 61 is not coincident with a 24 m source; it is about an arcminute southwest of #2 and about an arcminute west of #3. Texture in the mm map from Enoch et al. reveals additional structure in the extended dust continuum emission that threads between sources 2 and 5, curving back around to #9; a similar structure can be seen in the 160 m emission.
The brightest object at 24 m, object #1, can be identified with IRAS 03271+3013, which was seen in Aspin (1992) as a bipolar outflow source, and listed in Ladd et al. (1993) as a young object. It is a point source in all three MIPS wavelengths, but has “cometary” morphology in IRAC, such that there is diffuse emission coming off of one side of the IRAC source (see Fig. 17). J06 finds that deeply embedded objects often have extended emission in 1 or more IRAC bands, lending support to the idea that this object is deeply embedded. This object is bright enough to be detected at all 3 MIPS bands; see Figure 18. Most of the energy is being emitted at the longest wavelengths, consistent with an embedded very young object. It is one of the reddest dozen objects seen in Fig. 8 with [24]9.7 mag, and also one of the reddest objects seen in Fig. 10 with [70]15 mag. It does not have a smooth SED at IRAC wavelengths, possibly because the image is slightly extended, which leads to errors in our PSF-fitting photometry. As mentioned above, the position for this object is consistent with cores measured at long wavelengths such as the millimeter continuum observations in Enoch et al. (2006).
The position for IRAS 03273+3018 is consistent with both the position given in the literature for HH 369 and with our Spitzer detection #2. The position given for HH 369 (Alten et al. 1997) is 4 north of the MIPS position. The object found at this location is a point source at MIPS wavelengths, but slightly extended in IRAC-2, as can be seen in Figure 17. The position given for HH 369 is in the direction of a slight extension of the IRAC image, but still within the extent of the object as seen in Figure 17. The SED for this object, as can be seen in Figure 18, includes all three MIPS bands, and has most of the energy being emitted at the longer wavelengths. The shape of the SED at the long wavelength end is consistent with being composed of photosphere plus strong long wavelength excess, consistent with a YSO seen only via scattered light at short wavelengths. Source #2 is thus presumably the protostar driving the HH 369 outflow.
Object #4 has no known literature counterpart. It is the third (of 3) objects in this aggregate detected at all three MIPS bands. It has a very steep SED (Fig. 18), with only marginal detections at the three longest IRAC bands, and no IRAC-1 or 2MASS counterparts at all. This SED resembles that found for IRAS 03282+3035, discussed below in §4.2 and in J06 as an outflow-driving source, except that this SED does not level off by 160 m. This is evidently a deeply embedded object. The similarities between the morphology at IRAC bands and the SED of this object and IRAS 03282+3035 suggests that this new object may also be a Class 0 object.
Object #5 can be identified with IRAS 03275+3020, which is optically visible as GSC 02342-00390 and the ASCA X-ray source AX J0330.5+3030 (Yamauchi et al. 2001). Yan et al. (1998) identify this object as a Class I object; Yamauchi et al. identify their X-ray detection with the IRAS source and classify it as a T Tauri object. The SED that can be seen in Fig. 18 suggests that it is certainly a Class II object.
Object #9 is consistent with the position for IRAS 03276+3022, which appears in Ladd et al. (1993) as a candidate young object. This same object is identified with LkHa 326 and HBC 14 (Casali & Eiroa 1996), an emission line star in Liu et al. (1980), and even a candidate AGN (de Grijp et al. 1987). Based on the SED seen in Fig. 18, we suggest it is an embedded young object, perhaps a Class II.
Objects #7 and 8 also have no known literature counterparts. Object 7 has an SED consistent with that for a young and/or embedded Class II object. Object 8 has an SED where most of the energy is emitted at the longer wavelengths, suggesting a classification similar to object #2 in this same aggregate.
Objects #3, 6, and 10 are all consistent with photospheres, with no known counterparts in the literature. They are distributed along the ridge of 160 m emission, suggesting that they are Perseus members. The Wainscoat (1992) galactic starcount models predict a 70% chance that a background source with a 24 m flux density as faint as object #10 should randomly fall within the area of the Per 6 aggregate. While this object is probably not a Perseus member, the same analysis gives probabilities of just 20% and 3% that objects #6 and 3 are part of the background galactic population. Object #3 has the highest extinction of these three, with an estimated of 15 mag; object #6 has of about 4 mag; and object #10, 9 mag.
There are at least two different possible methods of classification of the objects in this aggregate. Based on the [24] color, three objects (#1,2,8) are Class I, three objects (#5,7,9) are Class II, and three objects (#3,6,10) are Class III. The remaining object (#4) is not detected at . Alternatively, we can classify objects based on a value of fit to the SED between and 24 m, following the original Greene et al. (1994) classification scheme, where 0.3 is Class I, is “flat spectrum,” is Class II, and is Class III. Using this classification, four of the objects (#1,2,4,8) are Class I, none are “flat spectrum” objects, three objects (#5,7,9) are Class II, and three objects (#3,6,10) are Class III. The objects with available classifications based on [24] color have the same classification using an fit to the entire available SED.
This aggregate, while it spans 0.2 pc in the narrow dimension, is 0.8 pc in the long direction, larger than the average core size of 0.08 pc found by Enoch et al. (2006). Objects 2, 3, 4, and 6 and a millimeter continuum core without a 24 m counterpart from Enoch et al. (2006) are all within (0.2 pc); even this subgroup has a diversity of SEDs. An apparently starless millimeter continuum core and two of the most embedded objects in this aggregate are found in close proximity to two of the least embedded.
4.1.2 IRAS 03388+3139 stellar aggregate
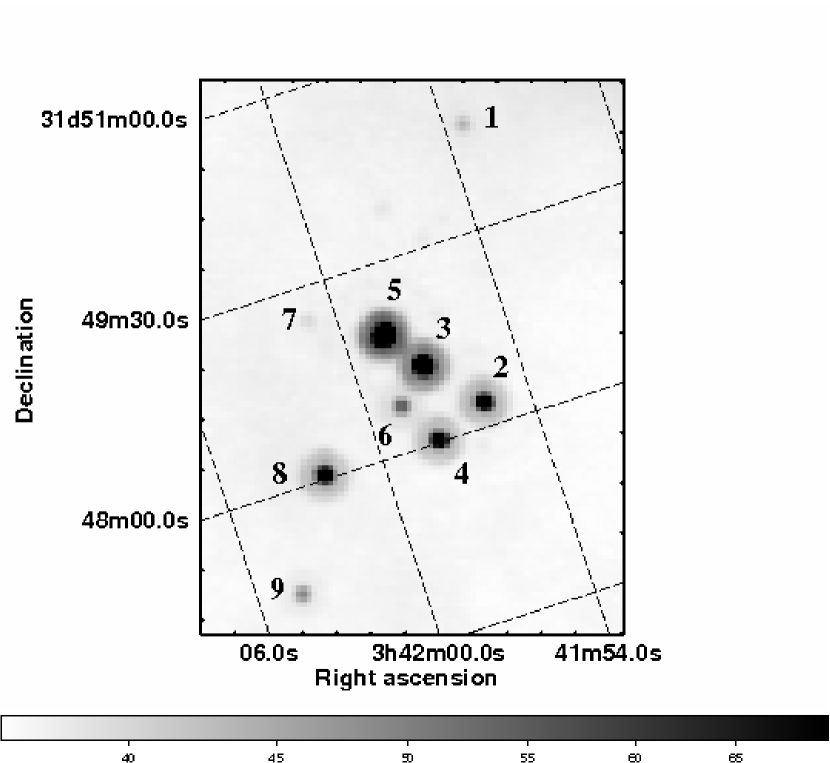
IRAS 03388+3139 was seen by IRAS as a single object, but MIPS reveals that there are actually at least 9 objects seen at 24 m here within a region 90 in diameter (0.1 pc at a distance of 250 pc); see Fig. 19. The location of the original IRAS source is between sources #3 and 5 in this finder chart; the positional uncertainty encompasses both objects. This object also appeared as seen by MSX in Kraemer et al. (2003; it is listed as G160.2784-18.4216 and J034158.34+314852.6). There are no cores found by Enoch et al. (2006) or Hatchell et al. (2005) in this region.
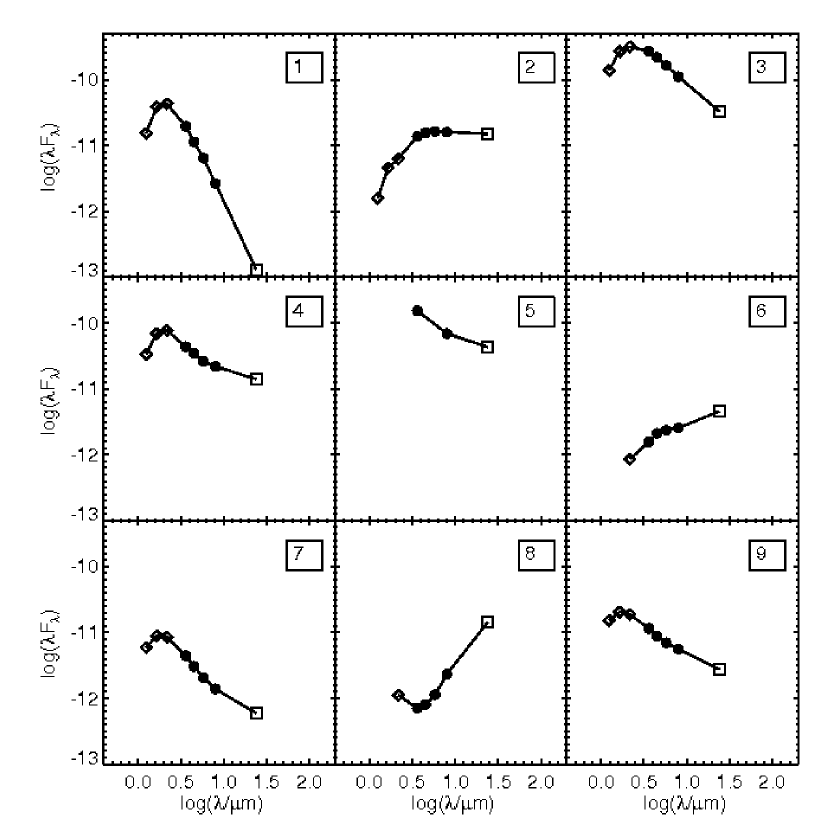
As in Per 6, this aggregate of objects displays a striking variety of SEDs within this small region; see Figure 20. Some objects resemble photospheres, most with long-wavelength excesses (1, 3, 4, 7, 8, and perhaps 5, if we had unsaturated ), and some (2, 6, 8) are clearly more deeply embedded. None of the objects is detected at 70 or 160 m. Despite this, object 8 is one of the reddest dozen objects in Fig. 8 with [24]9.7 mag. Object #1 is the faintest of the group, with a nearly photospheric SED and an inferred 11 mag. The Wainscoat (1992) models assign a 16% probability that a background source with the 24 m flux density of Object #1 would be found within the area of the aggregate.
As above, there are at least two different ways to classify these objects. A [24] color is available for all but one of the objects; three objects (#2,6,8) are Class I, four objects (#3,4,7,9) are Class II, and the last (#1) is Class III. Based on a fit to the SED between and 24 m, similar classifications are obtained (only #2 changes classification) – two Class Is (#6,8), one flat spectrum (#2), five Class IIs (#3,4,5,7,9), and one Class III (#1).
4.1.3 IRAS 03281+3039 stellar aggregate
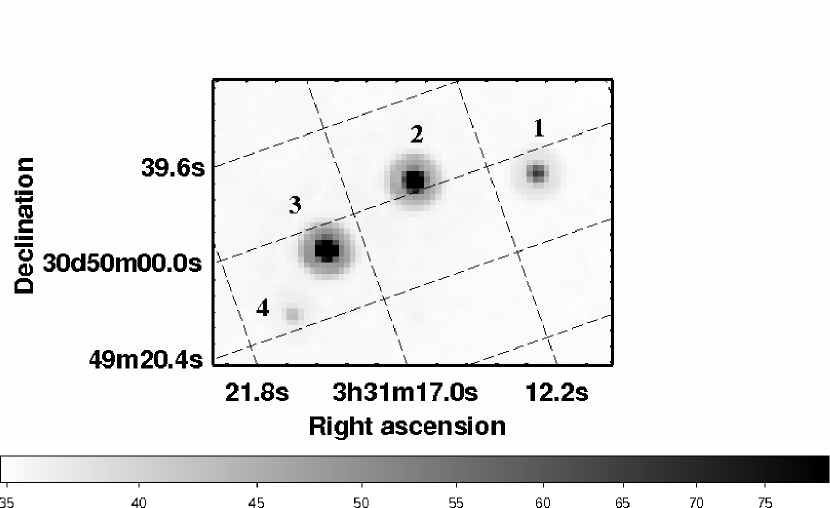
IRAS 03281+3039 is another object that, when viewed by MIPS, is resolved into multiple sources; see Figure 21. (This object was also mentioned by J06; this aggregate of stars is located along the ridge of molecular emission between B1 and the Per 6 cluster discussed above.) There are four components to this object seen at MIPS-24 (2 of which are also seen at 70 m) within 120 diameter, or 0.15 pc at a distance of 250 pc. The IRAS position is located at a position equidistant from the three brightest objects seen in Figure 21, with a position uncertainty nearly reaching across from source 1 to 3. There are no cores found by Enoch et al. (2006) or Hatchell et al. (2005) in this region.
As mentioned in J06, de Grijp et al. (1987) lists this as an AGN candidate, but we suspect, based on the SEDs seen in Figure 22, that it is instead a small grouping of young stars. Objects 1, 3, and 4 look like photospheres plus circumstellar dust; object 2 seems to be the most embedded. As above, there are several different ways to classify these objects. The classifications based on [24] and on a fit to the SED between and 24 m produces identical classifications; all are Class II, except #2, which is a flat spectrum object.
Objects 1 and 3 can be identified with emission line stars in Liu et al. (1980). HH 770-772 can be seen in this vicinity in the IRAC-2 image, suggesting recent jet activity in this area. On the whole, these objects appear to be less embedded than the objects from IRAS 03388+3139 or Per 6 above. The inferred for these objects ranges from 6 to 12 magnitudes.
4.1.4 Comments on the aggregates
Three new aggregates of young stars have been discussed above. In all three cases, follow-up data will be required to better define their SEDs, establish their multiplicity, and measure their spectral types and presence of accretion diagnostics. However, the facts that most of the sources are bright at 24 m, that they have high inferred extinctions, and that they have infrared excesses reminiscent of known YSOs suggest that they are indeed YSOs. They are all in close clumpings (within 0.1 pc444IRAS 03388+3139 is 0.1 pc, IRAS 03281+3039 is 0.15 pc, and Per 6 is pc, larger than 0.1 pc, but there is diversity of SEDs found even within a subgroup of size 0.2 pc. Therefore, we are taking their typical size to be on the order of 0.1 pc, not 1 pc.); these and other similar groupings can be seen in the full Perseus map (Fig. 2), usually following the filamentary structure found in the 160 m emission (Fig. 5). A similar spatial relationshop between strings of young stars and molecular cloud filaments has also been seen in NGC 2264 (Teixeira et al. 2006). The typical nearest-neighbor distances within the aggregates are 0.08, 0.04, and 0.05 pc for Per 6, IRAS 0338+3139, and IRAS 03281+3039 (respectively) - very similar to the 0.08 pc spacing found in NGC 2264 “spokes cluster” which Teixeira et al. (2006) identify with the Jeans length for thermal fragmentation of the molecular cloud filaments.
Each of the Perseus aggregates contains objects in close physical proximity and with a wide diversity of SEDs. In this, they are reminiscent of the L1228 South aggregate identified in Spitzer data by Padgett et al. (2004), where highly embedded objects, objects with substantial disks, objects with debris disks, and photospheres were all found in an aggregate of nine bright 24 m sources within a region of 1 pc. The potentially youngest object found in the Perseus aggregates is a cold millimeter continuum core from Enoch et al. (2006). The earliest class of object seen at 24 m is Class I. The latest class found in these aggregates is Class III. This wide range of circumstellar environments present within a compact (and presmably related) group of young stars raises interesting questions about star formation and circumstellar disk evolution.
There are two possible formation scenarios that could account for the diversity of SEDs in these aggregates. The first is that every source spends a relatively fixed fraction of its life in each of the class 0, I, II, and III phases of protostellar evolution. In this scenario, the observed diversity of SEDs would require a significant age spread among the members of the aggregates. The second possibility is that the aggregate members formed at roughly the same time (i.e., are coeval), and that the process of circumstellar evolution proceeds at very different rates in different objects – such that some members to evolve into class III sources over the same timescale at which others remain class I objects.
In the first scenario, if the aggregate members objects all started with similar initial conditions of mass, angular momentum, and initial cloud temperature (which is not unreasonable to assume, given their physical proximity), then to have both Class I objects and Class III objects in the same region requires some stars to be Myr old and some to be 1-5 Myr or possibly as much as 10 Myr old, assuming the the canonical ages for objects in these SED classes (e.g., Bachiller 1996). If the Class III objects are not truly associated, leaving us with the Class IIs, then the oldest ages of objects in these aggregates are Myr old, taking the longest disk lifetimes to be between 1 and 5 Myr (see, e.g., Cieza et al. 2006, Rebull et al. 2004, and references therein).
On the other hand, if all of the objects were formed at very nearly the same time, which is also not unreasonable to assume based on their physical proximity, then there is a real diversity of evolutionary timescales for the various classes. A Class I object is often assumed to be much younger than a Class III object, and the timescale for the Class I to Class III transition is usually taken to be long compared to the timescale for the transition from Class 0 to Class I. In order for these clumpings of stars to be the same age, the evolution of circumstellar matter around some objects must be fast, with the timescale to evolve from Class 0 to Class I comparable to the shortest possible time to evolve from Class 0 to Class III. Influences such as the system inclination, local stellar density and interactions between systems, initial disk mass (e.g., Beckwith et al. 1990), mass accretion rate and history (e.g., Calvet et al. 2005), initial core/clump and stellar rotation rate, and/or close binaries could all affect the disk/envelope dissipation timescale. An obvious follow-on investigation is an assessment of stellar multiplicity in the aggregates – if the class III objects are preferentially binary, this could explain their more rapid circumstellar evolution.
Other authors are beginning to suggest that some stars can lose their disks quickly (e.g., Silverstone et al. 2006). Recent work (e.g., McCabe et al. 2006, Prato et al. 2003 and references therein) have found PMS binary components in different states of disk evolution (such as a Class II paired with a Class III), and in those cases, the evidence for the stars being exactly the same age is much stronger than the circumstantial evidence for the Perseus aggregates. It is therefore plausible that the aggregate members could be coeval and also display a wide range of disk and envelope properties.
In any case, the observational evidence we present here is that objects of at least Class I (if not younger) to at least Class II (if not Class III) are located within close proximity (0.1 pc) to each other. Additional multi-wavelength follow-up studies of these groupings of stars in Perseus (and elsewhere) will shed light on the issues raised by this result.
| SSTc2d name | MIPS-24 (mJy)aaAbsolute uncertainties on the 24 m data are estimated to be 10-15%; statistical uncertainties are much less than this. Uncertainties on 70 and 160 m flux densities are estimated to be 20%. | MIPS-70 (mJy)aaAbsolute uncertainties on the 24 m data are estimated to be 10-15%; statistical uncertainties are much less than this. Uncertainties on 70 and 160 m flux densities are estimated to be 20%. | MIPS-160 (mJy)aaAbsolute uncertainties on the 24 m data are estimated to be 10-15%; statistical uncertainties are much less than this. Uncertainties on 70 and 160 m flux densities are estimated to be 20%. | other names | notes |
|---|---|---|---|---|---|
| new aggregate near Per 6 | |||||
| 033015.1+302349 | 1900.0 | 5499 | 7170 | IRAS 03271+3013 | #1 in §4.1.1 |
| 033027.1+302829 | 431.0 | 920 | 1450 | IRAS 03273+3018, HH 369 | #2 in §4.1.1 |
| 033030.2+302708 | 48.9 | … | … | #3 in §4.1.1 | |
| 033032.7+302626 | 31.1 | 320 | 1960 | #4 in §4.1.1 | |
| 033035.9+303024 | 572.0 | 180 | … | IRAS 03275+3020,GSC 02342-00390, AX J0330.5+3030 | #5 in §4.1.1 |
| 033036.7+302735 | 3.9 | … | … | #6 in §4.1.1 | |
| 033036.9+303127 | 322.0 | 130 | … | #7 in §4.1.1 | |
| 033038.2+303211 | 57.5 | 260 | … | #8 in §4.1.1 | |
| 033044.0+303246 | 699.0 | 750 | … | LkHa 326=HBC 14 =IRAS 03276+3022 | #9 in §4.1.1 |
| 033054.5+303146 | 1.0 | … | … | #10 in §4.1.1 | |
| IRAS 03388+3139 stellar aggregate | |||||
| 034155.0+314939 | 1.0 | … | … | #1 in §4.1.2 | |
| 034155.7+314811 | 120.0 | … | … | #2 in §4.1.2 | |
| 034157.4+314836 | 264.0 | … | … | #3 in §4.1.2 | |
| 034157.7+314800 | 112.0 | … | … | #4 in §4.1.2 | |
| 034158.5+314855 | 345.0 | … | … | #5 in §4.1.2 | |
| 034158.6+314821 | 36.5 | … | … | #6 in §4.1.2 | |
| 034201.0+314913 | 4.8 | … | … | #7 in §4.1.2 | |
| 034202.1+314801 | 115.0 | … | … | #8 in §4.1.2 | |
| 034204.3+314711 | 22.2 | … | … | #9 in §4.1.2 | |
| IRAS 03281+3039 stellar aggregate | |||||
| 033110.7+304940 | 62.0 | … | … | LZK 19 | #1 in §4.1.3; mentioned in J06 |
| 033114.7+304955 | 229.0 | 220 | … | #2 in §4.1.3; mentioned in J06 | |
| 033118.3+304939 | 292.0 | 230 | … | LZK 20 | #3 in §4.1.3; mentioned in J06 |
| 033120.1+304917 | 15.0 | … | … | #4 in §4.1.3; mentioned in J06 | |
| objects detected at all 3 MIPS bands | |||||
| 032509.4+304622 | 2000.0 | 2600 | 2640 | LDN 1448 IRS 1 | discussed briefly in J06; see §4.2 |
| 032637.4+301528 | 400.0 | 3900 | 7880 | IRAS 03235+3004 | discussed in J06 |
| 032743.2+301228 | 761.0 | 8190 | 17900 | LDN 1455 IRS 4 | discussed in J06 |
| 032747.6+301204 | 1620.0 | 1900 | 8130 | IRAS 03247+3001, L1455 IRS 2 | discussed in J06; see §4.2 |
| 032834.5+310051 | 1290.0 | 2700 | 2660 | IRAS 03254+3050 | see §4.2 |
| 032845.3+310541 | 215.0 | 1600 | 2750 | HH 340 | see §4.2 |
| 032951.8+313905 | 49.3 | 2200 | 4990 | IRAS 03267+3128 | see §4.2 |
| 033015.1+302349 | 1900.0 | 5499 | 7170 | IRAS 03271+3013 | see #2, §4.1.1 |
| 033027.1+302829 | 431.0 | 920 | 1450 | IRAS 03273+3018, HH 369 | see #5, §4.1.1 |
| 033032.7+302626 | 31.1 | 320 | 1960 | … | see #7, §4.1.1 |
| 033121.0+304529 | 14.6 | 3800 | 9660 | IRAS 03282+3035 | discussed in J06 |
| 033218.0+304946 | 13.1 | 1800 | 10700 | IRAS 03292+3039 | discussed in J06 |
| 033925.5+321707 | 234.0 | 3400 | 8170 | 2MASS 03392549+3217070, IRAS 03363+3207 | see §4.2 |
| 034548.2+322411 | 2250.0 | 5265 | 3350 | LkHa 330 | discussed in Brown (2007) |
| 034611.0+330848 | 19.5 | 330 | 1420 | 2MASS 03461106+3308488 | galaxy |
| 034705.4+324308 | 587.0 | 1000 | 1880 | IRAS 03439+3233, B5 IRS 3 | discussed in J06; see §4.2 |
| Other individual point sources | |||||
| 032548.9+305725 | 197.0 | 290.0 | … | LZK 5 | §4.5 |
| 032533.2+305544 | 64.8 | 86.0 | … | LZK 2 | §4.5 |
| 032552.8+305449 | 64.5 | … | … | … | §4.5 |
| 032548.1+305537 | 100 | 1200.0 | … | BD+30540, SAO 56444, IRAS 03227+3045 | |
| 033955.6+315533 | 62.5 | … | … | HD 278942, IRAS 03367+3145 | §4.4 |
4.2 Objects detected at all 3 MIPS bands
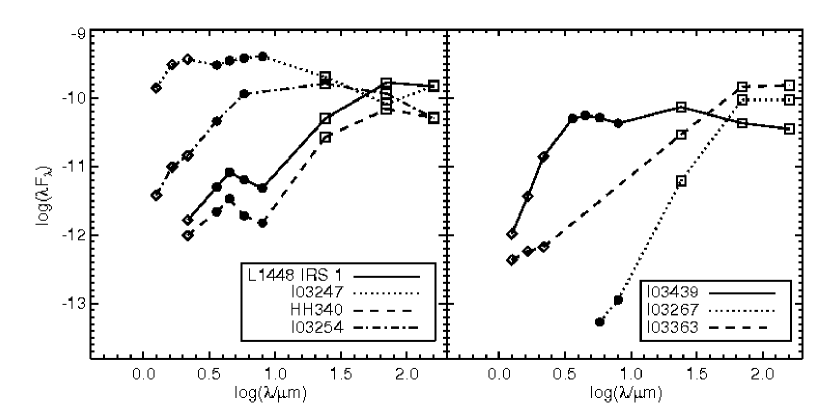
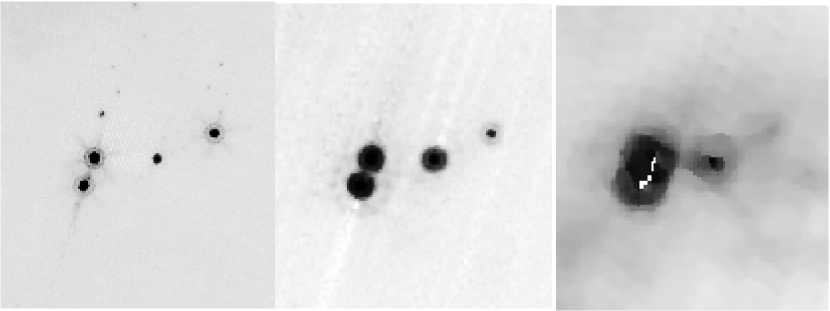
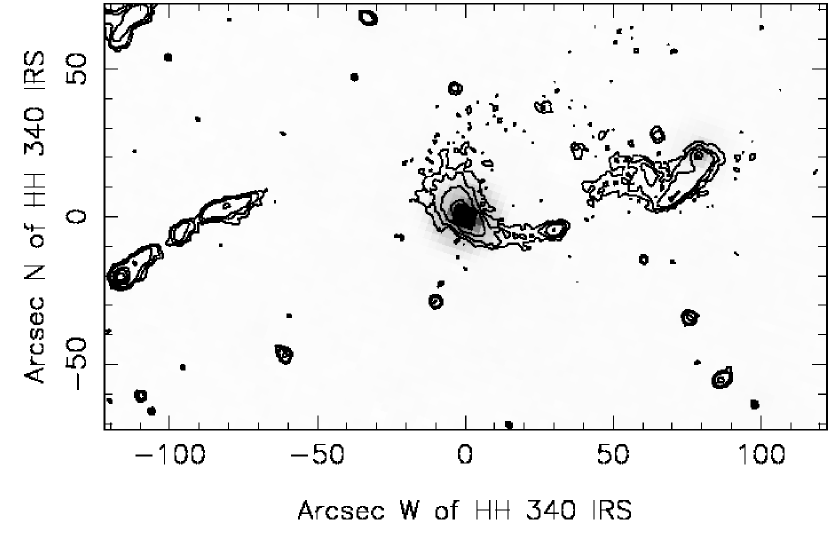
While there are many objects detected at all four IRAC bands, or even all four IRAC bands plus MIPS-24, there are few objects detected at all three MIPS bands. Objects detected at all three MIPS bands are likely to be quite interesting because they are likely to be the most embedded; moreover, if they are detected at 70 and 160 m using our observing strategy, they are among the brightest objects in the region, and therefore most likely cloud members. In this section, we discuss the 16 objects in our catalog detected at all three MIPS bands. Many of these objects have already been discussed (and had SEDs presented) in J06 or above in §4.1.1. For completeness and ease of reference, all of these objects appear in Table 6 under “objects detected at all three MIPS bands” even if they have already appeared under the “Per 6 aggregate” heading or in J06. Because objects were detected in all 3 bands throughout our large map, for lack of a better approach, we discuss these objects in approximately RA-order (the same order as they appear in Table 6), although we start with all of the objects discussed by J06. J06 considered the colors of deeply embedded sources, and several Class I/II objects mentioned there did not have SEDs, so they appear here. The objects are portrayed by position in Figure 13. We investigated the SED and the morphology of each object individually in all our available wavelength regimes (2MASS through 160 m).
J06 has a discussion of the objects in the L1448 region, including full SEDs of the embedded Class 0 objects (L1448-C and L1448-N) and images of the outflows. The complex morphology here makes it occasionally difficult to extract the point sources from their outflows. L1448-C is clearly broken into two pieces in the IRAC images. L1448 IRS 1 is just off the edge of the 4-channel IRAC map, and so was not included in detail. The full SED for L1448 IRS 1 (including the 2 IRAC bands which observed it) is presented for the first time including Spitzer points in Figure 23; indeed, it is a deeply embedded object, as expected from earlier observations. Images of this region in all three MIPS bands are striking; see Figure 24. The southernmost bright 24 m source in the image is L1448-C (L1448-mm). Where IRAC sees two objects here, only one of which is associated with the mm source (J06), MIPS-24 clearly also sees two sources. The object detected at MIPS-70 also appears to be extended. Moving north from this object, we find L1448-N (L1448 IRS 3). MIPS-24 also marginally resolves L1448-N(A) from L1448-N(B); the “B” component is substantially fainter than the “A” component, consistent with results from Ciardi et al. (2003). These objects are not resolved at 70 m. At 160 m, all of the IRS-3 components are combined into one saturated blob. Moving westward from L1448 IRS 3, we encounter L1448 IRS 2 and then 1. Both of these objects appear point-like in MIPS-24 and -70. There is a slight extension in MIPS-160 towards IRS 3. IRS 1 is faint at MIPS-160, but detected. Because IRS 2 and 3 are at least slightly resolved in at least 1 band, they do not appear in Table 6; IRS 1 is a point source in all three bands, and so it does appear in the Table. IRS 1 is one of the bluest two objects in [24][70] colors in Fig. 11.
J06 also includes a discussion of objects from L1455, including matching of outflows to driving sources. J06 finds the three previously-known YSOs (L1455 IRS 1,2, and 3), but also identifies new infrared sources, including one named L1455 IRS 4, a candidate Class I object. IRAS 03235+3004 is also identified in this region as a candidate Class I object. In IRAC, IRS 4 is undetected at the shorter two IRAC bands. SEDs appear for both of these objects in J06; both of them are detected at all three MIPS bands and so appear in Table 6. IRAS 03235+3004 is one of the reddest objects in Fig. 10 with [70]15 mag. L1455 IRS 2 (IRAS 03247+3001) is also seen at all three MIPS bands. This less-embedded Class II did not have an SED in J06, and so it appears in Figure 23 (abbreviated ‘I03247’). IRAS 03247+3001 is one of the bluest two objects in [24][70] colors in Fig. 11.
The remaining objects detected at all three MIPS bands that are discussed in J06 with SEDs are IRAS 03282+3035 and IRAS 03292+3039, both of which are outflow-driving sources on the B1 ridge. The MIPS flux densities for these candidate Class 0 objects simply appear in Table 6; for SEDs and much more discussion, please see J06. Both of these objects have faint nebulosity around them in at least one of the IRAC bands. For completeness, we note that IRAS 03282+3035 and IRAS 03292+3039 are two of the five reddest objects in Fig. 11 with [24][70]7 mag.
Returning to our roughly RA-order discussion, the next object in Table 6 is IRAS 03254+3050. Another object similar in morphology with detections in all three MIPS bands is IRAS 03439+3233 (also known as B5 IRS 3). Both of these objects appear to be point sources at all available Spitzer bands, both IRAC and MIPS. SEDs for these objects, abbreviated “I03254” and I03439” respectively, appear in Figure 23. These SEDs are consistent with those for typical Class I sources, and indeed, both have already been identified as such in, e.g., Ladd et al. (1993).
Searching in the literature by position for our objects detected at all three MIPS bands, we find one listed as HH 340 (Bally et al. 1996). The SED for this object appears in Figure 23; a multi-wavelength image of HH 340 appears in Figure 25. The SED for this object resembles that of the object discussed in §4.1.1 as being identified with HH 369, with most of the energy being emitted at the longest wavelengths. The overall shape of the SED is also consistent with the flux at the shortest wavelengths being scattered light (such as would be found in edge-on disks). Because we are not aware of jets or knots of ISM alone possessing these properties, we suspected that this object is not truly an HH object, but rather a protostar in its own right, perhaps with shocked emission close to the central object. Indeed, others, including Hodapp et al. (2005), have already come to this same conclusion, that HH 340 is actually a jet-driving source. Hodapp et al. identify the driving source with IRAS 03256+3055; they find a bipolar jet of S-shaped morphology, very similar to that seen in our IRAC images (Fig. 25). Young et al. (2003) identify this object as a Class I. This object, and HH 369, appear point-like in MIPS bands (see Fig. 25), but slightly extended at IRAC bands555Note that flux densities in the IRAC bands for this and other similar objects may not appear in the 2005 c2d catalog at IRAC wavelengths because the objects are extended; flux densities from the 2005 c2d catalog were compared with those obtained using extremely simple aperture photometry to approximate the flux density, and the best apparent value is plotted here and for other similar objects in this discussion., consistent with this interpretation. Moreover, this object is located in a region rich with outflows and therefore young, embedded objects, and as such is it reasonable to assume that it could also be a young, embedded object. This object is also one of the reddest dozen objects in Fig. 8 with [24]9.7 mags, and also one of the reddest objects in Fig. 10 with [70]15 mag.
One object, IRAS 03267+3128 (abbreviated I03267 in Figure 23), has no 2MASS counterpart at all and is only marginally detected, if that, at IRAC-1 and IRAC-2; by eye, it is difficult to see the object in the IRAC images. An SED for this object can be found in Figure 23. It resembles the SED found for IRAS 03282+3035, discussed as an outflow-driving source in J06, and also that for one of the new objects discussed above in §4.1.1. All of these SEDs steeply rise at the longer wavelengths; the two previously identified in IRAS level off between 70 and 160 m. Because all are faint between 3.5-8 m and undetected in 2MASS, all three are evidently deeply embedded objects. There are clearly outflows in IRAC-2 associated with IRAS 03282+3035, as discussed in J06, consistent with it being a young, embedded object; it is listed as a Class 0 object in Froebrich (2005) (see also, e.g., Barsony et al. 1998 and references therein). The similarities between the morphology at IRAC bands and the SED of this object and IRAS 03267+3128 suggests that IRAS 03267+3128 may also be a Class 0 object.
Returning to our roughly RA-order discussion, the next three objects in Table 6 are IRAS 03271+3013, IRAS 03273+3018, and a new object (SSTc2d 033032.7+302626). These objects are presented as part of the new Per 6 aggregate discussed above in §4.1.1.
The next object in the table, SSTc2d 033925.5+321707, with an SED also portrayed in Figure 23 (abbreviated “I03363”), can be identified with 2MASS 03392549+3217070. The source IRAS 03363+3207 is from this position, with an error ellipse that overlaps the position of our MIPS detection. We therefore conclude that IRAS 03363+3207 probably should be identified with our detection. The shape of its SED is similar to the other young objects discussed here, particularly IRAS 03235+3004, except that it has a faint NIR counterpart where IRAS 03235+3004 does not. This object is is located near the north edge of the large emission ring seen in the extended emission, in a region outside the coverage of our IRAC data, but also in a region of relatively low nebulosity in MIPS-24. It is one of the dozen reddest objects in Fig. 8 with [24]9.7 mag, and also one of the reddest objects in Fig. 10 with [70] 15 mag. This source lies within a small dark cloud about in size, as seen on POSS red plates. It appears to be a single YSO in a relatively isolated cloud core. Follow-up observations are warranted to determine if it is in fact an isolated core.
An object that is bright in all 7 Spitzer bands is LkHa 330; this object is discussed further in Brown et al. (2007), but it is also included in Table 6 for completeness. It is the bluest object in [70][160] colors in Fig. 11.
We expected that none of the objects detected in 160 would be extragalactic; the sensitivity of our 160 m survey is such that it is really only likely to probe galactic objects, e.g., cluster members. The last of the objects detected at all three bands appears to be new (e.g., nothing appears in SIMBAD at that position). It is near the edge of the large MIPS map and has no IRAC coverage; it is identified with 2MASS source 03461106+3308488. It is one of the reddest four sources in [70][160] colors in Fig. 11. By inspection of the 24 m image, it is elliptical in MIPS-24, and appears by eye to be a very marginal detection at MIPS-160. Looking at this position in the POSS and 2MASS reveals an extended object that seems likely to be a galaxy. We conclude that most of the objects we see at 160 m, those that are bright and not near the far reaches of the map, are likely to be cloud members.
4.3 HD 281159 (BD+31643)
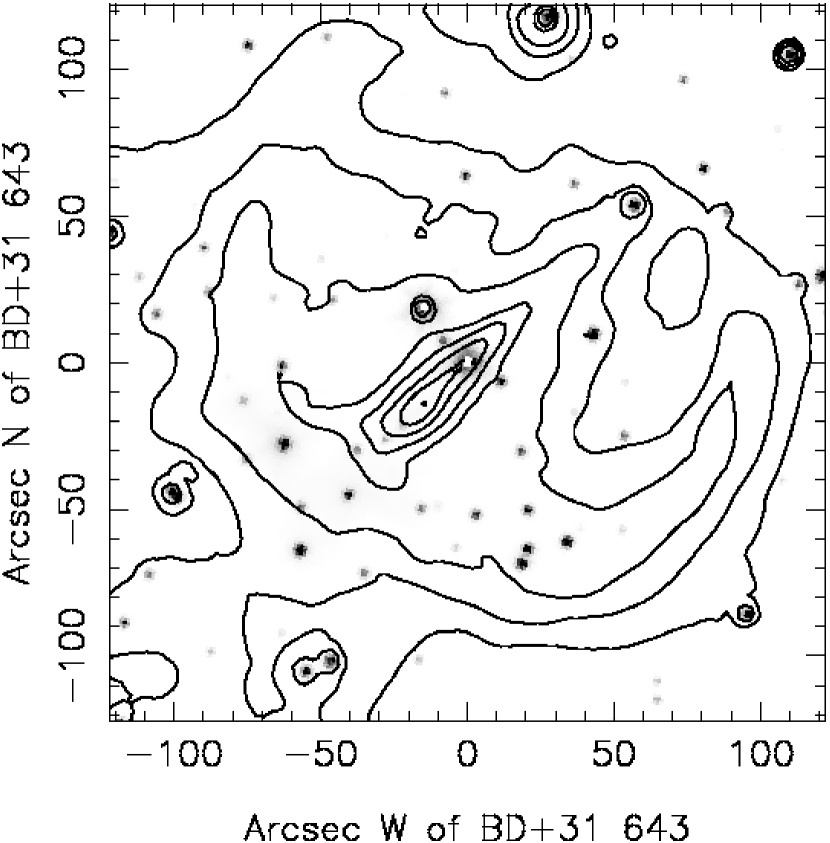
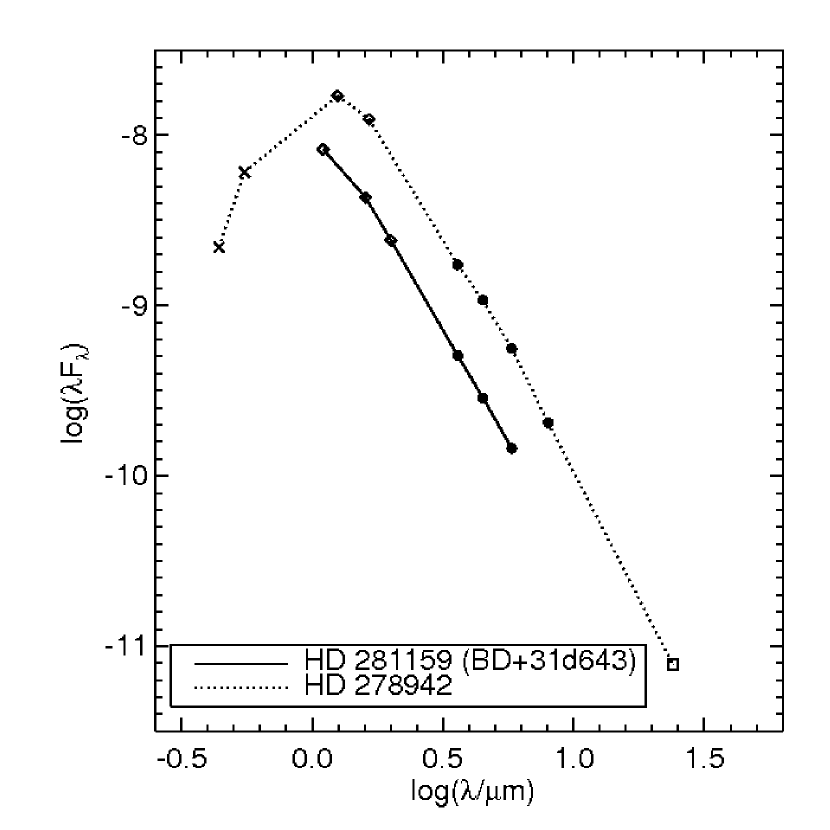
HD 281159 (BD+31643) is a B5 star primarily responsible for illuminating the IC 348 reflection nebula (Witt and Schild 1986), and is a 0.47 binary (Alzner 1998). Optical coronagraphic images by Kalas and Jewitt (1997) detected a bright linear feature within the IC 348 nebulosity, centered on HD 281159 and with diameter 40, and suggested this might be a debris disk seen in scattered light. However, the extent of the linear nebulosity (10,000 AU for = 250 pc) is much larger than the diameters of known debris disks; the nearest IRAS source, IRAS 03414+3200, is offset 28 SE of the stellar position; and the disk has not been confirmed in subsequent Hubble Space Telescope imaging, perhaps because of low surface brightness (Kalas, unpublished; HST GO program 7414).
Spitzer’s view of the region surrounding HD 281159 is shown in Figure 26. The region has a complex combination of stellar point sources and extended emission, with the stars best seen in the 3.6 m IRAC image and the extended emission being especially prominent at 24 m. At lower surface brightness levels, the extended emission has the appearance of an incomplete spherical shell centered on HD 281159, (50,000 AU) in diameter and open toward the northwest. Within the shell, there is a narrow spike of very bright 24 m emission extending from southeast to northwest across the star. This spike is the highest surface brightness feature in the entire Perseus cloud at 24 m, and follows the position angle of the disk-like nebulosity found by Kalas and Jewitt (1997). However, the surface brightness distribution along this spike is highly asymmetric about the star. Along the spike, the surface brightness peak is found 22 southeast of the star; at the same distance on the opposite side of the star, the spike feature is a factor of 4 times fainter. At low surface brightness levels, the spike appears to project as far as 80 northwest of the star, but on the southeast side it terminates only 55 away, near the apparent shell wall. The thickness of the spike is spatially resolved at 24 m, with a FWHM 14 (3500 AU).
Previous work had suggested an infrared excess in HD 281159. The Spitzer SED (Fig. 27) is consistent with a bare stellar photosphere out to 8 m. There is no point source at 24 m, to an upper limit of 50 mJy determined by PSF planting (e.g., adding an artificial point source to the MIPS image at the stellar position, and determining the smallest flux normalization at which it remains clearly visible). The source is undetected at 70 m or in the submillimeter continuum (Enoch et al. 2006). Previous ISO-SWS observations made in 1997 (Merín 2004) showed a non-negligible infrared excess starting at 4 m. To compare that observation with the Spitzer measurements, we convolved the SWS spectrum from the ISO Data Archive (TDT#65201414, pipeline version 10.1) with the Spitzer IRAC and MIPS filter passbands. The ISO flux densities are consistent with the Spitzer ones except at 8 and 24 m, where the ISO ones are much higher. We attribute the discrepancy to the bright extended emission around the source at 8 and 24 m (Figure 26), which should have strongly contaminated the ISO measurements in the large entrance aperture of SWS.
The infrared properties of the region around HD 281159 are very difficult to reconcile with a circumstellar debris disk. The star has no clear infrared excess. For a central luminosity of 1600 , 24 m thermal emission from a disk should peak at radii near 200 AU – i.e., within 1 of the star. While a spike-like feature corresponding to the proposed disk structure is present at 24 m, its strong asymmetry is inconsistent with a centrally heated circumstellar disk. The spike feature’s length at 24 m is 3 times larger than its reported optical size, exacerbating the size discrepancy between it and known debris disks. To the southeast, the resolved thickness of the spike corresponds to an opening angle of 35 as seen from the star – much larger than would be expected for a disk close to edge-on.
What is the distribution of material in the region around HD 281159? An extended disk appears very unlikely in the light of the Spitzer results. Nevertheless, the star is still likely to be the illuminating source of the surrounding region in both scattered light and 24 m emission. HD 281159 is likely another example of a Pleiades-like phenomenon, where an interstellar cloud illuminated by a high luminosity star mimics some properties of a circumstellar disk. Kalas et al. (2002) report six similar objects. In this case, the star appears to be clearing a cavity in surrounding molecular cloud material. The spike feature would appear to be some kind of filamentary interstellar cloud structure crossing behind or in front of HD 281159, and passing closest to the star on its southeast-projected side. Filamentary structures are expected to form during magnetically-mediated collapse of interstellar clouds, and can be seen at lower surface brightness levels in other parts of Perseus (such as around HD 278942; see Fig. 28). In the case of HD 281159, such a structure is located very near a luminous star, and coincidentally projected across it.
4.4 HD 278942
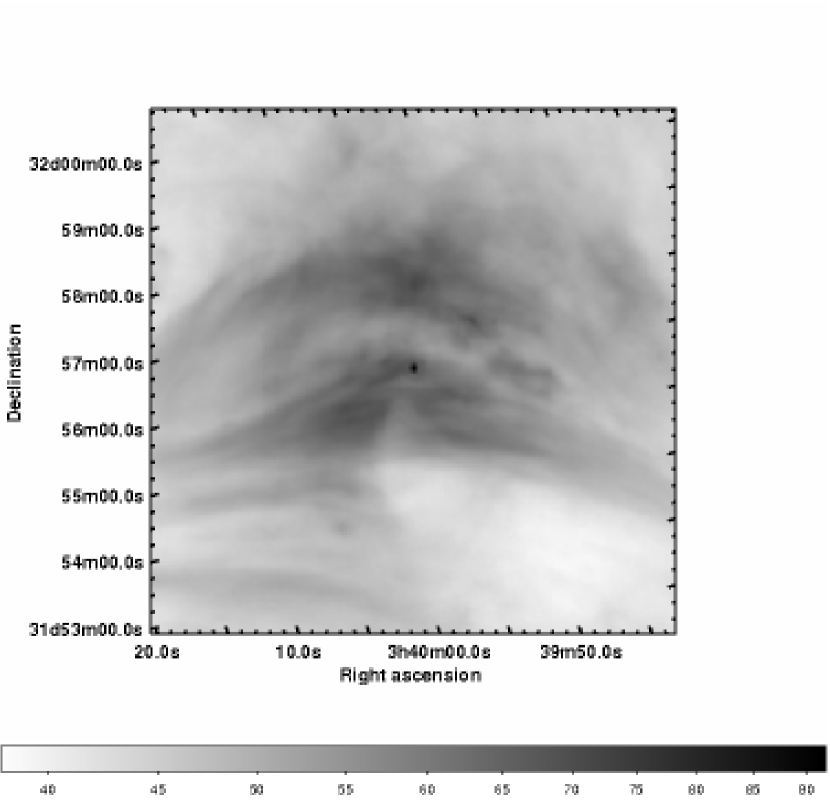
HD 278942 (IRAS 03367+3145) is a B0 V star about 1 West of IC 348. It lies at the center of a large, bright ring of extended mid-infrared emission first identified by IRAS. The ring structure is clearly seen in our 24 m image mosaic, and extends well outside the =2 extinction contour used to define the c2d map region (see Fig. 2-5, Fig. 15, and Sec. 3.5). Studies of the ring by Andersson et al. (2000) and Ridge et al. (2006) suggest that it may represent a weak H II region excited by HD 278942, and located just behind the Perseus molecular clouds.
The 24 m image of the region (see Figure 28) shows that HD 278942 lies at the center of a bright striated region of extended emission more than 0.5 in diameter. The emission surrounding this source appears extremely “blue” to MIPS (see Fig. 5), meaning that relative to the rest of the Perseus extended emission, this location is much brighter at 24 m than at 70 or 160 m. The star stands out as an isolated point source against this mid-infrared nebulosity; there is no sharp peak in the nebula surface brightness around the stellar position. This “detached” relationship between the star and nebulosity indicates that extended warm dust is not distributed within a filled circumstellar volume. Instead, it appears that the illuminated dust represents a cloud surface that is offset a considerable distance from the star, consistent with previous arguments that the HD 278942 lies behind the main Perseus cloud complex.
The bright extended emission surrounding HD 278942 makes it difficult to isolate the stellar fluxes in lower resolution mid-infrared datasets such as IRAS and MSX. The IRAS data suggested a strong 25 m excess, and led Andersson et al. (2000) to suggest that the star possessed a circumstellar debris disk. Spitzer flux density measurements, obtained using PSF fitting photometry, are shown as a spectral energy distribution in Figure 27. The star is undetected at 70 and 160 m, and shows a Rayleigh-Jeans spectrum between 3.5 and 24 m. There is no evidence for an infrared excess from circumstellar dust.
4.5 BD+30540 and Environs
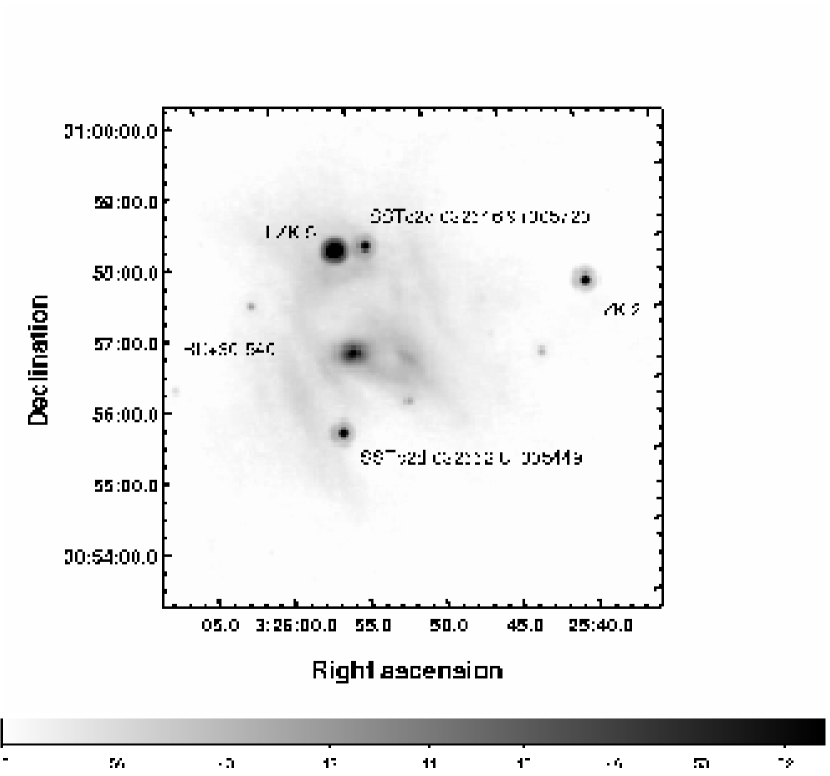
BD+30540 (SAO 56444; IRAS 03227+3045) is a B8 V star which illuminates the reflection nebula Van den Bergh 13, North of L1448. This object is covered by our Spitzer MIPS scans, but falls outside the region of IRAC coverage (see Fig. 1). As can be seen in Figure 29, the 24 m image of the region shows that the region around the star is nebulous at this wavelength and immersed in patchy mid-infrared nebulosity extending to distances of 2 (30,000 AU at 250 pc). Several other point sources are present in the field within that have infrared excess666We note for completeness that we do not consider this grouping of stars an aggregate of the sort discussed above, because it covers a larger area and has larger typical nearest-neighbor distances.: the emission line stars LZK 5 (SSTc2d 032548.9+305725, 1.5 NNW of BD+30) and LZK 2 (SSTc2d 032533.2+305544, 3.6 West of BD+30); SSTc2d 032546.9+305720, 28 West of LZK 5; and SSTc2d 032552.8+305449, about 1 southeast of BD+30540. BD+30540, LZK 2, and LZK 5 are also detected at 70 m. At 24 m, the star itself is situated on the West side of a compact, elliptical patch of nebulosity that is elongated at PA 80. Its 24 m flux density is 0.1 Jy, consistent with the IRAS 25 m upper limit. Unlike the four nearby stars with infrared excess, which show Class II spectral energy distributions, BD+30540 is a Class I source – one of the reddest objects in Fig. 10 with [70]15 mag. The 70 m point source has a flux density of 1.2 Jy, more than a factor of five smaller than the IRAS 60 m flux density. The rest of the 70 m flux density is distributed in bright nebulosity extending 1.6 to the East of the star at PA 80; when this is accounted for, the Spitzer 70 m and IRAS 60 m flux densities come into rough agreement. Unfortunately the 70 m nebulosity near BD+30540 is crossed by a strong scan artifact, which prevents any detailed interpretation of its structure.
4.6 HH 211 Outflow and Source
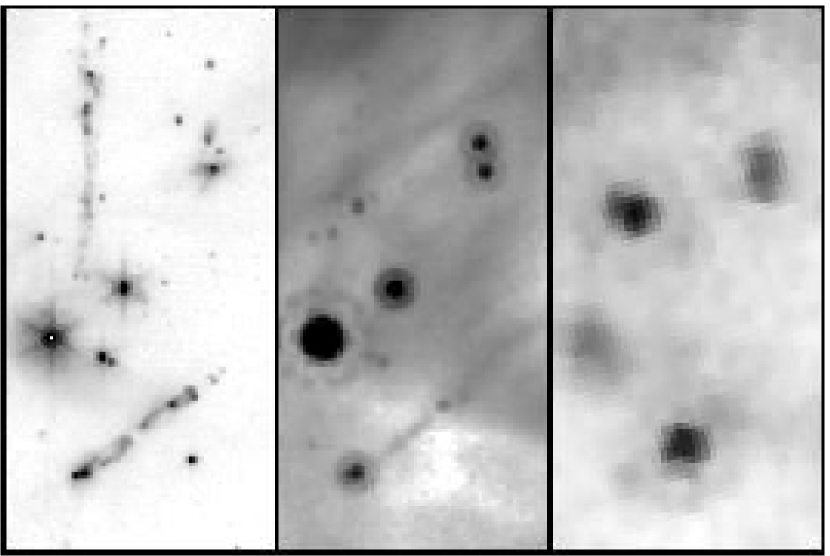
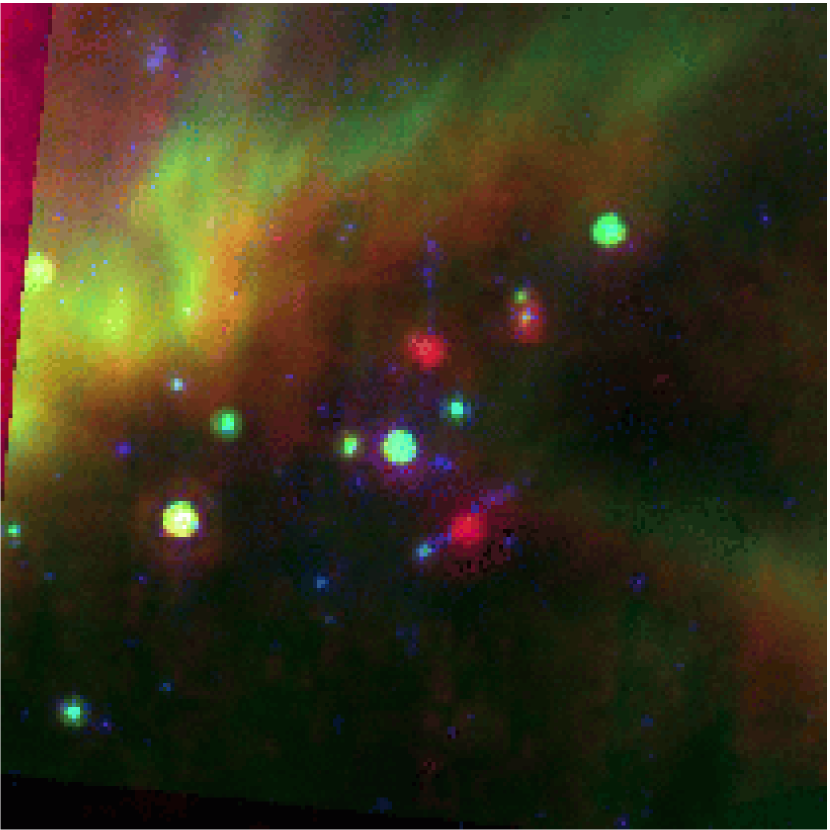
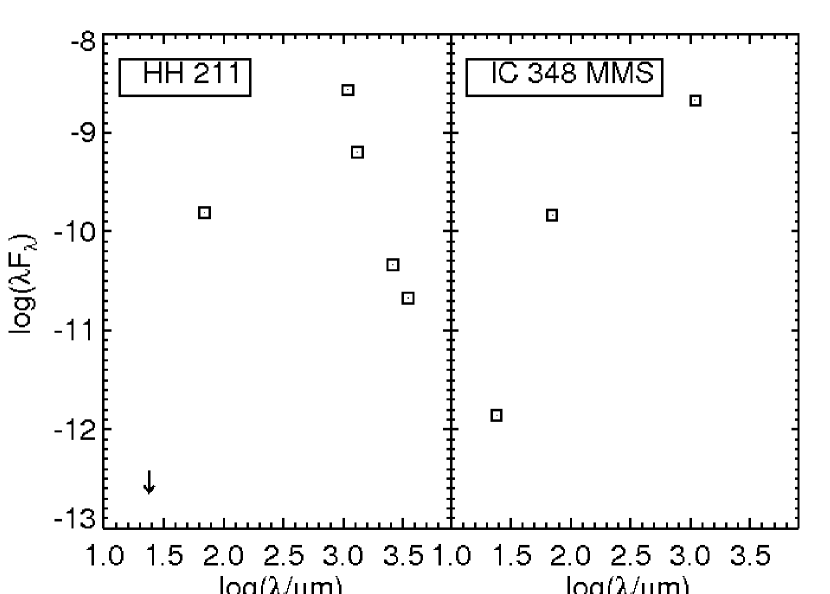
Herbig-Haro 211 is a bipolar outflow on the southwest side of IC 348, originally discovered in near-infrared H2 emission by McCaughrean et al. (1994). Gueth and Guilloteau (1999) mapped the corresponding CO outflow at high resolution, finding it to be highly collimated. They also detected the central outflow source in the millimeter continuum, and derived a circumstellar mass of 0.2 M⊙. Near-infrared spectroscopy of the flow is reported by O’Connell et al. (2005). A wide-field H2 imaging survey of the region by Eislöffel et al. (2003) identified a new North-South oriented outflow a few arcmin from HH 211, and suggested that a second bright mm continuum source along its axis (“IC 348 MMS”) was the driving source. Both of these outflow sources are detected in the centimeter continuum (Avila et al. 2001). Neither has been detected in the near-infrared, and source confusion in the complex IC 348 field prevented their detection by IRAS. MIPS observations, by virtue of their improved sensitivity and spatial resolution over previous far-infrared studies, offer a new opportunity to characterize these two Class 0 outflow sources.
Spitzer images of the HH 211 field at 4.5, 24, and 70 m are shown in Figure 30, and a wider field of view 3-color image is shown in Figure 31. The outflows appear prominently in the IRAC 4.5 m band, which includes the S(10) and S(9) pure rotational transitions of H2. The mid-infrared morphology of both flows appears very similar to their near-infrared vibrational emission (Eislöffel et al. 2003). Neither driving source is detected at any of the IRAC bands, unlike the Class 0 objects discussed in J06. At 24 m, the HH 211 source is still undetected, but several flow features are visible: the narrow bipolar jets; a central gap in the narrow jet at the position of the outflow source; bright emission from the outermost southeast bowshock (knot j, in the nomenclature of McCaughrean et al. 1994); and fainter emission from the northwest bowshocks (knots b/c, and e/d). In the other North-South outflow, the driving source is just detected with a flux density of 11 mJy, and faint indications of the North outflow emission are seen. At 70 m, both driving sources become very bright (F3.5 Jy). Both are slightly extended: Gaussian fitting, followed by subtraction in quadrature of the nominal PSF FWHM, finds that the HH 211 source is elongated by 11 (2750 AU) at PA 52, and that IC 348 MMS is elongated by 13 (3250 AU) at PA 125. Significantly, both the southeast and northwest bowshocks in HH 211 are detected at 70 m – the first time individual HH knots have been clearly detected in MIPS 70 m images. Neither of the two outflow sources can be identified at 160 m, due to saturation and confusion of bright extended emission in the region. Spectral energy distributions for both sources are shown in Figure 32.
What is the nature of the far-IR emission from the HH 211 bowshocks? Spectroscopic studies found that continuum emission was negligible near 24 m in HH 47 (Noriega-Crespo et al. 2004), HH 7 (Noriega-Crespo et al. 2000; Neufeld et al. 2006), and HH 54 (Neufeld et al. 2006). An emission line such as [S I] 25.2 m might account for the visibility of the flow features in the MIPS 24 m filter. If so, the line flux corresponding to the 40 mJy flux density measured for the HH 211 SE bowshock would be W m-2, which equates to a luminosity of at 250 pc distance. The 70 m flux densities of the southeast and northwest bowshocks, measured after subtracting the PSF of central source, are 80 and 20 mJy respectively. The [O I] line at 63.18 m is known to be bright in HH flows (Moro-Martin et al. 2001), and the MIPS 70 mfilter has 70% transmission at this wavelegnth. If all the 70 m emission from the southeast bowshock originated in this transition, the implied line flux is 8.9 W m-2 (about 10% the value measured in the Cep E bowshocks by Moro-Martin et al. 2001), and the values inferred for the line luminosity would again be . In this view, the total power emitted in the [S I] and [O I] lines would be comparable to that in 1-0 S(1) line of H2 at 2.12 m (McCaughrean et al. 1994). A more speculative possibility is that we have detected dust continuum emission from the bowshock region. In this view, the warm dust would be located in shocked ambient material, and in the pre-shock medium heated by a radiative precursor. The color temperature implied by the measured flux densities is 105 K; a blackbody at this temperature would require an emitting area of m2, which is comfortably smaller than the MIPS 24 m beam. The source luminosity would be comparable to the emission line case. Spectroscopic observations will be needed to distinguish between these two possibilities in the specific case of HH 211. The high implied luminosity of the HH 211 bowshocks, the absence of outer flow features beyond the known bowshocks in the wide-field IRAC maps, and the extremely red driving sources all point toward HH 211 being an extremely young outflow.
The Spitzer 70 m flux densities of the two outflow driving sources are consistent with previously reported ISO 60 m measurements (Froebrich et al. 2003). The new 24 m measurements provide a strong new constraint on the bolometric temperatures of both objects. Both are among the reddest objects in the entire Perseus cloud: with [24][70] color 7 mag. A 30 K blackbody is consistent with the observations of IC 348 MMS, and corresponds to an upper limit temperature for HH 211. The low temperatures of the two sources arise from both their dense envelopes and the fact that both are viewed from near the equator plane of their developing circumstellar disks. At 70 m, the HH 211 source is elongated along the same position angle as in the 1.1 mm continuum (Enoch et al. 2006), 60 from the flow axis and 30 misaligned from the major axis of the circumstellar disk (Palau et al. 2006).
5 Conclusions
We have presented here the MIPS observations of 10.5 square degrees of the Perseus molecular cloud at 24, 70, and 160 m. In this paper, we have selected just a few items to highlight from this incredibly rich data set.
Bright extended emission is present at all three wavelengths throughout the MIPS Perseus mosaics. The majority of the extended structures we see have direct counterparts in the IRAS maps. At 24 and 70 m, there is more extended emission on the East side of the complex, where several B stars act as illuminating sources. The distribution of 160 memission closely follows the contours of extinction on the West side of the complex. The large 1.4 diameter IRAS ring illuminated by HD 278942 does not follow the contours. The structure of the nebulosity immediately surrounding HD 278942 is consistent with a cloud wall illuminated by a star immediately behind it, as suggested for the IRAS ring by Ridge et al. (2006).
The source counts found at MIPS 24 and 70 are a combination of background galaxies, background and foreground stars, and true cluster members. At 24 m, in the IC 348 and NGC 1333 clusters, there is a clear excess of cloud member sources for flux densities 2-3 mJy. Across the much larger “rest of the cloud” region, an excess of on-cloud sources is seen for flux densities 10 mJy. At 70 m, there is a clear excess above SWIRE of sources obtained at all flux densities 200 mJy in the “rest of the cloud” and in IC 348; in NGC 1333, an excess in number counts is found for objects brighter than about 65 mJy. The brightest measurable objects in Perseus are found in NGC 1333, where there is a clear excess of these relative to other parts of Perseus.
As a result of observational constraints, the MIPS coverage is about 3 times that of the IRAC coverage. In the region that is covered by IRAC, 92% of the MIPS-24 objects have an IRAC match at some band. The relatively shallow NIR data from 2MASS provides some additional data, but only about 30% of the MIPS-24 sources have -band counterparts. Nonetheless, a third of those have MIR excesses, making them potentially cloud members. Many interesting objects throughout this complex have well-defined SEDs.
By making color-magnitude plots using combinations of , 24, and 70 m, we can make an attempt at separating likely YSOs from likely galaxies such as those found in SWIRE. Many candidate young objects are found throughout the cloud, not just in the well-known clusters; in sheer numbers, there are as many young object candidates outside the clusters as in the clusters. In contrast to J06, we find a much lower frequency of Class I and flat spectrum sources outside the clusters. The difference can be traced to the selection criteria; by requiring detections, we are implicitly limiting our selection to the brighter objects, and J06 includes fainter objects. The MIPS data show that the abundance of bright Class I and flat spectrum sources is not higher in the rest of the cloud versus the NGC 1333 and IC 348 clusters. We find that NGC 1333 is on average younger than IC 348, consistent with expectations.
We find objects that are redder in [24], [70], and [24][70] than any extragalactic source found in SWIRE at these flux levels; we consider these to be potentially the most embedded young objects, and they are found both in the clusters and in the rest of the cloud.
There are tightly clustered clumps, arcs, and strings of apparently young objects bright at 24 m located throughout the Perseus cloud. We have presented SEDs and images of the components of a new aggregate called Per 6 and two objects that IRAS thought were single point sources but that break into pieces when viewed by MIPS. Each of these groupings of stars has a diversity of SEDs despite being closely co-located (within 0.1 pc), similar to another aggregate found in the Galactic First Look Survey in L1228 (Padgett et al. 2004). This suggests that either (a) all of the objects started with similar properties but at different times such that there is a real age spread and their circumstellar environments today reflect different stages in a process of uniform evolution, or (b) all of the objects are roughly coeval and there is a real diversity of evolutionary states and/or or initial conditions. If the former is the case, then some stars are Myr old and some are Myr old. If the latter is the case, the evolution of circumstellar matter must be such that the timescale to evolve from Class 0 to Class I is comparable to the shortest possible time to evolve from Class 0 to Class III, and it is perhaps strongly influenced by conditions specific to each star.
There is no real variability of any of the 24 m sources in our field on timescales of 6 hours to 10%.
We used the MIPS data to assess how well the IRAS survey did in identifying point sources in a region where complex extended emission is present, posing a significant source of confusion to the large aperture IRAS measurements. Most of the 12 and 25 m highest-quality IRAS PSC point sources are either retrieved or it is clear why a point source was reported for that location. There are many more PSC “point sources” reported at 60 and 100 m (than at 12 and 25 m); a much lower fraction of these objects are recovered. The IRAS FSC is much more robust for studies of stellar sources in regions with complex extended emission, and should be used in preference to the IRAS PSC unless MIPS data are available.
The 16 objects detected at all three MIPS bands throughout the cloud are expected to be among the most interesting cloud members; they all have colors consistent with embedded young objects, though one on the edge of the field is likely to be a background galaxy (based on POSS observations). We suggest that at least one of these objects may be a new Class 0 object.
Two debris disk candidates, HD 281159 (BD+31643 in IC 348) and HD 278942, are found not to have infrared excess; IRAS measurements suggesting an excess were contaminated by bright extended emission. Two jets in IC 348, HH211 and IC 348 MMS, are seen at 24 m; bowshocks are detected at 24 and 70 m – the first time individual HH knots have been clearly detected in MIPS 70 m images.
A complete list of candidate young objects in Perseus, along with discussions of clustering and evolutionary timescales, will appear in S.-P. Lai, in preparation.
References
- (1) Alten, V., P., Bally, J., Devine, D., & Miller, G., 1997, IAUS, 182P, 51A
- (2) Alzner, A. 1998, A&AS, 132, 237
- (3) Andersson, B.-G., Wannier, P.G., Moriarty-Schieven, G.H., and Bakker, E.J. 2000, AJ, 119, 1325
- (4) Aspin, C. 1992, A&A, 266, 416
- (5) Avila, R., Rodriguez, L.F., and Curiel, S. 2001, Rev.Mx.A.A., 37, 201
- (6) Bachiller, R. et al. 1991, A&A, 251, 639
- bachiller (2) Bachiller, R. 1996, ARA&A, 34, 111
- (8) Bally, J., Devine, D., Reipurth, B., 1996, ApJ, 473, 49
- (9) Barsony, M., et al. 1998, ApJ, 509,
- (10) Beckwith, S. V. W., Henning, T., & Nakagawa, Y. 2000, in Protostars and Planets IV, ed. V. Mannings, A. P. Boss, & S. S. Russell (Tucson: Univ. Arizona Press), 533
- (11) Beichman, C. A., et al. 1998, IRAS catalog and explanatory supplment
- (12) Blum, 2006, AJ, 132, 2034
- (13) Brown, J., et al. 2007, submitted
- (14) Calvet,N., Briceno, C., Hernandez, J., Hoyer, S., Hartmann, L., Sicilia-Aguilar, A., Megeath, S. T., & D’Alessio, P. 2005, AJ, 129, 935
- (15) Cambresy, L., et al. 2006, A&A, 445, 999
- (16) Casali, M. & Eiroa, C., 1996, A&A, 306, 427
- (17) Chapman, N., 2006, ApJ, submitted
- (18) Choi, M., 2005, ApJ, 630, 976
- (19) Ciardi, D., Telesco, C., Williams, J., Fisher, R., Packam, C., Pina, R., Radomski, J., 2003, ApJ, 2003, 585, 392
- (20) deGrijp, M., et al., 1987, A&AS, 70, 95
- (21) Eislöffel, J., Froebrich, D., Stanke, Th., and McCaughrean, M.J. 2003, ApJ, 595, 259
- (22) Enoch, M.L. et al. 2006, ApJ, 638, 293
- (23) Evans, N.J. et al. 2005, C2D Explanatory Supplement, http://data.spitzer.caltech.edu/popular/c2d/20050705_enhanced_v1/Documents/
- Fazio (04) Fazio, G., et al., 2004, ApJS, 154, 10
- (25) Froebrich, D., et al., 2005, ApJS, 156, 169
- froe (2) Froebrich, D., Smith, M.D., Hodapp, K.-W., and Eislöffel, J. 2003, MNRAS, 346, 163
- greene (94) Greene, T., et al., 1994, ApJ, 434, 614
- (28) Gordon, K., et al. 2005, PASP, 117, 503
- (29) Gueth, F., and Guilloteau, S. 1999, A&A, 343, 571
- (30) Harvey, P. et al. 2006, ApJ, in press
- (31) Hartmann, L., 2003, ApJ, 585, 398
- (32) Hatchell, J., et al. 2005, A&A, 440, 151
- (33) Hodapp, K., Bally, J., Eisloffel, J., & Davis, C., 2005, AJ, 129, 1580
- (34) Jones, B.J., Martínez, V.J., Saar, E., and Trimble, V. 2005 Rev.Mod.Phys., 76, 1211
- (35) Jørgensen, J. et al. 2006, ApJ, 645, 1246 (J06)
- (36) Jørgensen, J. Johnstone, J., Kirk, H., Myers, P., 2006, submitted
- kalas (02) Kalas, P., Graham, J.R., Beckwith, S.V.W., Jewitt, D.C, and Lloyd, J.P. 2002, ApJ, 567, 999
- kalas (97) Kalas, P. and Jewitt, D. 1997, Nature, 386, 52
- kh (95) Kenyon, S.J. and Hartmann, L. 1995, Ap.J.S., 101, 117
- (40) Kirk, H., Johnstone, D., & DiFrancesco, J., 2006, ApJ, 646, 1009
- (41) Kraemer, K., et al., 2003, AJ, 126, 1423
- (42) Lada, C., et al. 2006, ApJ, 131, 1574
- (43) Ladd, E., Lada, W., & Meyers, P. 1993, ApJ, 410, 168
- ladd (2) Ladd, E., Myers, P., Goodman, A., 1994, ApJ, 433, 117
- (45) Lecavelier des Etangs, A., Vidal-Madjar, A., & Ferlet, R. 1998, A&A, 339, 477
- (46) Liu, C.-P., Zhang, C.-S., & Kimura, H. 1980, AcASn, 21, 354
- (47) Lonsdale, C.J. et al. 2003, PASP, 115, 897
- (48) Makovoz, D., & Marleau, F. 2005 PASP, 117, 1113
- (49) McCabe, C., et al., 2006, ApJ, 636, 932
- (50) McCaughrean, M.J., Rayner, J.T., and Zinnecker, H. 1994, ApJ, 436, 189
- (51) Merín, B., 2004, PhD Thesis, Universidad Autonoma de Madrid
- (52) Moro-Martín, A., Noriega-Crespo, A., Molinari, S., Leonardo, T., Cernicharo, J., Sargent A. 2001, ApJ, 555, 146
- (53) Moshir, M., Kopman, G., Conrow, T., IRAS Faint Source Survey and Explanatory Supplement
- (54) Mott, F., & Andre, P. 2001, A&A, 365, 440
- (55) Neufeld, D., et al. 2006, ApJ, in press, astro-ph/0606232
- anc (1) Noriega-Crespo, A. et al. 2004, ApJS, 154, 352
- anc (2) Noriega-Crespo, A. et al. 2000, ApJ, 538, 638
- (58) O’Connell, B., Smith, M.D., Froebrich, D., Davis, C.J., and Eislöffel, J. 2005, A&A, 431, 223
- (59) Olmi, L., Testi, L., & Sargent, A., 2005, A&A, 431, 253
- (60) Padgett, D., et al., 2004, ApJS, 154, 433
- padgett (2) Padgett, D., et al., 2006, in prep
- (62) Palau, A. et al., 2004, ApJ, 636, 137
- (63) Palla, F., et al., 2005, ApJ, 626, 49
- (64) Porras, A., et al. 2006, submitted
- (65) Prato, L., Greene, T., & Simon, M., 2003, ApJ, 584, 853
- rebull (03) Rebull, L., et al., 2003, AJ, 125, 2568
- reipurth (02) Reipurth, B., Rodriguez, L., Anglada, G., Bally, J., 2002, AJ, 124, 1045
- (68) Ridge, N., Schnee, S.L., Goodman, A.A., and Foster, J.B. 2006, ApJ, 634, 932
- (69) Rieke, G., 2004, ApJS, 154, 25
- (70) Silverstone, M., et al. 2006, ApJ, 639, 1138
- (71) Skrutskie, M., et al. 2006, AJ, 131, 1163
- (72) Strom, K.M., Strom, S.E., Merrill, K.M. 1993, ApJ, 412, 233
- (73) Surace, J., et al. 2003, VizieR On-line Data Catalog: II/255
- (74) Teixeira, P., et al., 2006, ApJ, 636, 45
- (75) Vrba, F., Strom, S., & Strom, K., 1976, AJ, 81, 958
- (76) Wainscoat, R.J., Cohen, M., Volk, K., Walker, H.J., & Schwartz, D.E. 1992, ApJS, 83, 111
- (77) Wilking, B., et al., 2004, AJ, 127, 1131
- (78) Witt, A.N., and Schild, R.E. 1986, ApJS, 62, 839
- (79) Yamauchi, S., et al., 2001, PASJ, 53, 885
- (80) Yan, J., et al. 1998, ApJ, 116, 2438
- young (03) Young, C., et al. 2003, ApJS, 145, 111
- (82) Young, K., et al. 2005, ApJ, 628, 283
Appendix A IRAS sources not recovered by MIPS
As discussed in Section 3.2, we compared the MIPS 24 and 70 m images and source catalogs with the IRAS Point Source (PSC) and Faint Source (FSC) catalogs. A significant number of IRAS detections in Perseus are not recovered by Spitzer/MIPS. The following tables were constructed by overlaying the PSC and FSC source positions on the MIPS 24 and 70 m images. If an object (or more than one object) appeared at the IRAS catalog position, it was marked as having been recovered, even if the MIPS detection was saturated (which happened frequently). If an IRAS object was located in a region of bright extended emission in the MIPS image with no immediately obvious point source(s), it was noted that IRAS was likely to have been confused by nebulosity. If no MIPS point source was readily discernible at the IRAS catalog position, it was marked as missing from the MIPS data. All unconfused IRAS 25 m sources should be recovered in the MIPS 24 m band, given its greater sensitivity. Similarly, all unconfused IRAS 60 m sources should be recovered in the MIPS 70 m band. IRAS sources that were listed in the IRAS catalogs (PSC and FSC) as clear detections (data quality flag of 3) but that are missing in one or both MIPS bands or confused by nebulosity are given in the following Tables.
Comparing to Table 3, the objects included in the Tables below are (a) the 13 PSC objects listed as clear detections at 25 m but that MIPS-24 reveals are likely to have been simply confused by the nebulosity; (b) the 8 PSC objects listed as clear detections at 60 m but missing entirely from the 70 m map; (c) the 36 PSC objects listed as clear detections at 60 m but that MIPS-70 reveals as clumps of nebulosity; (d) the one FSC object listed as a clear detection at 25 m but that MIPS-24 does not recover at all; and (e) the 8 objects listed as clear detections at 25 m but that MIPS-24 resolves into clumps of nebulosity. No PSC objects are listed as clear IRAS detections at 25 m but are completely missing at 24 m, and no FSC objects are listed as clear IRAS detections at 60 m. For completeness, we note that one PSC object clearly detected at 12 m was not recovered at 24 m (or at 70 m); it is 03324+3020. A source is present at 24 m, but offset West of the IRAS position. It is reasonably likely that these sources should be matched, but as the positional offset was larger than expected, we have listed it as missing.
| PSC name | …from 24 m | …from 70 m |
|---|---|---|
| 03265+3014 | missing (listed as upper limit at 12,25) | missing (listed as detection at 60) |
| 03292+3124 | confused by nebulosity | missing (listed as detection at 60) |
| 03303+3108 | confused by nebulosity | confused by nebulosity |
| 03310+3026 | confused by nebulosity? | missing (listed as detection at 60) |
| 03313+3117 | confused by nebulosity? | confused by nebulosity |
| 03319+3044 | confused by nebulosity? | confused by nebulosity |
| 03323+3049 | confused by nebulosity? | confused by nebulosity? |
| 03326+3055 | confused by nebulosity? | confused by nebulosity? |
| 03334+3042 | confused by nebulosity | confused by nebulosity |
| 03338+3123 | missing (listed as upper limit at 12,25) | confused by nebulosity |
| 03346+3116 | confused by nebulosity | confused by nebulosity |
| 03349+3117 | off edge | confused by nebulosity |
| 03354+3114 | confused by nebulosity | confused by nebulosity |
| 03356+3121 | confused by nebulosity | confused by nebulosity |
| 03358+3138 | confused by nebulosity | confused by nebulosity |
| 03363+3200 | confused by nebulosity | missing (listed as detection at 60) |
| 03366+3105 | confused by nebulosity | missing (listed as detection at 60) |
| 03367+3145 | confused by nebulosity | confused by nebulosity |
| 03367+3147 | confused by nebulosity | confused by nebulosity |
| 03367+3147 | confused by nebulosity | confused by nebulosity |
| 03370+3155 | confused by nebulosity | confused by nebulosity |
| 03371+3103 | confused by nebulosity | confused by nebulosity |
| 03371+3135 | confused by nebulosity | confused by nebulosity |
| 03372+3107 | confused by nebulosity | confused by nebulosity |
| 03372+3112 | confused by nebulosity | confused by nebulosity |
| 03374+3056 | confused by nebulosity | missing (listed as detection at 60) |
| 03380+3114 | confused by nebulosity | confused by nebulosity |
| 03380+3140 | confused by nebulosity | confused by nebulosity |
| 03380+3143 | confused by nebulosity | confused by nebulosity |
| 03382+3145 | confused by nebulosity | confused by nebulosity |
| 03385+3109 | confused by nebulosity | confused by nebulosity |
| 03385+3149 | confused by nebulosity | confused by nebulosity |
| 03386+3206 | confused by nebulosity | confused by nebulosity |
| 03391+3223 | confused by nebulosity | confused by nebulosity |
| 03391+3227 | missing (listed as upper limit at 12,25) | confused by nebulosity |
| 03404+3156 | confused by nebulosity | confused by nebulosity |
| 03406+3144 | confused by nebulosity | confused by nebulosity |
| 03410+3204 | confused by nebulosity | confused by nebulosity |
| 03411+3155 | confused by nebulosity | confused by nebulosity |
| 03411+3235 | confused by nebulosity? | confused by nebulosity |
| 03414+3200 | confused by nebulosity | confused by nebulosity |
| 03415+3121 | missing (listed as upper limit at 12,25) | confused by nebulosity |
| 03417+3159 | confused by nebulosity | confused by nebulosity |
| 03417+3207 | confused by nebulosity | confused by nebulosity |
| 03418+3242 | confused by nebulosity? | missing (listed as detection at 60) |
| 03424+3234 | missing (listed as upper limit at 12,25) | confused by nebulosity |
| 03427+3206 | confused by nebulosity? | confused by nebulosity |
| 03429+3237 | confused by nebulosity? | confused by nebulosity |
| 03434+3235 | confused by nebulosity? | confused by nebulosity |
| 03437+3219 | confused by nebulosity | confused by nebulosity |
| 03439+3131 | off edge | confused by nebulosity |
| 03448+3302 | confused by nebulosity | missing (listed as detection at 60) |
| 03449+3240 | confused by nebulosity | confused by nebulosity |
| 03450+3223 | broken into pieces | confused by nebulosity |
| 03452+3245 | missing (listed as upper limit at 12,25) | confused by nebulosity |
| 03454+3230 | missing (listed as upper limit at 12,25) | confused by nebulosity |
| 03455+3242 | confused by nebulosity? | confused by nebulosity |
| FSC name | …from 24 m | …from 70 m |
|---|---|---|
| F03345+3116 | confused by nebulosity | off edge |
| F03368+3147 | confused by nebulosity | confused by nebulosity |
| F03399+3134 | confused by nebulosity | confused by nebulosity |
| F03414+3200 | confused by nebulosity | confused by nebulosity |
| F03415+3210 | confused by nebulosity | confused by nebulosity |
| F03416+3158 | confused by nebulosity | confused by nebulosity |
| F03416+3206 | confused by nebulosity | confused by nebulosity |
| F03419+3209 | confused by nebulosity | confused by nebulosity |
| F03226+3059 | missing (listed as upper limit at 12, solid detection at 25) | missing (listed as weak detection at 60) |