25 Orionis: A kinematically distinct 10 Myr old group in Orion OB1a11affiliation: Based on observations obtained at the Llano del Hato National Astronomical Observatory of Venezuela, operated by CIDA for the Ministerio de Ciencia y Tecnología; the MMT Observatory, a joint facility of the Smithsonian Institution and the University of Arizona; and the Fred Lawrence Whipple Observatory of the Smithsonian Institution, USA
Abstract
We report here on the photometric and kinematic properties of
a well defined group of nearly 200 low-mass pre-main sequence stars,
concentrated within of the early-B star 25 Ori,
in the Orion OB1a sub-association.
We refer to this stellar aggregate as the 25 Orionis group.
The group also harbors the Herbig Ae/Be star V346 Ori
and a dozen other early type stars with photometry, parallaxes, and some
with IR excess emission, consistent with group membership.
The number of high and low-mass stars is in agreement
with expectations from a standard Initial Mass Function.
The velocity distribution for the young stars in 25 Ori shows a narrow
peak centered at , very close to the velocity of the star 25 Ori.
This velocity peak is offset from the velocity characterizing
the younger stars of the Ori OB1b sub-association, and from the
velocity of more widely spread young stars of the
Ori OB1a population near the Ori cluster; this result
provides new and compelling
evidence that the 25 Ori group is a distinct kinematic entity,
and that considerable space and velocity structure is present
in the Ori OB1a sub-association.
The low-mass members follow a well defined band in the color-magnitude
diagram, consistent with an isochronal age of Myr,
depending on the assumed evolutionary model.
The drop in the overall Li I equivalent widths and
accretion fraction between the younger Ori OB1b and the 25 Ori group,
is consistent with the later being significantly older,
independent of the absolute age calibration.
The highest density of members is located near the
star 25 Ori, but the actual extent of the cluster cannot be
well constrained with our present data.
In a simple-minded kinematic evolution scenario, the 25 Ori group
may represent the evolved counterpart of a younger
aggregate like the Ori cluster.
The 25 Ori stellar aggregate is the most populous Myr sample yet known
within 500 pc, setting it as an excellent laboratory to study
the evolution of solar-like stars and protoplanetary disks.
1 Introduction
Samples of Myr old, low-mass stars are important for understanding protoplanetary disk and pre-main sequence stellar evolution. Many estimates (e.g. Briceño et al., 2001; Calvet et al., 2005; Haisch, Lada & Lada, 2001) indicate that by Myr the majority of inner disks have dissipated and planet formation has been mostly completed (Pollack et al., 1996). However, finding large samples of stars at this age has been a significant observational challenge.
The traditional means of identifying low-mass pre-main sequence (PMS) stars (or T Tauri stars - TTS, as they are usually known) has been to look toward molecular clouds. If cloud complexes had long lifetimes, of Myr, (e.g. Pollack et al., 1996), and star formation had proceeded in a more or less continuous fashion, one would expect to find roughly 10 times as many 10 Myr-old stars as 1 Myr old objects toward dark clouds with crossing times of order 10 Myr. The lack of such older PMS stars in regions like the Taurus clouds was called by Herbig (1978) the Post-T Tauri problem. Recently, accumulating observational and theoretical evidence suggest that molecular clouds lifetimes are much shorter than previously thought (e.g. Ballesteros-Paredes et al., 2006; Briceño et al., 2006); by ages Myr the parent molecular clouds have dissipated and no longer serve as markers of the young population (c.f. Briceño et al., 2005). This is consistent with the absence of emission in regions like the Orion OB1a sub-association, in which the estimated ages of the massive OBA stars are of order 10 Myr (Brown et al., 1994; de Zeeuw et al., 1999). One approach to searching for somewhat older PMS stars over wide areas, extending beyond the confines of molecular clouds, has been to select X-ray active G and K type stars in large scale X-ray surveys like the ROSAT All-Sky survey (RASS). However, in regions like Orion the RASS only reached down to stars (Alcalá et al., 1996), missing the more numerous late K and M type stars; in addition, it suffered from significant contamination by foreground X-ray active zero age main sequence stars (Briceño et al., 1997).
Nevertheless, a few Myr old stellar groups have been discovered in the solar neighborhood in recent years. The nearby TW Hya association is one of the most important such groups, but the coevality or even membership is somewhat uncertain for some objects (Mamajek, 2005). Another important nearby group of similar age is the Cha cluster (Mamajek et al., 1999) but, like TW Hya, it contains no more than stars. Sicilia-Aguilar et al. (2005) found a 10 Myr old sample ( members) in NGC 7160 in Cepheus, but this is a much more distant cluster ( pc).
The Orion OB1a sub-association Blaauw (1964), at an estimated of Myr Briceño et al. (2005, 2006) is a promising region for searching for numerous samples of low-mass stars at this important age range. In Briceño et al. (2005) we presented the first sample of the low-mass stellar population in this region, and identified a concentration of PMS stars around the B1V star 25 Ori. Here we investigate the kinematics of members of this stellar aggregate, which we refer to as the 25 Orionis group. We show that the stars in this region have a relatively narrow velocity dispersion that is kinematically distinct from the stars in the Ori OB1b sub-association. The location of these stars in the color-magnitude diagram indicates a small dispersion in age, and provides indications of systematic discrepancies in pre-main sequence isochrones. The stars in the 25 Ori group provide a well defined, populous, sample for studies of disk evolution. In section 2 we describe the photometric selection of candidate PMS stars, and the spectroscopic follow-up for membership confirmation, and measurement of radial velocities. In §3 we present our results, describing the overall 25 Ori stellar population (§3.1), kinematics (§3.2, age (§3.4), the behavior of Li I as a youth indicator (§3.3), and the fraction of stars showing evidence for disk accretion (§3.5).
2 Observations
2.1 Selection of T Tauri candidates
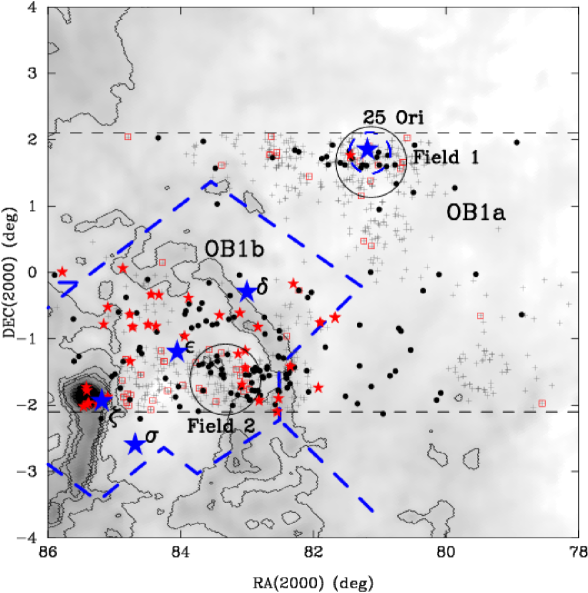
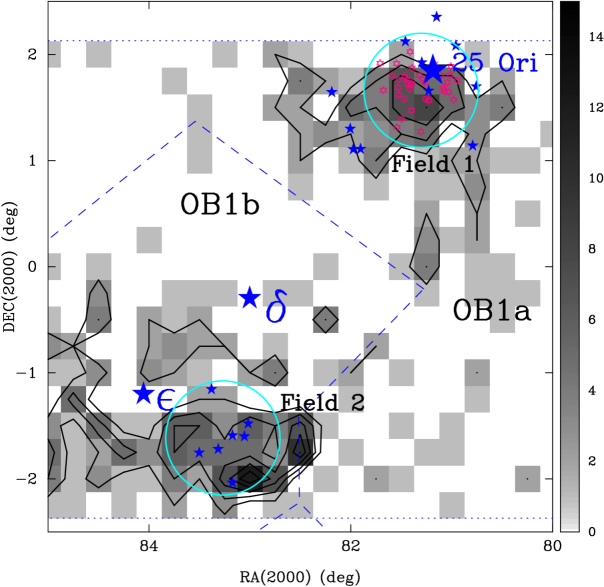
In order to study the star-forming history and characterize the stellar population of the Orion OB1 association we are carrying out a large scale optical variability survey and spectroscopic follow-up. In Briceño et al. (2005) we presented results for a region spanning , between and (in Figure 1 we show a part of that larger area), which includes the Ori OB1b sub-association, and large fraction of Ori OB1a. The multi-band, multi-epoch photometric survey, has been done with the QuEST CCD Mosaic Camera (Baltay et al., 2002) installed on the Stock 1m Schmidt-type telescope at the Venezuela Llano del Hato National Astronomical Observatory. We use variability and optical colors as a means to select candidate PMS low-mass stars in color-magnitude diagrams, down to a limiting magnitude of V. We refer the reader to Briceño et al. (2005) for details of the instrument, photometry and candidate selection criteria.
The photometric sample considered here is composed of candidate PMS stars located in the same area of the Briceño et al. (2005) study, for which spectroscopic confirmation is presented here for the first time, plus stars already confirmed spectroscopically as Orion OB1 members in that work.
2.2 Spectroscopy
2.2.1 Low resolution spectroscopy: confirming membership
Low-resolution spectra provide confirmation of the TTS nature of a star. Such objects can be reliably identified through optical spectroscopy by the presence of: (1) H emission, strong in stars actively accreting from their surrounding disks (the so called Classical T Tauri stars - CTTS, which exhibit W(H)Å at M0, with larger values at later spectral types, see White & Basri (2003)), and weak (a few Å) in non-accreting stars, the Weak-lined T Tauri stars - WTTS; (2) the Li I Å line strongly in absorption (e.g. Briceño et al., 1997). Spectra in the range Å also include several strong molecular features like TiO bands, characteristic of cooler stars (spectral types later than ), which are sensitive Teff indicators.
We obtained low-resolution optical spectra of our candidate PMS stars with a variety of telescopes and instruments. The brighter stars (V) were observed at the 1.5 m telescope of the Whipple Observatory equipped with the FAST Spectrograph (Fabricant et al., 1998), with a spectral coverage of 3400 Å centered at 5500 Å, and a resolution of 6 Å. Though spectra for a large fraction of the bright candidates were obtained in Briceño et al. (2005), here we include a number of stars for which spectra were not available at the time. With these additions we consider our follow-up spectroscopy in this magnitude range complete.
For the fainter (V) candidates in our photometric survey the bulk of the spectroscopic follow-up was done with the Hectospec multi-fiber spectrograph on the 6.5 m MMT telescope at Mount Hopkins (Fabricant et al., 2005). Hectospec is a low-resolution optical spectrograph with a total of 300 fibers that can be placed within a diameter field. We used the 270 groove grating, obtaining spectra in the range Å, with a resolution of 6.2 Å. With a S/N ratio in our spectra we could detect Li absorption down to Å to identify the low-mass, young stars. We measured H and Li I equivalent widths in all our low resolution spectra, using the splot routine in IRAF. From November 2004 through April 2005 we observed 2216 candidates in eight fields distributed throughout the Orion 1a and 1b sub-associations; a complete analysis of this entire sample will be presented in Briceño et al. (2007). In this contribution we concentrate on newly identified TTS in a smaller area surrounding the early type star 25 Orionis, in the Orion OB1a region, and near the belt star Ori, located in the Orion OB1b sub-association; for this sample we present high-resolution spectroscopy (§2.2.2). The data reduction of both FAST and Hectospec data was performed by S. Tokarz through the CfA Telescope Data Center, using IRAF tasks and other customized reduction scripts. Spectral types were derived using the SPTCLASS code developed at CIDA, which includes spectral indices in the Hectospec wavelength range.
2.2.2 Hectochelle Spectroscopy: investigating kinematics
In order to study the kinematics of the region, we obtained high resolution spectra of a subset of Orion OB1 candidate members, using the Hectochelle fiber-fed multi-object echelle spectrograph, mounted on the 6.5m MMT (Szentgyorgi et al., 1998) at the MMTO, Arizona, USA. Hectochelle uses 240 fibers in a circular field. Each fiber has a diameter of m, subtending 1.5 arc sec on the sky. We observed in the spectral order centered near H, from 6465Å to 6650Å (185Å wide), with a resolution R (equivalent to Å FWHM). Two observations were obtained on the night of December 2, 2004, in two fields containing a total of 243 T Tauri stars confirmed through FAST and Hectospec spectra, out of which we were able to obtain high-resolution spectra for 147 objects (60%). The first field observed (Field 1) is located in the 25 Orionis group (Figure 1; Briceño et al. 2005); it contains 124 TTS, of which 65% were assigned fibers. The second field (Field 2) is located within the Ori OB1b sub-association, next to the belt star Ori (Figure 1); it includes 119 TTS, of which 57% were assigned fibers. For each field we obtained three exposures, that were later combined to aid in cosmic ray removal. In Table 1 we summarize the characteristics of the observations.
We allocated fibers according to the following priorities: First, to members already confirmed from low-resolution spectroscopy, mostly bright (V ) members observed with FAST; we then added some fainter (V), spectroscopically confirmed members. Finally we allocated the remaining fibers to other objects in the field brighter than V=16, which though not being confirmed members, had optical or 2MASS colors suggestive of them possibly being candidate young objects. In each field we observed objects with dubious status from our low-resolution spectroscopy, that could be either WTTS or dMe stars.
To establish the zero point for the radial velocities derived from our spectra, during the same night we obtained template spectra of 14 relatively bright stars with spectral types similar to our target stars, in a field located in Selected Area 57, near the north Galactic Pole. The radial velocities of these stars have been monitored for many years using the CfA Digital Speedometers (Latham, 1992) without showing any signs of variation, and their absolute velocities have all been established to an accuracy better than (Stefanik, Latham, & Torres, 1999). For wavelength calibration we obtained several Thorium-Argon lamp exposures throughout the night; the thermal shift was monitored to be of a few hundreds of a pixel ( m/s). Spectra were reduced and extracted using standard IRAF routines. No sky subtraction was applied. To derive the dispersion correction we used 47 lines fitted with a cubic spline. The RMS fit for the dispersion correction itself was roughly m/s, however, because of fiber-to-fiber variations, which have not been properly calibrated out yet, the true scatter is closer to . Typical signal-to-noise (SNR) ratios ranged from for the fainter stars (V), to SNR for the brighter objects (V).
Radial velocities were derived using the cross-correlation routine xcsao in the IRAF SAOTDC package. This routine obtains the radial velocity from the shift of the cross-correlation peak. The R value from the cross-correlation process is a measurement of the ratio of the peak of the cross-correlation to the estimated noise, and is therefore an indicator of the accuracy of the results (Tonry & Davis, 1979). In our measurements we blocked out H as well as other emission lines. For each star in our sample we ran xcsao using all the template spectra, we selected the result with the largest R (the best matching template). In our final list we used only results, which yield velocity errors (for slowly-rotating stars; (see Hartmann et al., 1986)). In this way we avoided spectra contaminated by scattered sunlight, which mostly correspond to small R values (low SNR) that tend to cluster around the velocity value of the heliocentric correction. In order to eliminate multiple systems in our sample, we selected only objects which showed a clear single peak in the cross-correlation plot. The derived radial velocities were corrected for the motion of the Earth around the Sun. The final sample includes 78 ”single” TTS with (47 in Field 1 and 31 in Field 2).
The photometric and spectroscopic measurements for these stars are presented in Table 2. The first column provides the CIDA Variability Survey of Orion (CVSO) running number, continuing the numbering sequence from Briceño et al. (2005); stars from that article have CVSO numbers . The newly identified young members of 25 Ori and Orion OB1b presented here start with object CVSO-198. We provide two values of the Equivalent Width of the H emission line (), the first one estimated in our low-resolution spectra, and the second measured in the Hectochelle spectra. Both values agree for the majority of stars, within the measurement uncertainties and allowing for variability of the H line. All equivalent widths were obtained using the splot routine in IRAF, by measuring the line respect to the local pseudo-continuum, estimated to be roughly at the base of the emission feature.
3 Results and Discussion
3.1 The 25 Ori population
The 25 Orionis group stands out as a concentration of TTS stars in the Ori OB1a sub-association (Figure 1), roughly surrounding the B1Vpe star 25 Ori (). This star has been classified as a Classical Be object (Yudin, 2001; Banerjee et al., 2000; Schuster & Alvarez, 1983); more recently Hernández et al. (2005) determined a spectral type B2. In Briceño et al. (2005) we already pointed out the existence of this stellar aggregate as a distinct feature in the spatial distribution of the brighter (V) members, albeit with lower number statistics. Kharchenko et al. (2005) classify the region around 25 Ori as a new cluster (ASCC 16), based on parallaxes, proper motions and V, B-V data for Hipparcos and Tycho-2 stars. They place the cluster center coordinates at , south-west of 25 Ori, and derive a cluster radius of (Figure 1). The parallaxes of the Hipparcos stars yield a mean distance of 323 pc; we assume here a value of 330 pc (see Briceño et al., 2005). We are aware we are missing the northernmost region of the 25 Ori cluster, as can be seen in Figure 1. However, because our continuing survey ultimately will span Orion up to we will be in a position to study whether the cluster extends further north.
For the present analysis we defined a circle of radius around 25 Ori as the 25 Orionis group. Though this is larger than the cluster radius derived by Kharchenko et al. (2005), it allows us to improve our member statistics, and at the same time is not large enough to expect contamination from the younger stars in the Orion OB1b region. The Kharchenko et al. (2005) catalog lists 143 stars within this circle and south of our declination limit (Figure 1): 12 are B-type stars, including 25 Ori, 18 are A-type stars, one of which is the Herbig Ae/Be star V346 Ori (spectral type A8; Hernández et al. 2005), and 21 are F-type stars. A number of these early type stars show IR emission properties consistent with membership in this young stellar group. Hernández et al. (2006) used Spitzer data to look for circumstellar disks in a subset of the Kharchenko et al. (2005) stars. They studied 7 of the 12 Hipparcos B-type stars, and found one with 24m excess emission and lack of near-IR excesses indicative of a debris disk. Their sample also included 13 A-type stars, out of which 7 had debris disks, and 1 (V346 Ori) had an optically thick disk, for a disk fraction among A-stars of 62%; of the 5 F-type stars in their sample 3 (60%) had debris disks. In our subsequent discussion we adopt these sources as early type members of the 25 Ori group.
If a standard Initial Mass Function (IMF; e.g. Kroupa 2001) is assumed, one would expect that a cluster formed with 12 B-type stars will produce roughly 12 A-stars, 12 F-stars, 18-G stars, 48-K stars and 336-M stars (down to M6). Within this area we identify 197 TTS from our low-resolution follow up spectroscopy (124 inside our 25 Ori Hectochelle field - Field 1), all of them K and M-type; 21 objects were reported in Briceño et al. (2005) and 176 are new identifications, whose detailed properties will be discussed in Briceño et al. (2007). The magnitude limit of our spectroscopic follow-up effectively places our completeness at a spectral type of roughly M4 (we discuss this with better number statistics in Briceño et al. 2007); therefore, our sample is missing a number of the later type M-stars. Still, the number of low-mass young stars we have identified within this region is in agreement, within a factor of , to expectations from a typical IMF.
3.2 Kinematics
Figure 2 shows the velocity distribution of stars in Table 2. Because in our sample the typical velocity errors are . The two regions show clearly distinct kinematics, with well defined peaks located at for the 25 Ori field and for the Ori OB1b field. The narrow cores of both distributions are not much larger than the estimated errors, and consistent with velocity dispersions in typical regions of star formation. The peak of the velocity distribution in Ori OB1a is consistent with the majority of radial velocity measurements for 25 Ori (, Frost et al. 1926; , Plaskett & Pearce 1931; , Wilson 1953; , Morrell & Levato 1991), suggesting that the bulk of the TTS are indeed related to the star 25 Ori. The presence of a shift between the cores of the velocity distributions in OB1a/25 Ori region and OB1b qualitatively supports the findings that these two sub-associations are at very different distances, though nearly along the line of sight (Warren & Hesser, 1977, 1978; Brown et al., 1994; Hernández et al., 2005).
In a recent study, Jeffries et al. (2006) found two distinct velocity components when analyzing velocity data toward four fields around Ori, located in the sub-association Ori OB1b. Their kinematic group 1 has velocities . Taking the average value of determined by Morrell & Levato (1991) for Ori OB1a,111The errors quoted by Morrell & Levato (1991) in their Table 5, for the average derived for each Ori OB1 sub-association are the error of the mean, . From their OB1a and OB1b measurements, the actual mean internal error is and their mean external error is . they relate stars in group 1 with this sub-association; this is consistent with suggestions that the closer Ori OB1a region in fact extends in front of Ori OB1b (Briceño et al., 2005; Sherry et al., 2004). The velocities of group 1 roughly overlap our distribution for 25 Ori. However, it is interesting to highlight that the peak of the distribution for the group 2 of Jeffries et al. (2006) is located at , off the peak of our 25 Ori distribution. With errors in both studies in the range , this is a statistically robust difference. If the kinematics of the ”field” population of Ori OB1a is indeed characterized by the velocity distribution of group 1 in the Jeffries et al. (2006) sample, then our results strongly argue in favor of 25 Ori cluster being a a distinct entity in velocity space, different from the general population of OB1a, which is widely spread with a low spatial density (c.f. Figs. 5 and 6 of Briceño et al., 2005). The distribution of velocities in 25 Ori (Field 1) looks somewhat skewed to higher velocities (; Figure 2), though with few objects. This is what would be expected from the presence of a few interloper PMS stars from the widespread population of OB1a. If this degree of contamination (5/47) is taken as representative of the field PMS population of Ori OB1a in the 25 Ori area, we would expect that of the 124 TTS within our Hectochelle field, could be ”contaminants” from OB1a.
The OB1b stars in our sample lie to the west of the main distribution of molecular gas, corresponding to the respective ends of the Orion A and B clouds (Figure 1). The gas nearest the stars has a heliocentric radial velocity (e.g., Figure 5 of Wilson et al., 2005), velocity as the stars in our Hectochelle field. There is also a degree of asymmetry in the velocity distribution for Ori OB1b (right panel in Figure 2), this time extending to lower , toward the same velocity range expected of OB1a stars and of 25 Ori. This is not surprising if we recall that Ori OB1a is closer than OB1b, and much more spatially extended, such that along any line of sight in the direction of OB1b there probably will be some PMS members of the general population of Ori OB1a, that will contribute at these velocities. Another fact worth pointing out is that the gas is present over a range of several , which could also account for this asymmetry. The Orion belt star nearest to our Hectochelle Field 2, in Ori OB1b, is Ori, with estimated velocities that range from (Frost et al., 1926) to (Morrell & Levato, 1991), though most measurements cluster around . Brown et al. (1994) classify Ori as a member of OB1b. The Hipparcos parallax is (Perryman et al., 1997), which corresponds to a distance of 412 pc, consistent with our assumed distance of 440 pc. The TTS in our southern Hectochelle field share the same velocity as the nearby gas and Ori, indicating that these objects indeed belong to what is called the OB1b sub-association.
In their study Jeffries et al. (2006) found for their group 2 velocities in the range , peaking at . They identify this group as the ” Ori cluster”, with an age of Myr and at a distance of 440 pc, similar to Ori OB1b; however, they argue it is kinematically distinct to OB1b, because they assume the value of from Morrell & Levato (1991) for this sub-association. Our findings do not support their claim. First, the peak velocity we find for OB1b, and the small width of the distribution shown in Figure 2, strongly suggest that OB1b and the Ori cluster share similar kinematics. 222Despite having similar kinematics, Hernández et al. (2007) found that Ori appears to be younger than the general population of Ori OB1b, and with a higher disk fraction (their Figure 13). Second, if we recompute the average group velocity for the OB1b stars in Morrell & Levato (1991), but considering only objects with reliable membership, that are not spectroscopic binaries, and flagged as having constant , we find with a dispersion of . Therefore, the peak velocity of the Jeffries et al. (2006) group 2 is consistent with the radial velocity of both our sample of spectroscopically confirmed low-mass members, and samples of early type stars in Ori OB1b.
In contrast to the strongly peaked velocity distributions for the young stars, field stars (objects showing strong H absorption in our Hectochelle spectra) exhibit an almost flat distribution, with stars at all velocity bins (lower panels in Figure 2). Other objects recognized as part of the field population are dMe stars, which look very similar to WTTS in that they have weak H emission, but lack the strong Li I 6707Å absorption feature characteristic of M stars younger than Myr. However, the velocity distribution of dMe stars in both fields shows a small excess of objects at the velocity peak for each region. A few of these objects could actually be WTTS, but the SNR of their low resolution spectra does not allow detection of the Li I line. But even if this were the case, we expect to be missing no more than 1-2 objects in 25 Ori and 2-4 in Orion OB1b.
3.3 Lithium
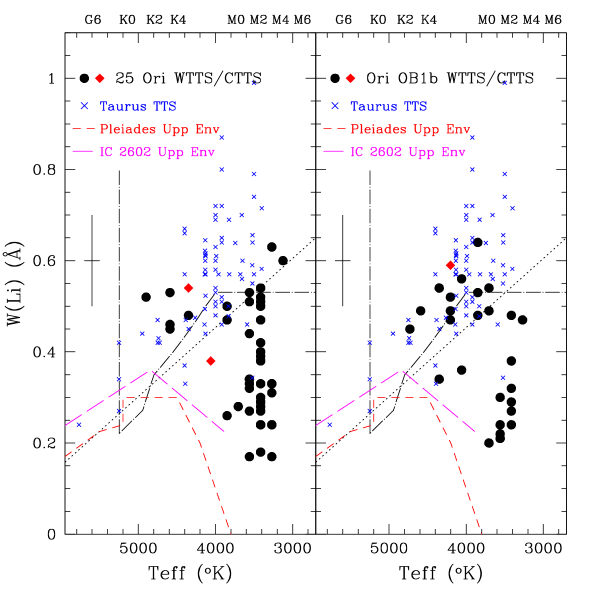
As mentioned in §2.2.1 and above, the presence of the Li I 6707Å line strongly in absorption is a clear indicator of youth in K and M-type stars. In Figure 3, we show the distribution of Li I equivalent widths, , measured in our low-resolution spectra, plotted as a function of the effective temperature for each star, derived from the adopted spectral type and the temperature scale in Table A5 of Kenyon & Hartmann (1995). In order to compare with our sample, we show the lithium equivalent width measurements by Basri et al. (1991) and Martín et al. (1994) of Taurus TTS, representative of Myr old, low-mass stars. The dotted line indicates the lower boundary of W(Li I) for the majority of Taurus TTS. We also plot the upper envelopes for the Pleiades cluster (age Myr; Stauffer et al. 1998) using data from Soderblom et al. (1993) and García-López et al. (1994), and for the IC 2602 cluster (age Myr; Stauffer et al. 1997), from the dataset of Randich et al. (1997). All the 25 Ori and Ori OB1b members fall above the upper cluster envelopes; however, an important fraction of the M-stars in each field fall below the lower boundary of the Taurus TTS. Also, in both Orion fields the observed is lower than in Taurus. The large spread toward lower values of for the M-type stars has also been observed by Kenyon et al. (2005) in Ori. Comparison of the in 25 Ori and OB1b members shows that while 40% of all the Ori OB1b members in Table 2 fall within the Taurus TTS locus only 22% of the TTS in the 25 Ori group share this region of the diagram (see Figure 3) . This analysis includes all stars with velocities within of the peak in each field. In Figure 3 we have also plotted the line separating WTTS from post-T Tauri stars (PTTS). Herbig (1978) used the term PTTS for PMS stars which have lost their T Tauri properties; Martín (1997) identify as PTTS those PMS stars with essentially WTTS properties, except they fall below the the lithium isoabundance line plotted in Figure 3. In general, PTTS are expected to be slightly more evolved TTS. In the Ori OB1b field, the WTTS/PTTS fraction is 0.48; in the 25 Ori field it is 0.25. In contrast, the WTTS/PTTS fraction for Taurus members is 5.57. We argue that the lower , the increasing fraction of TTS with values below the Taurus lower boundary as a function of age, and the decreasing WTTS/PTTS fraction, suggest we are looking at the effects of Li depletion over the age range spanned by these three regions.
3.4 Ages
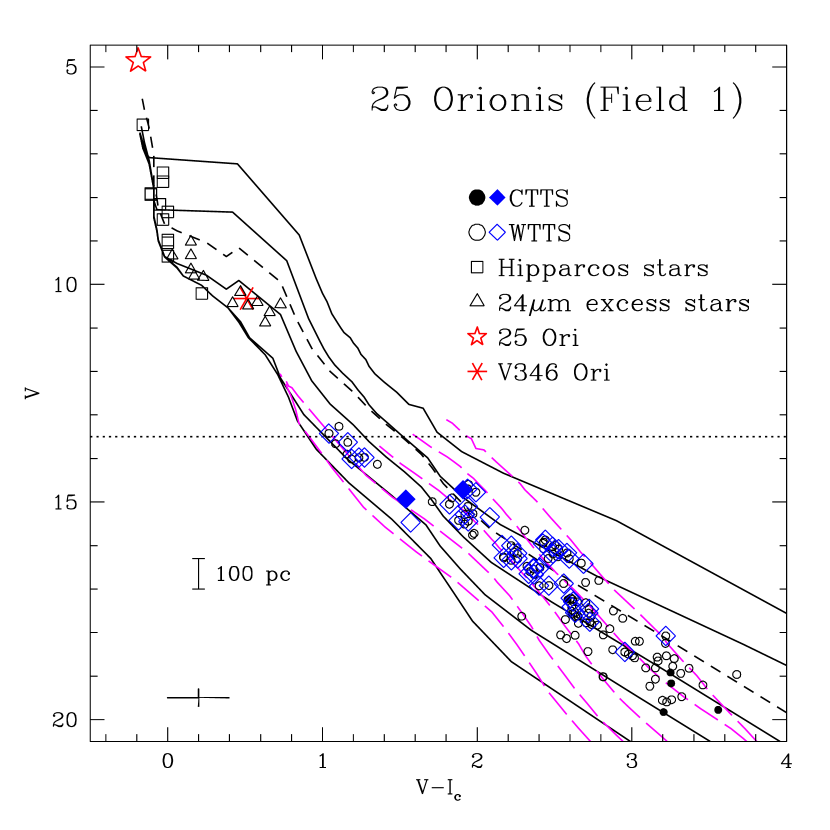
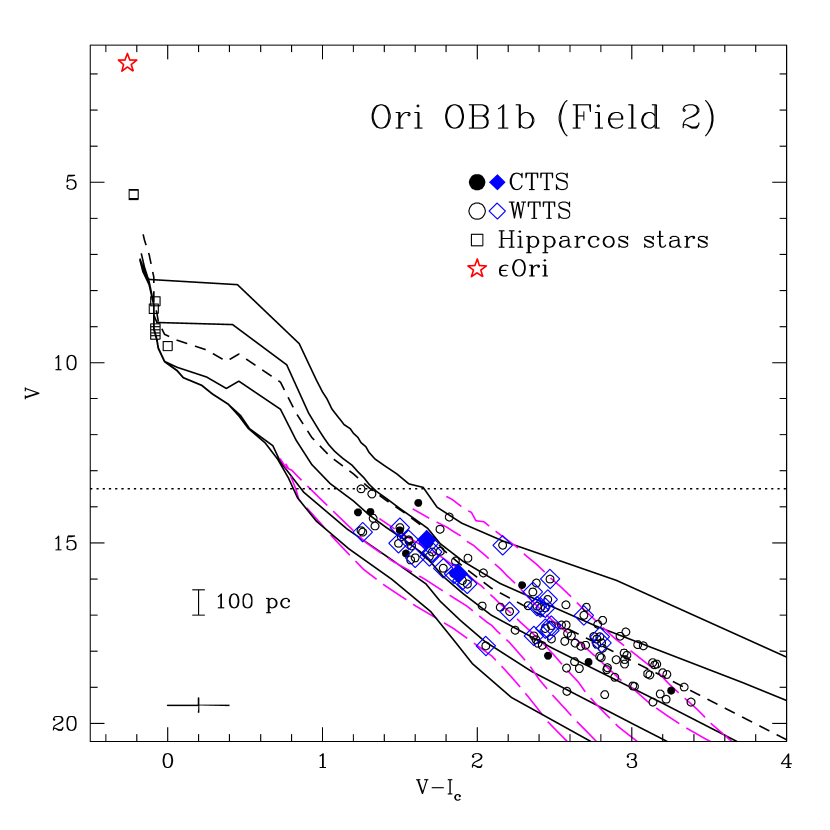
In Figure 4 we show the color-magnitude diagrams (CMDs), of all TTS within our two Hectochelle fields (open and solid circles), and for the subset of members for which high-resolution spectra were obtained (HC-only, listed in Table 2; open and solid diamonds). As in Briceño et al. (2005) we adopted distances of 330 pc for the 25 Ori group and 440 pc for the Ori OB1b field. We also show two sets of isochrones for 1, 3, 30, and 100 Myr from Baraffe et al. (1998) and Baraffe et al. (1998).
The TTS in the 25 Ori field follow a relatively well defined band in the CMD. The spread observed is largely consistent with the upper limit of 0.75 magnitudes expected from unresolved binaries (the dashed-lined isochrone in Figure 4), plus a small spread introduced if we assume the stars follow some distance distribution along the line of sight ( at 400 pc corresponds to pc, or 0.04 magnitudes). Variability should not affect in an important way our CMDs because we use for each object the mean magnitudes derived from our multi-epoch optical survey (see Briceño et al., 2005). From our photometry and spectral types for the TTS members, assuming the intrinsic colors in Table A5 of Kenyon & Hartmann (1995), and the extinction law of Cardelli et al. (1989) with , we compute an overall mean mags for the 25 Ori cluster, in good agreement with the E(B-V)= 0.09 obtained by Kharchenko et al. (2005). For the 25 Ori group we also plot the V and values for Hipparcos stars (including 25 Ori; Perryman et al., 1997), V346 Ori and the excess IR emission early type stars from Hernández et al. (2006); the V, B photometry for these later objects is from Kharchenko et al. (2005), transformed to assuming a mean and the appropriate colors for their spectral types from Kenyon & Hartmann (1995). Similarly, we show the location of the Hipparcos B-type stars and the belt star Ori in the CMD diagram of Ori OB1b. All these early type stars fall on or close to the the ZAMS, consistent with them being the higher mass members of these stellar populations.
The band of TTS in the 25 Ori field is roughly encompassed by the 3-10 Myr isochrones. At the bright end of our TTS sample (V) the stars seem to cross over to the left, towards the 30 Myr isochrone; this could be due to the photometry for some of these stars being affected by saturation (the bright limit for our photometry varies with each CCD in the QuEST camera, but is roughly between V). Alternatively, this could be due to uncertainties in the location of the birthline at these range of masses (Hartmann, 2001).
At the faint end we note a deviation from the theoretical models that we attribute to limitations in the currently available PMS isochrones. At V, the bulk of our stars in the CMD seems to deviate slightly downwards from the Siess et al. (2000) isochrones. With the Baraffe tracks, which are considered to be more appropriate for low mass stars (e.g. Briceño et al., 2002; Luhman et al., 2003), the behavior is opposite, the lower mass stars seem systematically younger (or the tracks bend down too steeply). A similar discrepancy is found in the Ori Ob1b field. Overall, the Baraffe models produce mean ages with are younger than those derived from the the Siess isochrones. For the larger sample we derive an average age of Myr from the Siess et al. (2000) isochrones, and of Myr from the Baraffe et al. (1998) isochrones, in agreement with our determination in Briceño et al. (2005) with smaller number of objects. For the HC-only sample in 25 Ori the resulting average ages are similar. For both TTS samples within the Orion OB1b field, the resulting average ages are Myr from the Siess et al. isochrones and Myr from the Baraffe et al. models. In the OB1b field we find an average mags.
Within the uncertainties, the age derived
here for 25 Ori is the same as for the general Ori OB1a sub-association
in Briceño et al. (2001, 2005), though for this larger region the spread in ages
for the individual stars is larger,
probably caused in some measure by the increase in distance depth along
the line of sight as one encompasses much wider areas.
With a well defined, spatially confined, numerous sample in Ori OB1b,
resulting in a smaller spread in the CMD, the age difference between
this younger region and the older Ori OB1a is now firmly established.
This age difference of a factor
is consistent with the indications of Li I depletion we discuss
in §3.3, and with the decay in accretion indicators
shown by Briceño et al. (2001, 2005) and considered here in
the following section.
Our finding of slightly different kinematics between the 25 Ori cluster
and what can be interpreted as the widely spread PMS low-mass population
of Ori OB1a, suggest that although both stellar populations probably
share a common origin, a previously unrecognized degree of substructure
is present in this region.
3.5 Accretion indicators
The fraction of CTTS, or stars thought to be accreting from their circumstellar disks, can be derived by comparing the value of W(H) for each spectral type in our low resolution spectroscopy, with the criteria in White & Basri (2003): a star is considered to be a CTTS if in the range K0-K5, for K7-M2.5, for M3-M5.5, and for M6-M7.5. Inside each 0.5 deg radius Hectochelle field, and considering all TTS, the CTTS fraction in the 25 Ori field is 5.6% (7 out of 124 stars), while in the Ori OB1b field the CTTS fraction is 12.6% (15 out of 119 stars, higher). These values are almost a factor of lower than those reported in Briceño et al. (2005). However, this apparent discrepancy can be easily explained by considering the following: first, in Briceño et al. (2005) our sample for Ori OB1b included regions like the very young NGC 2024 cluster ( Myr) which has a large number of CTTS, and is nominally located within Ori OB1b if one uses the Warren & Hesser (1977) boundaries. Second, as one increases the census of PMS stars in older regions like Ori OB1a, the most frequent type of members are WTTS, which tends to lower the accretor fraction. If we assume that our present CTTS fraction in 25 Ori is more representative of this region, then we find it is a factor of larger than what Sicilia-Aguilar et al. (2005) obtained in the Myr old NGC 7160 ( 1 accretor in their sample of 55 members), but much smaller than the % they report for the Myr old cluster Tr 37. The higher CTTS fraction in 25 Ori when compared to NGC 7160 could be because this region is indeed younger, or due to the small number statistics in the Sicilia-Aguilar et al. (2005) sample.
3.6 Spatial Distribution
In order to provide a first look at the spatial distribution of young stars in this aggregate, we computed a spatial density map by counting the number of TTS in squares in side; because the spectroscopic followup is most spatially uniform for the brighter stars, we only considered TTS with V (the non-overlapping Hectospec circular fields produce circular “imprints” on the spatial distribution for the fainter members, as can be seen in Figure 1). The result is shown in Figure 5. The largest starred symbol marks the location of 25 Ori, and the belt stars and Ori; the small solid starred symbols correspond to B-type stars included as probable members of the 25 Ori cluster in the list of Kharchenko et al. (2005), and Hipparcos B-stars classified as members of Ori OB1b by Hernández et al. (2005). There is a peak in the spatial distribution of low-mass young stars in the 25 Ori region, containing 8 TTS (an implied density of 128 ), at , south-east of 25 Ori. Kharchenko et al. (2005) place their cluster center at , , which given our bin size agrees with our determination. The density of stars falls off to /bin at a radius of , which corresponds to 7 pc at the assumed distance of 330 pc. This value is slightly larger than what Sherry et al. (2004) found for the younger Ori cluster ( pc). At a velocity dispersion of , an unbound stellar aggregate would expand roughly 1 pc every 1 Myr. If the 25 Ori group resembled the Ori cluster at an age of Myr, a naive dynamical picture would have it evolve to a cluster radius of pc at Myr. However, we must caution that the detailed spatial structure cannot yet be fully investigated from our present data. First, because of gaps between the CCD detectors in the QuEST CCD Mosaic Camera, artifacts appear such as the E-W gap apparent at (Figure 1). Second, we have not yet completed follow-up spectroscopy of the photometric candidates located north of (Figures 1 and 2). Therefore, if more young stars turn up northward of that line, the actual membership and spatial extent of the 25 Ori group may be larger than shown here, and the point with the highest density of members could well shift somewhat. To illustrate this point we have plotted as small magenta stars the TTS with within 1 of the peak velocity for the 25 Ori cluster (34 objects). It can be seen that these stars concentrate in the northern half of the Hectochelle field, with 74% located in this area. The highest density is in the NE quadrant of the field, mostly within the highest contour of the spatial density map. We conclude that the spatial distribution of the kinematical members within the Hectochelle field suggests the cluster may extend further north (the apparent dearth of members close at the northernmost part of the field could well be an incompleteness effect). McGehee (2006) used Sloan Digital Sky Survey Data (SDSS) to look for TTS in a wide equatorial strip between and . In his Fig.8 he shows an excess of candidate PMS stars at and , which he identifies as the south tip of the 25 Ori cluster. Because of this he derives a larger cluster radius of 8-11 pc. Though his sample does not overlap the 25 Ori nor the Ori OB1b fields discussed here, we can compare with the larger scale distribution of stars in our Orion OB1 survey. The feature identified by McGehee as part of 25 Ori can be seen as an elongated density enhancement in our spatial density map, roughly south of 25 Ori; additionally, we find a number of faint TTS at this location (Figure 1). Even taking into account this group of young objects, there is an apparent paucity of stars beyond south from 25 Ori; radial velocities need to be obtained before these objects can be interpreted as related to the 25 Ori cluster.
At present we are obtaining additional Hectochelle fields north and south of the 25 Ori field discussed here, and also in nearby regions of Ori OB1a. These observations will not only help us constrain the spatial extent and refine the kinematics of this unique sample of young, low-mass stars, but will also provide for the first time important information on the actual velocity distribution of the sparse PMS population of the Orion OB1a sub-association.
4 Summary and Conclusions
We have used the Hectochelle spectrograph on the 6.5m MMT to obtain high resolution spectra of 149 low-mass PMS stars distributed in two fields located in the Orion OB1 association, one field placed on the 25 Ori group originally identified by Briceño et al. (2005), the other near the belt star Ori, in the Ori OB1b sub-association.
We determined radial velocities with errors for 78 stars (47 in the 25 Ori field and 31 in the Ori OB1b field). The PMS members of the 25 Ori group have radial velocities in a narrow range, peaking at ; this value is very close to that of 25 Ori itself, suggesting this may be indeed the most massive star in this stellar aggregate. The stars belonging to the Ori OB1b sub-association peak at , and also show a very narrow distribution. These two differing values clearly show that these are two separate populations, and give strength to findings of a significant distance difference between these two groups. However, the 25 Ori group not only is distinct in velocity space from the Ori OB1b sub-association. The cluster peak is off from the peak velocity found by Jeffries et al. (2006) for stars they identify as belonging to the Orion OB1a sub-association. Therefore the 25 Ori group constitutes a distinct kinematic group, clearly differentiated in velocity space from both the younger and more distant OB1b, and from what seems to be the general, widely spread population of Ori OB1a.
The color-magnitude diagrams yield ages of 7-10 Myr for the 25 Ori group, and of 4-5 Myr for Ori OB1, depending on the assumed set of isochrones. The observed spread in each sample is roughly consistent with the upper limit expected for a population of unresolved binaries, combined with the distance depth estimated for each region. Our finding of a similar age but slightly different kinematics between the 25 Ori cluster and what can be interpreted as the widely spread PMS low-mass population of Ori OB1a, suggest that both stellar populations probably share a common origin, but also that a previously unrecognized degree of spatial and kinematic substructure is present in this region. The overall behavior of the Li I equivalent widths from one region to the other, and the decline of a factor in the fractions of CTTS are consistent with the 25 Ori group being significantly older than Ori OB1b, independent of the absolute age calibration.
A first approach to the spatial structure of the 25 Orionis group, with
the caveat of an incomplete census, suggests that
the low-mass PMS stars peak at
,
south-east of the star 25 Ori,
with a maximum surface density of . However, the
PMS stars with values within of the cluster peak velocity
concentrate slightly north of the density maximum.
We argue that this may indicate that the cluster does indeed extend
further north.
We derive a cluster radius of pc.
In a simple-minded kinematic evolution scenario, this value is consistent with
the 25 Ori group representing the evolved counterpart of a Myr
old aggregate like the Ori cluster.
Our results for the 25 Ori cluster in Orion OB1a provide the first large, well-defined sample of Myr-old stars suitable for studies of stellar and disk evolution.
References
- Alcalá et al. (1996) Alcalá, J. M., Terranegra, L., Wichmann, R., Chavarría-K. C., Krautter, J., Schmitt, J.H.M.M., Moreno-Corral, M.A., de Lara, E. and Wagner, R. M., 1996, A&AS, 119, 7
- Baltay et al. (2002) Baltay, C., Snyder, J.A., Andrews, P. et al. 2002, PASP, 114, 780
- Ballesteros-Paredes et al. (2006) Ballesteros-Paredes, J., Klessen, R. S., Mac Low, M.-M., Vazquez-Semadeni, E. 2006, in Protostars & Planets V., B. Reipurth, D. Jewitt, and K. Keil (eds), University of Arizona Press, Tucson.
- Banerjee et al. (2000) Banerjee, D. P. K., Rawat, S. D., Janardhan, P. 2000, A&AS, 147, 229
- Baraffe et al. (1998) Baraffe, I., Chabrier, G., Allard, F., Hauschildt, P.H. 1998, A&A, 337, 403
- Barrado y Navascués & Martín (2003) Barrado y Navascués, D., Martín, E.L., 2003, AJ, 126, 2997
- Basri et al. (1991) Basri, G., Martín, E. L., Bertout, C. 1991, A&A, 252, 625
- Blaauw (1964) , Blaauw, A. 1964, ARA&A, 2, 213
- Briceño et al. (1997) Briceño C., Hartmann L. W., Stauffer J., Gagné M., Stern R., and Caillault J. 1997, AJ, 113, 740
- Briceño et al. (2001) Briceño, C., Vivas, A.K., Calvet, N., Hartmann, L. et al. 2001, Science, 291, 93
- Briceño et al. (2002) Briceño, C., Luhman, K., Hartman, L., Stauffer, J.R., Kirkpatrick, D. 2002, ApJ, 530, 317
- Briceño et al. (2005) Briceño, C., Calvet, N., Hernández, J., Vivas, A.K., Hartmann, L., Downes, J.J., Berlind, P. 2005, AJ, 129, 907
- Briceño et al. (2006) Briceño, C., Preibisch, T., Sherry, W. H., Mamajek, E. E., Mathieu, R. D., Walter, F. M., Zinnecker, H. 2006, in Protostars & Planets V., B. Reipurth, D. Jewitt, and K. Keil (eds), University of Arizona Press, Tucson.
- Briceño et al. (2007) Briceño, C., Calvet, N., Hernández, J., Vivas, A.K., Hartmann, L., Berlind, P. 2006, AJ, in preparation
- Brown et al. (1994) Brown, A.G.A., de Geus, E.J., & de Zeeuw, P.T. 1994, AA, 289, 101
- Calvet et al. (2005) Calvet, N., Briceño, C., Hernández, J., Hoyer, S., Hartmann, L., Sicilia-Aguilar, A., Megeath, S. T., D’Alessio, P., 2005, AJ, 129, 935-946
- Cardelli et al. (1989) Cardelli, J. A., Clayton, G. C., Mathis, J. S. 1989, ApJ, 345, 245
- de Zeeuw et al. (1999) de Zeeuw, P. T., Hoogerwerf, R., de Bruijne, J. H. J., Brown, A. G. A., Blaauw, A. 1999, AJ, 117, 354
- Fabricant et al. (1998) Fabricant, D.G., Hertz, E.N., Szentgyorgyi, A.H., Fata, R.G., Roll, J.B., & Zajac, J.M. 1998, Construction of the Hectospec: 300 optical fiber-fed spectrograph for the converted MMT, Proc. SPIE, 3355, 285
- Fabricant et al. (2005) Fabricant, D., Fata, R., Roll, J., Hertz, E., Caldwell, N., Gauron, T., Geary, J., McLeod, B., Szentgyorgyi, A., et al. 2005, PASP, 117, 1411
- Frost et al. (1926) Frost, E.B., Barrett, S.B., Struve, O. 1926, ApJ, 64, 1
- García-López et al. (1994) García-López, R. J., Rebolo, R., Martín, E. L. 1994, A&A, 282 518
- Haisch, Lada & Lada (2001) Haisch, K. E., Jr., Lada, E. A., Lada, Ch. J., 2001, ApJ, 553, 153
- Hartmann et al. (1986) Hartmann, L., Hewett, R., Stahler, S., Mathieu, R. D. 1986, ApJ, 309, 275-293.
- Hartmann (2001) Hartmann, L. 2001, AJ, 121, 1030.
- Herbig (1978) Herbig G. H. 1978, in Problems of Physics and Evolution of the Universe. L.V. Mirzoyan, (ed.), 171-188. Pub. Armenian Academy of Sciences, Yerevan.
- Hernández et al. (2005) Hernández J., Calvet, N., Hartmann, L., Briceño, C., Sicilia-Aguilar, A., and Berlind, P. 2005, AJ, 129, 856-871.
- Hernández et al. (2006) Hernández J., Briceño C., Calvet, N., Hartmann L., Quintero, A. 2006, ApJ, 652, 47.
- Hernández et al. (2007) Hernández, J., Hartmann, L., Megeath, T., Gutermuth, R., Muzerolle, J., Calvet, N., Vivas, A. K., Briceño, C., Allen, L., Stauffer, J., Young, E., Fazio, G. 2007, ApJ, submitted.
- Jeffries et al. (2006) Jeffries, R. D., Maxted, P. F. L., Oliveira, J M., Naylor, T. 2006, MNRAS, 371, L6
- Kenyon et al. (2005) Kenyon, M. J., Jeffries, R. D., Naylor, T., Oliveira, J. M., Maxted, P. F. L., 2005, MNRAS, 356, 89
- Kenyon & Hartmann (1995) Kenyon, S. J., & Hartmann, L., 1995, ApJS, 101,117
- Kharchenko et al. (2005) Kharchenko, N. V., Piskunov, A. E., Röser, S., Schilbach, E., Scholz, R.-D., 2005 A&A, 440, 403
- Kroupa (2001) Kroupa, P. 2001, MNRAS, 322, 231
- Latham (1992) Latham, D. W. 1992, in ASP Conf. Ser. 32, IAU Coll. No. 135, Complementary Approaches to Binary and Multiple Star Research, eds. H. McAlister & W. Hartkopf, p. 110
- Latham et al. (1991) Latham, D. W., Davis, R. J., Stefanik, R. P., Mazeh, T. & Abt, H. A. 1991, AJ, 101, 625
- Luhman et al. (2003) Luhman, K., Briceño, C., Stauffer, J.B., Hartmann, L., Barrado y Navascués, D., Caldwell, N. 2003, ApJ, 590, 348
- Mamajek et al. (1999) Mamajek, E.E., Lawson, W.A., Feigelson, E.D., 1999, ApJ, 516, 77
- Mamajek (2005) Mamajek. E.E., 2005, ApJ, 634, 1385
- Martín et al. (1994) Martín, E. L., Rebolo, R., Magazzu, A., Pavlenko, Ya. V. 1994, A&A, 282, 503
- Martín (1997) Martín, E. L. 1997, A&A, 321, 492
- McGehee (2006) McGehee, P. M. 2006, AJ, 131, 2959
- Morrell & Levato (1991) Morrell, N. and Levato, H. 1991, ApJS, 75, 965
- Perryman et al. (1997) Perryman et al. 1997, A&A, 323, 49
- Plaskett & Pearce (1931) Plaskett, J.S., Pearce, J.A. 1931, Publ. Dominion Astrophys. Obs., 5, 1
- Pollack et al. (1996) Pollack, J.B., Hubickyj, O., Bodenheimer, P., Lissauer, J.J., Podolak, M., Greenzweig, Y., 1996, Icarus, 124, 62
- Randich et al. (1997) Randich, S., Aharpour, N., Pallavicini, R., Prosser, C. F., Stauffer, J. R. 1997, A&A, 323, 86
- Schlegel et al. (1998) Schlegel, D.J., Finkbeiner, D.P., Davis, M. 1998, ApJ, 500, 525
- Schuster & Alvarez (1983) Schuster, W. J.; Alvarez, M. 1983, PASP, 95, 35
- Scoville & Hersh (1979) Scoville N. Z. and Hersh K. 1979, ApJ, 229, 578
- Sherry et al. (2004) Sherry, W. H., Walter, F. M., Wolk, S. J. 2004, AJ, 128, 2316
- Sicilia-Aguilar et al. (2005) Sicilia-Aguilar, A., Hartmann, L.W., Hernández, J., Briceño, C., Calvet, N., AJ, 130, 188
- Siess et al. (2000) Siess, L., Dufour, E., & Forestini, M. 2000, A&A, 358, 593
- Soderblom et al. (1993) Soderblom, D. R., Jones, B. F., Balachandran, S. et al. 1993, AJ, 106, 1059
- Stauffer et al. (1997) Stauffer, J. R., Hartmann, L. W., Prosser, C. F., et al., 1997, ApJ, 479, 776
- Stauffer et al. (1998) Stauffer, J. R., Schultz, G., Kirkpatrick, J. D. 1998, ApJ, 499, 199
- Stefanik, Latham, & Torres (1999) Stefanik, R. P., Latham, D. W. & Torres, G. 1999, in ASP Conf. Ser. 185, IAU Coll. No. 170, Precise Stellar Radial Velocities, eds. J. B. Hearnshaw & C. D. Scarfe, p. 354.
- Szentgyorgi et al. (1998) Szentgyorgyi, A.H., Cheimets, P., Eng, R., Fabricant, D.G., Geary, J.C., Hartmann, L., Pieri, M.R., Roll, J.B. 1998, Proc. SPIE, Vol. 3355, p. 242-252, Optical Astronomical Instrumentation, Sandro D’Odorico, Ed.
- Tonry & Davis (1979) Tonry, J. and Davis, M. 1979, AJ, 84, 1511-1525.
- Yudin (2001) Yudin, R.V. 2001, å, 368, 912.
- Warren & Hesser (1977) Warren, W.H., & Hesser, J.E. 1977, ApJS, 34, 115-206.
- Warren & Hesser (1978) Warren, W.H., & Hesser, J.E. 1978, ApJS, 36, 497-572.
- White & Basri (2003) White, R.J. & Basri, G. 2003, ApJ, 582, 1109
- Wilson (1953) Wilson, R.E., 1953, Carnegie Inst. Washington D.C. Publ. 601, 1953 (XXBH)
- Wilson et al. (2005) Wilson, B. A., Dame, T. M., Masheder, M. R. W., & Thaddeus, P. 2005, A&A, 430, 523
- Zapatero-Osorio et al. (2002) Zapatero-Osorio, M. R., 2002, Béjar, V. J. S., Pavlenko, Ya., Rebolo, R., Allende Prieto, C., Martín, E. L., García López, R. J., A&A, 384, 937
| Field | Location | No. TTS | No. TTS | Airmass | |||
|---|---|---|---|---|---|---|---|
| with fibers | (sec) | ||||||
| 1 | 25 Ori | 124 | 81 | 1.46 | 1200 | ||
| 2 | Ori OB1b | 119 | 68 | 1.26 |
| CVSO | RA(2000) | DEC(2000) | V | SpT 11Measurements from low-resolution spectra (FAST, Hydra, Hectospec). | 11Measurements from low-resolution spectra (FAST, Hydra, Hectospec). | 11Measurements from low-resolution spectra (FAST, Hydra, Hectospec). | 22Measurements from the high-resolution Hectochelle spectra. | 22Measurements from the high-resolution Hectochelle spectra. | 22Measurements from the high-resolution Hectochelle spectra. | R | Type | Location | |
|---|---|---|---|---|---|---|---|---|---|---|---|---|---|
| hh:mm:ss | mag | mag | (Å) | (Å) | (km/s) | km/s | km/s | ||||||
| 19 | 05:23:30.93 | +01:45:49.3 | 15.87 | 2.44 | M3 | -5.4 | 0.4 | -4.70 | 17.6 | 1.5 | 5.9 | W | 25Ori |
| 198 | 05:23:46.57 | +01:45:15.8 | 13.97 | 1.27 | K4 | -0.1 | 0.5 | -0.08 | 19.1 | 0.5 | 17.8 | W | 25Ori |
| 199 | 05:23:55.36 | +01:34:18.7 | 16.92 | 2.40 | M3 | -4.4 | 0.3 | -5.21 | 20.1 | 1.4 | 5.8 | W | 25Ori |
| 200 | 05:24:02.30 | +01:53:21.5 | 16.54 | 2.36 | -5.1 | -5.12 | 19.1 | 1.2 | 5.7 | W | 25Ori | ||
| 24 | 05:24:04.26 | +01:48:30.5 | 16.34 | 2.22 | M2 | -6.1 | 0.3 | -5.67 | 19.3 | 0.9 | 9.1 | W | 25Ori |
| 201 | 05:24:07.56 | +01:38:41.7 | 16.28 | 2.17 | M3 | -3.2 | 0.2 | -6.07 | 19.9 | 1.7 | 3.4 | W | 25Ori |
| 25 | 05:24:10.36 | +01:44:07.6 | 15.42 | 1.88 | M0 | -2.6 | 0.3 | -1.42 | 19.6 | 0.7 | 13.4 | W | 25Ori |
| 202 | 05:24:18.14 | +01:39:22.9 | 17.41 | 2.61 | M3 | -4.7 | 0.5 | -4.44 | 18.8 | 1.8 | 3.1 | W | 25Ori |
| 203 | 05:24:20.27 | +01:40:54.8 | 16.66 | 2.37 | M3 | -5.6 | 0.4 | -3.37 | 19.0 | 1.4 | 5.9 | W | 25Ori |
| 204 | 05:24:25.45 | +01:48:14.3 | 17.45 | 2.72 | M4 | -6.6 | 0.6 | -6.37 | 18.0 | 1.7 | 3.2 | W | 25Ori |
| 205 | 05:24:26.64 | +01:18:13.9 | 14.77 | 1.99 | M2 | -2.1 | 0.3 | -2.08 | 25.1 | 0.7 | 12.0 | W | 25Ori |
| 206 | 05:24:41.04 | +01:54:38.6 | 14.93 | 1.54 | K5 | -53.5 | 0.5 | -43.42 | 18.8 | 0.9 | 11.4 | C | 25Ori |
| 207 | 05:24:52.27 | +01:38:43.9 | 13.63 | 1.16 | K4 | -0.8 | 0.5 | -0.61 | 24.2 | 0.8 | 15.0 | W | 25Ori |
| 208 | 05:24:54.18 | +01:34:02.1 | 18.08 | 3.22 | M5 | -10.0 | 0.6 | -3.51 | 19.9 | 1.8 | 3.1 | W | 25Ori |
| 209 | 05:25:01.92 | +01:34:56.4 | 16.87 | 2.56 | M3 | -5.8 | 0.5 | -4.74 | 18.5 | 1.2 | 5.6 | W | 25Ori |
| 29 | 05:25:02.07 | +01:37:21.2 | 16.19 | 2.49 | M3 | -7.6 | 0.5 | -7.13 | 22.1 | 1.1 | 7.1 | W | 25Ori |
| 210 | 05:25:03.61 | +01:44:12.1 | 16.92 | 2.46 | M3 | -5.9 | 0.3 | -4.15 | 19.6 | 1.6 | 5.2 | W | 25Ori |
| 211 | 05:25:08.76 | +01:45:54.3 | 13.98 | 1.24 | K5 | -0.1 | 0.5 | -0.13 | 19.4 | 0.5 | 17.6 | W | 25Ori |
| 212 | 05:25:13.55 | +01:16:20.6 | 17.55 | 2.72 | M3 | -6.9 | 0.5 | -3.64 | 21.4 | 2.1 | 3.5 | W | 25Ori |
| 213 | 05:25:16.72 | +01:16:15.9 | 16.08 | 2.53 | M3 | -4.4 | 0.2 | -4.07 | -0.1 | 2.1 | 5.2 | W | 25Ori |
| 214 | 05:25:17.04 | +01:48:22.4 | 13.42 | 1.04 | K2 | -0.2 | 0.5 | -0.06 | 19.1 | 0.5 | 17.6 | W | 25Ori |
| 215 | 05:25:27.70 | +01:41:46.9 | 17.54 | 2.63 | M3.5 | -8.0 | 0.2 | -4.28 | 17.4 | 2.0 | 4.0 | W | 25Ori |
| 216 | 05:25:34.25 | +01:34:05.7 | 18.45 | 2.95 | M4.5 | -7.1 | 0.3 | -7.02 | 17.5 | 1.6 | 4.1 | W | 25Ori |
| 217 | 05:25:34.39 | +01:52:19.8 | 15.29 | 1.92 | M1 | -2.1 | 0.3 | -1.70 | 19.2 | 0.7 | 13.2 | W | 25Ori |
| 218 | 05:25:35.18 | +01:43:40.6 | 17.29 | 2.62 | M4 | -7.7 | 0.3 | -4.31 | 19.0 | 1.7 | 4.2 | W | 25Ori |
| 219 | 05:25:35.65 | +01:28:23.2 | 15.05 | 1.82 | M0 | -1.3 | 0.5 | -0.13 | 21.0 | 0.6 | 13.4 | W | 25Ori |
| 220 | 05:25:38.89 | +02:01:29.9 | 14.01 | 1.19 | K4 | -0.7 | 0.4 | -0.40 | 19.0 | 0.7 | 15.8 | W | 25Ori |
| 221 | 05:25:39.57 | +01:42:53.7 | 15.10 | 1.94 | M0 | -1.8 | 0.5 | -1.53 | 20.6 | 0.7 | 12.4 | W | 25Ori |
| 222 | 05:25:39.72 | +01:25:46.9 | 16.03 | 2.49 | M3 | -9.9 | 0.3 | -7.47 | 15.5 | 1.9 | 6.1 | W | 25Ori |
| 223 | 05:25:39.94 | +01:40:21.1 | 16.50 | 2.41 | M3 | -5.3 | 0.4 | -4.35 | 21.2 | 1.1 | 6.7 | W | 25Ori |
| 35 | 05:25:45.91 | +01:45:50.2 | 14.72 | 1.91 | K7 | -10.3 | 0.4 | -15.72 | 18.8 | 1.0 | 11.0 | C | 25Ori |
| 224 | 05:25:46.74 | +01:43:30.4 | 17.21 | 2.60 | M3 | -20.3 | 0.3 | -13.67 | 18.4 | 1.7 | 3.1 | W | 25Ori |
| 36 | 05:25:50.37 | +01:49:37.3 | 16.00 | 2.22 | M3 | -8.9 | 0.5 | -3.92 | 17.9 | 0.8 | 10.7 | W | 25Ori |
| 225 | 05:25:51.82 | +01:47:36.1 | 16.17 | 2.58 | M4 | -4.9 | 0.2 | -3.45 | 18.5 | 1.3 | 5.8 | W | 25Ori |
| 226 | 05:25:52.61 | +01:34:44.2 | 17.75 | 2.73 | M4 | -4.9 | 0.3 | -3.98 | 20.4 | 1.3 | 4.5 | W | 25 Ori |
| 227 | 05:25:59.05 | +01:23:34.7 | 16.30 | 2.60 | M4 | -4.8 | 0.2 | -4.99 | 20.2 | 1.2 | 6.0 | W | 25Ori |
| 228 | 05:26:06.36 | +01:45:46.7 | 16.30 | 2.26 | M2 | -3.4 | 0.2 | -3.84 | 20.6 | 0.9 | 8.8 | W | 25Ori |
| 38 | 05:26:06.41 | +01:37:11.8 | 16.18 | 2.26 | M2 | -7.5 | 0.5 | -4.04 | 20.8 | 1.1 | 9.1 | W | 25Ori |
| 229 | 05:26:07.84 | +01:23:08.3 | 15.95 | 2.43 | M3 | -4.3 | 0.2 | -3.71 | 24.1 | 1.6 | 5.5 | W | 25Ori |
| 230 | 05:26:08.02 | +01:41:15.2 | 15.44 | 1.94 | M2 | -4.9 | 0.5 | -2.90 | 19.9 | 1.1 | 11.6 | W | 25Ori |
| 231 | 05:26:10.10 | +01:18:44.3 | 16.42 | 2.69 | M4 | -9.0 | 0.2 | -7.28 | 21.4 | 1.7 | 3.9 | W | 25Ori |
| 232 | 05:26:11.18 | +01:54:52.3 | 14.70 | 1.94 | M2 | -3.7 | 0.3 | -3.22 | 19.1 | 1.2 | 10.5 | W | 25Ori |
| 233 | 05:26:21.98 | +01:47:57.6 | 16.30 | 2.46 | M3 | -5.0 | 0.3 | -4.46 | 18.3 | 1.2 | 6.8 | W | 25Ori |
| 234 | 05:26:38.04 | +01:21:45.5 | 15.35 | 2.08 | M2 | -4.0 | 0.4 | -3.77 | 24.0 | 0.8 | 10.4 | W | 25Ori |
| 235 | 05:26:42.65 | +01:39:47.3 | 16.65 | 2.33 | M2.5 | -5.7 | 0.3 | -7.69 | 20.3 | 1.3 | 5.5 | W | 25Ori |
| 42 | 05:26:50.43 | +01:55:03.6 | 15.99 | 2.16 | M2 | -3.8 | 0.3 | -2.15 | 20.7 | 0.9 | 8.7 | W | 25Ori |
| 236 | 05:27:00.52 | +01:49:27.2 | 16.51 | 2.36 | M3.5 | -7.7 | 0.3 | -5.45 | 29.6 | 1.1 | 8.2 | W | 25Ori |
| 89 | 05:31:19.99 | -01:46:53.3 | 15.47 | 1.57 | K7 | -1.6 | 0.4 | -1.18 | 30.5 | 0.7 | 13.3 | W | OB1b |
| 92 | 05:31:31.75 | -01:47:05.6 | 16.90 | 2.21 | M2 | -3.6 | 0.2 | -5.53 | 23.6 | 1.9 | 3.7 | W | OB1b |
| 97 | 05:31:42.80 | -01:39:48.3 | 16.79 | 2.41 | M2 | -5.4 | 0.2 | -6.46 | 30.4 | 1.8 | 4.8 | W | OB1b |
| 237 | 05:31:48.29 | -01:47:59.2 | 16.36 | 2.36 | M3 | -4.3 | 0.4 | -3.78 | 30.8 | 0.8 | 10.5 | W | OB1b |
| 99 | 05:31:50.79 | -01:55:17.5 | 17.37 | 2.44 | M2 | -5.5 | 0.2 | -5.06 | 30.9 | 1.1 | 8.2 | W | OB1b |
| 238 | 05:32:00.42 | -01:40:11.0 | 15.85 | 1.88 | -47.5 | -47.46 | 32.4 | 0.8 | 13.1 | C | OB1b | ||
| 239 | 05:32:03.47 | -01:56:32.0 | 14.91 | 1.56 | K5 | -1.2 | 0.3 | -1.31 | 4.6 | 0.6 | 16.3 | W | OB1b |
| 240 | 05:32:05.41 | -01:46:31.8 | 17.42 | 2.47 | -5.7 | 0.2 | -4.16 | 29.9 | 1.7 | 4.0 | W | OB1b | |
| 106 | 05:32:21.51 | -01:43:45.6 | 16.80 | 2.44 | M2 | -7.0 | 0.3 | -8.39 | 31.0 | 2.1 | 3.4 | W | OB1b |
| 241 | 05:32:25.69 | -01:33:11.8 | 14.92 | 1.67 | K6 | -3.8 | 0.6 | -3.23 | 29.9 | 0.8 | 13.0 | C | OB1b |
| 242 | 05:32:28.93 | -01:27:34.6 | 17.85 | 2.06 | M1 | -0.2 | 0.2 | -2.03 | 55.6 | 2.1 | 3.2 | W | OB1b |
| 243 | 05:32:29.90 | -01:52:40.0 | 15.37 | 1.69 | K6 | -0.9 | 0.5 | -0.61 | 31.5 | 0.6 | 16.7 | W | OB1b |
| 110 | 05:32:34.35 | -01:50:46.3 | 15.41 | 1.60 | M0 | -2.0 | 0.6 | -1.72 | 31.7 | 0.7 | 12.5 | W | OB1b |
| 244 | 05:32:59.21 | -02:00:38.1 | 16.00 | 2.47 | M1 | -4.8 | 0.5 | -4.45 | 20.5 | 0.8 | 9.8 | W | OB1b |
| 245 | 05:33:06.62 | -01:47:03.2 | 17.60 | 2.79 | M3 | -6.6 | 0.3 | -5.01 | 33.0 | 1.7 | 5.1 | W | OB1b |
| 246 | 05:33:10.69 | -01:31:35.8 | 15.06 | 2.17 | -2.5 | -2.54 | 25.5 | 0.9 | 11.6 | W | OB1b | ||
| 247 | 05:33:19.87 | -01:56:28.9 | 17.57 | 2.37 | M2 | -2.8 | 0.2 | -2.63 | 32.3 | 1.1 | 7.7 | W | OB1b |
| 248 | 05:33:22.72 | -01:43:42.2 | 16.04 | 1.91 | K7 | -3.3 | 0.6 | -2.12 | 27.6 | 0.8 | 11.8 | W | OB1b |
| 118 | 05:33:25.76 | -01:32:18.7 | 14.70 | 1.26 | K5 | -1.0 | 0.5 | -0.72 | 31.6 | 0.6 | 15.9 | W | OB1b |
| 249 | 05:33:29.30 | -01:30:28.2 | 17.00 | 2.69 | M3 | -5.5 | 0.3 | -6.05 | 32.9 | 1.9 | 4.2 | W | OB1b |
| 250 | 05:33:36.11 | -01:28:52.6 | 15.00 | 1.69 | K6 | -1.3 | 0.5 | -1.30 | 29.8 | 0.7 | 15.8 | W | OB1b |
| 251 | 05:33:41.87 | -01:47:40.7 | 16.14 | 1.94 | M0 | -3.3 | 0.5 | -8.35 | 29.7 | 0.8 | 11.5 | W | OB1b |
| 252 | 05:33:43.63 | -01:13:36.2 | 17.29 | 2.48 | M3 | -3.2 | 0.3 | -3.11 | 27.9 | 1.8 | 4.0 | W | OB1b |
| 253 | 05:33:46.84 | -01:56:55.1 | 15.01 | 1.49 | K3 | -0.5 | 0.4 | -0.63 | 31.5 | 0.6 | 17.2 | W | OB1b |
| 122 | 05:33:47.29 | -01:20:27.3 | 15.85 | 1.85 | M1 | -1.9 | 0.5 | -1.66 | 29.8 | 0.8 | 11.6 | W | OB1b |
| 254 | 05:34:00.70 | -01:50:08.4 | 15.70 | 1.78 | K6 | -2.4 | 0.5 | -2.06 | 31.2 | 0.8 | 12.4 | W | OB1b |
| 255 | 05:34:06.17 | -01:58:55.9 | 16.75 | 2.39 | M3 | -4.4 | 0.2 | -2.98 | 26.7 | 2.2 | 5.1 | W | OB1b |
| 256 | 05:34:15.31 | -01:15:19.6 | 16.57 | 2.46 | M3 | -3.8 | 0.4 | -3.82 | 30.2 | 1.7 | 5.6 | W | OB1b |
| 257 | 05:34:15.46 | -01:34:29.8 | 17.77 | 2.80 | M4 | -7.3 | 0.5 | -7.35 | 27.6 | 2.1 | 3.3 | W | OB1b |
| 258 | 05:34:17.87 | -01:41:08.0 | 14.57 | 1.50 | K4 | -1.6 | 0.5 | -0.56 | 27.2 | 0.7 | 14.1 | W | OB1b |
| 134 | 05:34:38.98 | -01:46:56.4 | 15.25 | 1.71 | M0 | -4.6 | 0.5 | -2.84 | 29.0 | 0.6 | 14.9 | W | OB1b |
Note. — The classification in column Type (C=CTTS, W=WTTS) is based on spectral dependent threshold following White & Basri (2003). Spectral type errors are 1 subclass. Stars CVSO-200, 238 and 246 have no low-resolution spectra available yet. They were classified as T Tauri stars from the Hectochelle spectra based on the following criteria: having the appropriate magnitudes and colors, radial velocity within 1- of the peak of the velocity distribution for their location, peculiar H emission, either a blue-shifted absorption component to H or this line very strongly in emission (the later is the case for CVSO-238).
Table 2 is published in its entirety in the electronic version of the Astrophysical Journal. A portion is shown here for guidance regarding its form and contents.