Spitzer Power-law AGN Candidates in the Chandra Deep Field-North
Abstract
We define a sample of 62 galaxies in the Chandra Deep Field-North whose Spitzer IRAC SEDs exhibit the characteristic power-law emission expected of luminous AGN. We study the multiwavelength properties of this sample, and compare the AGN selected in this way to those selected via other Spitzer color-color criteria. Only 55% of the power-law galaxies are detected in the X-ray catalog at exposures of Ms, although a search for faint emission results in the detection of 85% of the power-law galaxies at the detection level. Most of the remaining galaxies are likely to host AGN that are heavily obscured in the X-ray. Because the power-law selection requires the AGN to be energetically dominant in the near- and mid-infrared, the power-law galaxies comprise a significant fraction of the Spitzer-detected AGN population at high luminosities and redshifts. The high 24 µm detection fraction also points to a luminous population. The power-law galaxies comprise a subset of color-selected AGN candidates. A comparison with various mid-infrared color selection criteria demonstrates that while the color-selected samples contain a larger fraction of the X-ray luminous AGN, there is evidence that these selection techniques also suffer from a higher degree of contamination by star-forming galaxies in the deepest exposures. Considering only those power-law galaxies detected in the X-ray catalog, we derive an obscured fraction of 68% (2:1). Including all of the power-law galaxies suggests an obscured fraction of % (4:1).
Subject headings:
galaxies: active — infrared: galaxies — X-rays: galaxies1. Introduction
Detecting complete samples of AGN, both locally and in the deep cosmological fields, has been a major ongoing goal. Hard X-ray selection is a powerful way to detect both relatively uncontaminated and complete samples of AGN. Deep X-ray surveys with Chandra and XMM-Newton have now resolved 70-90% of the cosmic X-ray background (CXRB) at 2-8 keV into discreet sources (Mushotzky et al. 2000; Giacconi et al. 2002; Alexander et al. 2003; Bauer et al. 2004; Worsley et al. 2004, 2005), detecting the majority of the X-ray unobscured AGN population in the deep X-ray fields. At high column densities, however, the dust and gas surrounding the central engine (in combination with that located in the host galaxy) are capable of hiding virtually all accessible AGN tracers. Therefore, while the overall resolved fraction of the CXRB is high, it drops with increasing energy to 60% at 6-8 keV and to 50% at 8 keV (Worsley et al. 2004, 2005).
Population synthesis models of the CXRB and of X-ray luminosity functions therefore predict a significant population of heavily obscured AGN not detected in the deepest X-ray fields (i.e., the 1 Ms Chandra Deep Field–South (CDF-S) and the 2 Ms Chandra Deep Field–North (CDF-N)). Predictions of their properties are in rough, but not complete, agreement. Treister et al. (2004) predict an X-ray incompleteness of 25% at cm-2 and of 70% at cm-2. Ballantyne et al. (2006) estimate that the deep X-ray surveys miss % of obscured AGN with log (ergs s-1) at all , and that most of the missing objects are Compton-thick (log (cm-2)). Worsley et al. (2005) find that the unresolved sources are likely to lie at redshifts of , have column densities in excess of cm-2, and have intrinsic X-ray luminosities of ergs s-1.
Numerous attempts have been made to detect this population of heavily obscured AGN, many of which have focused on the mid-infrared (MIR) emission where the obscured radiation is re-emitted (Ivison et al. 2004; Lacy et al. 2004; Hatziminaoglou et al. 2005; Stern et al. 2005; Alonso-Herrero et al. 2006; Polletta et al. 2006) or on combinations of MIR and multi-wavelength data (Johansson et al. 2004; Yan et al. 2004, 2005; Donley et al. 2005; Franceschini et al. 2005; Houck et al. 2005; Leipski et al. 2005; Martínez-Sansigre et al. 2005, 2006; Richards et al. 2006; Weedman et al. 2006). In the MIR, luminous AGN can often be distinguished by their characteristic power-law emission, which extends from the infrared to the ultraviolet (e.g. Neugebauer 1979; Elvis et al. 1994). This emission is not necessarily due to a single source, but can arise from the combination of non-thermal nuclear emission and thermal emission from various nuclear dust components (e.g. Rieke & Lebofsky 1981). In contrast, star-forming galaxies are characterized by dust and stellar emission features redward and blueward of a local minimum at µm.
We focus here on AGN with red power-law SEDs in the Spitzer 3.6-8.0 µm bands. Alonso-Herrero et al. (2006) selected a sample of 92 such sources in the CDF-S, 70% of which are hyper-luminous infrared galaxies (HyperLIRGS, log LIR(L☉)) or ultra-luminous infrared galaxies (ULIRGS, log LIR(L☉)). Nearly half (47%) of their power-law sample were not detected in X-rays at exposures of up to 1 Ms. We use a selection similar to that of Alonso-Herrero et al. (2006) to identify power-law galaxies in the 2 Ms CDF-N. Because the central regions of the Chandra Deep Fields are photon-limited, not background-limited, the 2 Ms CDF-N is twice as sensitive as the 1 Ms CDF-S at the Chandra aimpoint (e.g. Alexander et al. 2003).
We use a combination of spectroscopic and photometric redshifts to estimate distances and luminosities for this class of AGN, placing them in the context of the overall AGN population. The observations and data reduction are outlined in §2 and the selection criteria are discussed in §3. The photometric redshift code is discussed in §4. Making use of the deepest available (2 Ms) X-ray data, we search for faint X-ray emission from sources missed in the X-ray catalogs. The X-ray, MIR, radio, and optical properties of the sample, including detection fractions, X-ray luminosities, radio classifications, and optical–MIR SEDs, are discussed in §5. In §6, we compare the power-law selection to other MIR color selection techniques, and discuss the completeness and reliability of the power-law and color-selection criteria. Finally, in §7, we use the X-ray data to calculate the obscuring columns of the power-law galaxies and to estimate the obscured fraction of the power-law sample. Throughout the paper, we assume a cosmology of (,)=(0.3, 0.7, 72 km s-1 Mpc-1).
2. Observations and Data Reduction
Spitzer was used to obtain MIPS and IRAC MIR observations of the CDF-N, with 1400 s and 500 s exposures, respectively. We use these MIPS GTO images in place of the GOODS Spitzer data because the former cover the full CDF-N, whereas the latter cover a field approximately two times smaller. The MIPS image was processed using the MIPS GTO data analysis tool (Gordon et al. 2004, 2005); the IRAC data analysis is described in Huang et al. (2004). We used the iraf task allstar to select sources at 24 µm, and SExtractor (Bertin & Arnouts 1996) to select sources in the IRAC bands. The 80% completeness limit for the 24 µm data is 83 Jy (Papovich et al. 2004). The IRAC detection limits of our survey (see §3) are 1.8, 2.8, 14.5, and 18.0 Jy, at 3.6, 4.5, 5.8, and 8.0 µm, respectively. Optical and NIR photometry were measured from the GOODS dataset (bviz, Giavalisco et al. 2004), as well as from the data of Capak et al. (2004) (UBVRIz’HK’). The ground-based photometry was aperture-matched for consistency, using the aperture of the most sensitive band in which the source was detected. For cases in which multiple ground-based sources in a 1.5″ radius caused the aperture-matched flux density to differ from that of the nearest source by a factor of 1.5, we replaced the aperture-matched flux densities with the cataloged flux densities of the nearest source in all bands. In addition, if the ground-based photometry of sources with multiple GOODS counterparts (in a 1.5″ radius) differed from the GOODS photometry by a factor of 2 or more in any of the bands, we treated the ground-based photometry as upper limits. For further details, see Pérez-González et al. (2005).
3. Sample selection
We selected as power-law galaxies sources that were detected with in each of the four IRAC bands and whose IRAC spectra are well-fit by a line of spectral index , where . In a similar study, Alonso-Herrero et al. (2006) chose a limit of based on the mean spectral slope of optically-selected quasars (, Elvis et al. 1994; Neugebauer et al. 1979) and the optical spectral indices of Sloan Digital Sky Survey (SDSS) QSOs ( to -2, Ivezić et al. 2002). For comparison, broad-line AGN (BLAGN) from the AGN and Galaxy Evolution Survey (AGES, C. S. Kochanek et al., in prep) have 3.6-8 µm slopes of (Stern et al. 2005), indicating that our cut lies within of the mean. To ensure a good linear fit, we applied a cut in the chi-squared probability of . is the probability that a fit to a power-law distribution would yield a value greater than or equal to the observed chi-squared; a probability of 0.5 corresponds to a reduced chi-squared of 1. tends to either lie close to 0.5, or is very small (see Bevington & Robinson 2003). Because we are primarily interested in the X-ray and radio properties of the power-law galaxies, we also restricted the sample to those galaxies with X-ray exposures of Ms (Alexander et al. 2003); this selection also ensures deep 1.4 GHz radio coverage (Richards 2000) and results in a total survey area of 350 arcmin2. In addition, we required the IRAC SED to rise monotonically in to prevent contamination from star-forming galaxies with possible stellar features in the IRAC bands (resulting in the rejection of 10 sources). Using these criteria, we identified 79 power-law galaxies in the CDF-N.
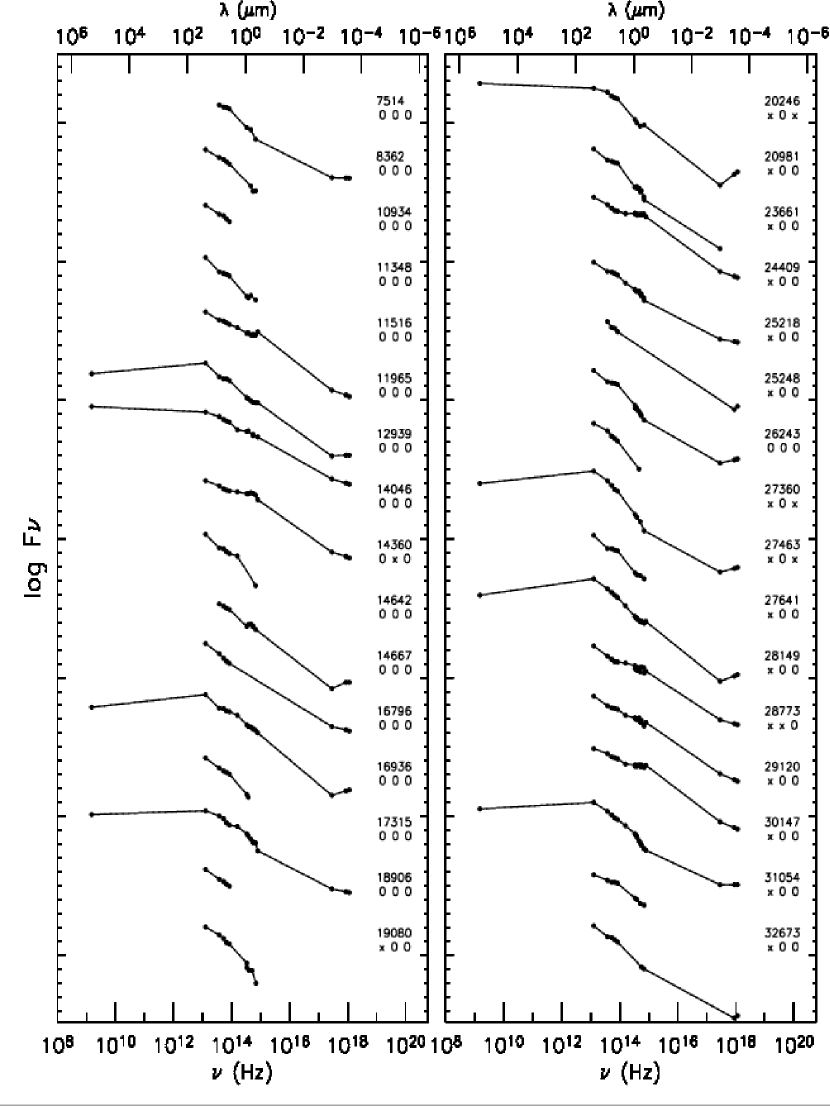
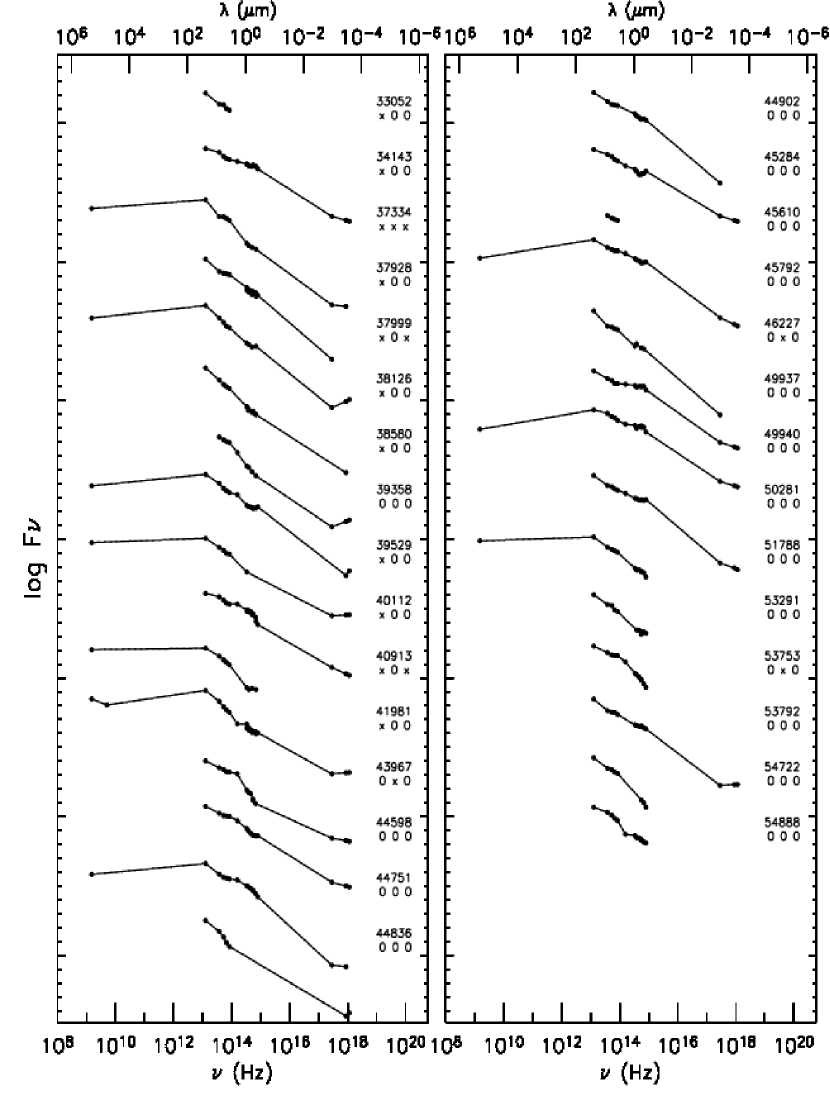
We removed 10 of the selected galaxies due to blended or problematic IRAC photometry and we removed 1 galaxy (CDFN 22363) because of its stellar-dominated spectrum. CDFN 22363 has a shallow slope of only and hence might have been scattered into the power-law sample by noise (it has the second flattest slope in the sample). It is the only source in the power-law sample with a spectroscopic redshift that is not detected in X-rays, and it lacks a 24 µm counterpart (see §5.2). Six additional sources were removed because their optical-MIR SEDs exhibited possible stellar bumps. The final sample of 62 power-law galaxies is listed in Table 1; radio through X-ray SEDs are shown in Figure 1. We indicate in Figure 1 the 27 sources that lie in the GOODS ACS region. In addition, we flag all sources for which we have either replaced the ground-based aperture-matched flux densities with the cataloged flux densities of the nearest source or for which we treat the ground-based photometry as upper limits (see §2).
The cut of 6 in each of the IRAC bands imposes the following detection limits on the IRAC 3.6, 4.5, 5.8, and 8.0 µm bands: 1.8, 2.8, 14.5, and 18.0 Jy. This large range of flux limits imposes complicated selection effects on the power-law sample. At , the sample is flux-limited by the 5.8 µm band. That is, all sources whose 5.8 µm flux density exceeds the detection limit of 14.5 Jy are detectable in all of the IRAC channels. At , however, the limiting flux shifts to the 8.0 µm band. Because there is little change in the 5.8 µm detection limit for red power-law sources with ( increases from 14.5 Jy at to 15.3 Jy at ), the power-law sample is essentially flux-limited in the 5.8 µm band. Comparisons between the number of red () and blue () sources in the full IRAC sample, however, will be complicated by these effects, as the 5.8 µm limiting flux increases with increasing spectral slope, reducing the number of blue sources that meet the requirements of the power-law sample.
To minimize the chances of selecting non-active galaxies via the power-law selection, we compared the spiral galaxy templates from Devriendt et al. (1999) to the optical–MIR SEDs of the sources. None of the sources in the final sample are well-fit by a spiral template. In addition to contamination from local spiral galaxies, Alonso-Herrero et al. (2006) found that cool ULIRGS at and with could appear as power-law galaxies. Of the 62 power-law galaxies in the sample, nine have and potentially lie at . Seven of these sources, however, have X-ray counterparts, and all but one (a source with no redshift estimate) have X-ray luminosities of log (ergs s-1), and are therefore unlikely to be starburst-powered ULIRGS. We further explore the possibility of contamination due to star-forming galaxies in §6.2.2, using several updated SEDs, described in detail in Appendix A.
We have also considered whether the contributions of 3.3 µm () and 6.2 µm () aromatic emission features to the flux in the IRAC 8.0 µm band could create the appearance of a red power-law continuum. Observations of starbursts detect these aromatic features to equivalent widths of µm and µm, respectively (Risaliti et al. 2006; B. R. Brandl et al., in preparation). Due to the large bandpass of the 8.0 µm IRAC channel, however, the 3.3 and 6.2 µm emission features should have at most a 3% or 20% effect, respectively, on the total flux. (The models of Devriendt et al. (1999) predict a slightly larger (20%) effect due to the 3.3 µm feature (Stern et al. 2005)). Given the small impact of these features and the small number of power-law galaxies with for which the 8 µm feature could have an effect, we expect little contamination in the sample.
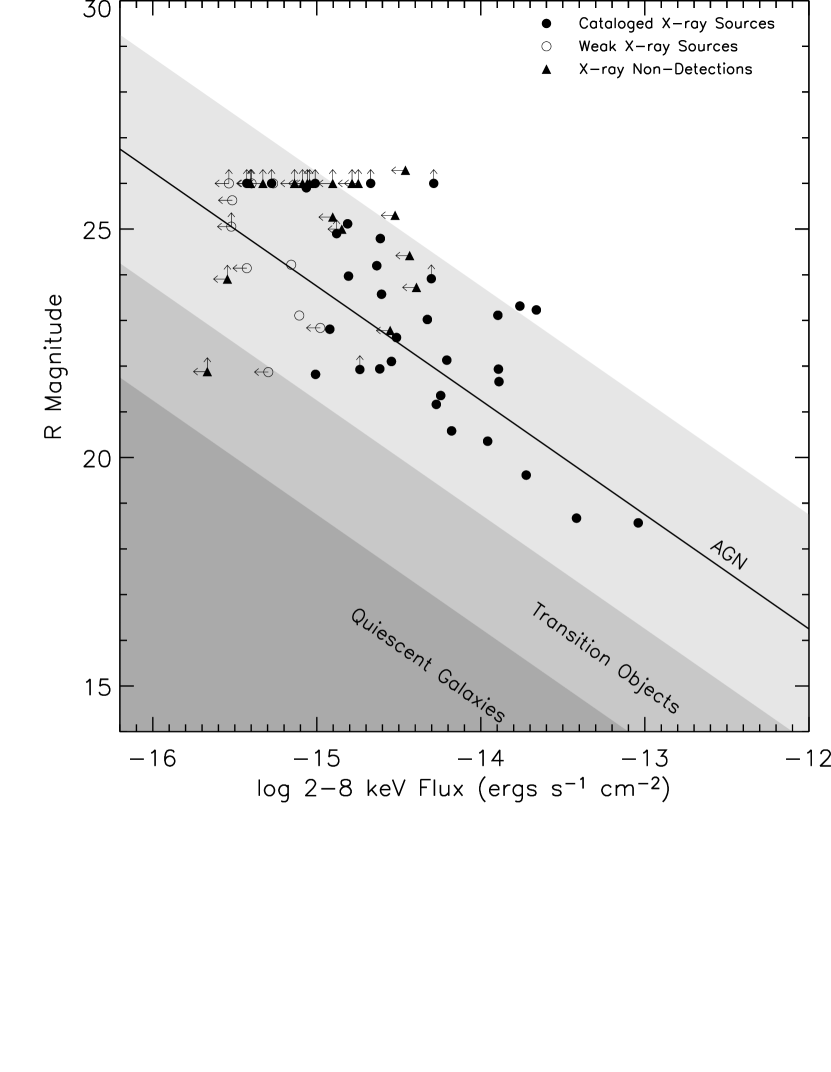
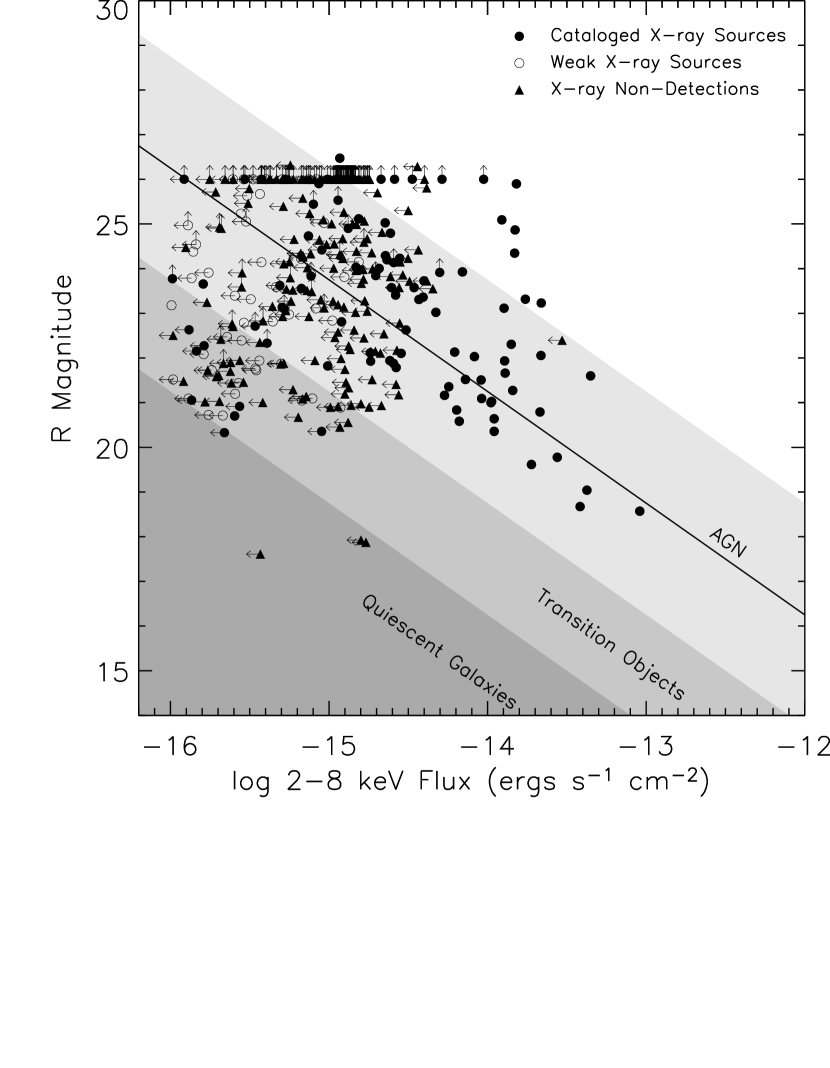
As a final check on the selection criteria, we plot in Figure 2 the ratio of X-ray to optical emission, a well-known AGN diagnostic (e.g. Maccacaro et al. 1988; Barger et al. 2003; Hornschemeier et al. 2003). Sources not detected in R-band are assigned a lower limit of 26 mag, the approximate completeness limit of the R-band catalog of Capak et al. (2004). As was found by Alonso-Herrero et al. (2006), all of the power-law galaxies lie within the region typically populated by AGN or transition objects, given the current X-ray and optical limits. Four of the X-ray sources appear to be optically-faint with respect to their X-ray fluxes (e.g. Rigby et al. 2005).
4. Redshifts
Twenty one of the power-law galaxies have secure spectroscopic redshifts (Barger et al. 2001, 2002, 2003; Hornschemeier et al. 2001; Dawson et al. 2003; Cowie et al. 2004; Swinbank et al. 2004; Wirth et al. 2004 [Team Keck Redshift Survey]; Chapman et al. 2005; the Sloan Digital Sky Survey [SDSS]) and 2 additional sources have photometric redshifts from Barger et al. (2003). The spectroscopic redshifts range from to , with a mean of and a median of . Of these 21 sources, 15 are classified as broad-line AGN, 4 have low narrow emission lines, and 2 are AGN whose line width is not classified in the available literature.
We supplement the available spectroscopic redshifts with photometric redshifts. Photometric redshifts were estimated with an improved version of the method described in Pérez-González et al. (2005). Our technique is based on the construction of a complete set of SED templates composed from the galaxies with highly reliable spectroscopic redshifts (about 1500 sources selected in the CDF-N and CDF-S), which are later used to fit the SEDs of all the sample and estimate a photometric redshift. The technique described in Pérez-González et al. (2005) has been improved by significantly increasing the resolution of the templates. This is achieved by fitting the SEDs from the UV to the FIR to stellar population synthesis and dust emission models. With this improvement, by comparing with all the available spectroscopic redshifts, our photometric redshifts have a value of 0.1 for 88% of the galaxies in the CDF-N and CDF-S, and 0.2 for 96% of these sources. The average (median) value of is 0.05 (0.03). Further details about the photometric redshift technique can be found in P. G. Pérez-González et al. (2007, in preparation).
Using this technique, we estimated redshifts for an additional 20 sources, bringing the total number of power-law galaxies with redshifts or redshift estimates to 43 (69%). We plot in Figure 3 a comparison between the photometric and spectroscopic redshifts of what we will refer to as the ’comparison sample’. This sample consists of the 1420 IRAC sources that meet the detection cut of in each of the IRAC bands and that have X-ray exposures Ms; the 11 sources in the original power-law sample removed due to bad or blended photometry were excluded. The mean (median) spectroscopic redshift of the comparison sample is . Nearly half of the sources in the comparison sample have IRAC SEDs that cannot be fit by a power-law. Of the remaining galaxies, 6% and 40% can be fit by red () or blue () power-laws, respectively. Only 50% of the X-ray sources in the main CDF-N catalog (Alexander et al. 2003) meet the exposure time and IRAC cuts used to define the comparison sample.


We also plot in Figure 3 the redshift comparison for those galaxies that meet the power-law criterion. While the power-law galaxies tend to be the farthest outliers, the agreement between the spectroscopic and photometric redshifts is reasonable, given the difficulty in assigning redshifts to sources with power-law dominated SEDs. Notably, several power-law galaxies at low spectroscopic redshifts have been assigned high redshifts by our photometric code. We take this into consideration during the analysis, and rely on spectroscopic redshifts alone wherever possible. Nonetheless, the success rate in the photometric redshifts (defined by agreement to 2 standard deviations) implies that our total suite of redshifts is 80% correct.
As shown in Figure 4, the power-law galaxies tend to lie at significantly higher redshift than both the average source from the comparison sample and X-ray–detected members of the comparison sample, a trend that will be investigated further in §5.1.2. The power-law galaxies are comparable in number to the X-ray–detected AGN in the comparison sample at , although as will be discussed in §5.1, only half of the power-law galaxies are cataloged X-ray sources. Alonso-Herrero et al. (2006) similarly found that the power-law galaxies have a relatively flat redshift distribution (with the exception of a spike at ), with most sources lying at .
5. Multiwavelength Properties
In the following sections, we discuss the X-ray, infrared, radio, and optical properties of the power-law galaxies. We show that while only 55% of them have cataloged X-ray counterparts, as many as 85% show evidence for faint X-ray emission. These X-ray–detected power-law galaxies make up a significant fraction of the X-ray luminous AGN in the comparison sample. As such, they are detectable to large distances, explaining the high redshifts of the sample.
The power-law galaxies also have a 24 µm detection fraction of nearly unity, which we show to be indicative of an intrinsically luminous X-ray population. While only 29% of the sources have radio counterparts, and all but 2 are radio-quiet, nearly all of the power-law galaxies also have radio luminosities or upper limits consistent with that of AGN-dominated sources. It is therefore likely that the power-law galaxies not detected in the X-ray are intrinsically luminous AGN hidden behind high columns of obscuring gas and dust. The optical–MIR SEDs of the sample, which are flatter than the typical radio-quiet (star-formation subtracted) AGN SED (Elvis et al. 1994), also suggest increasing obscuration in the sources not detected in the X-ray. The optical detection fraction in the GOODS field is high (85%), with approximately 50% of the X-ray sources having compact optical counterparts.
5.1. X-ray Emission
Of the 62 power-law galaxies, only 34 (55%) have cataloged X-ray counterparts in the Alexander et al. (2003) catalog of the 2 Ms CDF-N X-ray field111Throughout the paper, we use only the main source catalog from Alexander et al. (2003), and do not include the lower-significance X-ray sources detected in the supplemental optically bright X-ray catalog. No power-law galaxies and only 2 of the color-selected sources discussed in §6.2 are detected in the optically bright catalog.. Sources in the Alexander et al. (2003) catalog were chosen using WAVDETECT (Freeman et al. 2002) with a false-positive probability threshold of . For those power-law galaxies without X-ray counterparts, we searched for faint X-ray emission following the procedure outlined in Donley et al. (2005). We restricted this search to sources with off-axis angles of , as sources that lie outside this radius fall in regions of rapidly changing exposure, and often have sky backgrounds that cannot be well-fit by Poisson distributions; 84% (52) of the power-law galaxies met this criterion. Of these, 58% (30) are detected in the Alexander et al. catalog, 19% (10) have at least a 2.5 detection in one X-ray band and at one encircled-energy radius (EER)222The 80% EER refers to the radius within which 80% of the energy is found., and 13% (7) remain non-detected. Coadding the 7 non-detected power-law galaxies does not lead to a detection. Four additional sources lie too close to a cataloged X-ray source to search for faint emission, and 1 source (CDFN 8362) has an irregular sky background, preventing us from accurately testing for detection. If we assume that, like those sources for which we could test for emission, 85% of the 5 sources with nearby counterparts or irregular sky backgrounds would be detected (either strongly or weakly), then 85% of the power-law galaxies show evidence for X-ray emission, while 15% do not. Changing the detection threshold to 3, 4, and 5 changes the detected fraction to 77%, 71%, and 65%, respectively.
We list the X-ray properties of the weakly-detected power-law galaxies in Table 2. If a source was not detected to in one or more of the three bands, we list in Table 2 a conservative upper limit, measured by adding any positive source flux to a 2.5 limit on the local sky background. The 70% EER was used to calculate both the source counts and sky background; no aperture correction was applied. For those power-law galaxies without a cataloged or weak X-ray counterpart, we list in Table 1 5 upper limits, calculated as described above.
While Alonso-Herrero et al. (2006) found that their sample of power-law galaxies included about 1/3 of the hard X-ray sources with 24 µm detections, our more conservative selection detects only 14% of the X-ray sources in the Alexander et al. (2003) catalog that meet our exposure time cut of 0.5 Ms and that have 24 µm flux densities of Jy. (Further restricting the comparison to those X-ray sources that also meet our IRAC significance cut of only increases the selection fraction to 17%). If we consider only those X-ray and MIR sources in the CDF-N catalog with log (erg s-1) (to rule out sources dominated by star-formation), the X-ray–detected power-law galaxies comprise of the X-ray sources (with exposures of Ms) detected at 24 µm (to Jy). Because our selection criteria were designed to be quite robust, we exclude a number of IRAC color-selected AGN candidates with power-law like emission (see §6). Determining the intrinsic proportion of “power-law” AGN will therefore require a more careful analysis. As mentioned in §4 and shown in Figure 4, the power-law galaxies comprise a significantly higher fraction of the high-redshift X-ray sources.
5.1.1 Dependence on Sample Properties
We plot in Figure 5 the X-ray detection fraction for the power-law galaxies as a function of redshift, X-ray exposure time, power-law slope, and power-law fit probability, where we consider as ’detected’ only those sources with cataloged X-ray counterparts. For the sources with redshift estimates, X-ray detection appears to be relatively insensitive to redshift. The X-ray detection fraction, however, is higher for those sources with redshift estimates (70%) than for the full power-law sample (55%). The detection fraction as a function of X-ray exposure time is lower than average at the lowest exposures, as expected, but does not increase substantially at the highest exposures. We note that in our analysis of the X-ray detection fraction in §5.1, we considered only those power-law galaxies with off-axis angles of , and therefore excluded 6 of the 10 sources in the lowest two exposure bins. There is significant variation in the detection fraction as a function of power-law index, with an increase at the steepest indices and a possible decrease at the flattest indices. The power-law fit probability, however, appears to have a minimal effect on the X-ray detection fraction, with only a slight drop towards the highest values of (recall that , not , is ideal). These results suggest that the X-ray detection fraction of the power-law sample is relatively insensitive to variations in redshift, X-ray exposure time, and power-law properties, to the limits imposed by our selection criteria.
5.1.2 X-ray Luminosity
We plot in Figure 6 the observed 0.5-8 keV X-ray luminosities of the power-law galaxies and the members of the comparison sample detected in the X-ray catalog. The luminosities of sources selected via the Lacy et al. selection criteria (see §6.2) are also plotted. As was discussed by Alonso-Herrero et al. (2006), power-law galaxies have X-ray luminosities typical of AGN (log (ergs s-1)), and significantly higher than those of star-forming galaxies (log ( ergs s-1)).
The power-law galaxies comprise a significant fraction of the high luminosity sample. This is not surprising, as the power-law selection requires the AGN to be energetically dominant, and therefore preferentially selects the most luminous AGN. To illustrate the effect of X-ray luminosity on the AGN contribution to the optical through MIR continuum, we plot in Figure 7 the median rest- and observed-frame optical-MIR SEDs of the X-ray–detected members of the comparison sample, as a function of X-ray luminosity. We normalize the SEDs to the 12 µm monochromatic power, which, for the rest-frame comparison, is representative of bolometric luminosity and independent of galaxy or AGN type (Spinoglio & Malkan 1989). As can be seen, low-luminosity X-ray sources are dominated by the 1.6 µm stellar bump in the optical-NIR bands (e.g. Alonso-Herrero et al. 2004). The relative strength of this feature decreases with increasing X-ray luminosity, and disappears almost entirely at luminosities of , taking on the characteristic power-law shape required by the selection used here. The fraction of X-ray sources in the comparison sample that can be fit by red, AGN-dominated power-laws () is therefore a strong function of X-ray luminosity, increasing from 0% at log (ergs s-1) to 3%, 24%, and 59% at luminosity limits of log (ergs s-1). Blue power-laws () in the IRAC bands are indicative of stellar-photosphere-dominated SEDs in the rest-frame near-infrared (for ). The corresponding percentages of X-ray sources fit by blue power-laws are 39%, 46%, 41%, and 14%, showing the reduced proportion of stellar-dominated objects in the highest luminosity bin.


A similar trend is seen as a function of redshift. In a flux limited sample such as this, low-luminosity AGN are detected primarily at low redshift, whereas high-luminosity AGN are detectable over a range of redshifts (see Figure 8). To first order, the high redshifts of the power-law sample can therefore be explained by their preferentially high luminosities. In addition, AGN with high X-ray luminosities have comoving space densities that peak at higher redshifts than low-luminosity AGN, amplifying the selection effect discussed above (e.g. Ueda et al. 2003). The color-redshift relation for AGN may also play a minor role in this trend. Richards et al. (2006) show that the 3.6 µm to 5.8 µm color (log()) of an AGN with the median radio-quiet SED (Elvis et al. 1994) shifts from 0.2 at to 0.44 at before falling to 0.08 at . As will be shown in §5.4, however, the power-law galaxies tend to have flatter SEDs than the Elvis et al. (1994) AGN template and as such, they should have colors less sensitive to changes in redshift.
5.2. 24 µm Emission
Unlike Alonso-Herrero et al. (2006), we do not require a 24 µm detection for source selection. However, all but 5 of the power-law galaxies have a cataloged 24 µm counterpart within a 2″ radius. The 24 µm flux densities are listed in Table 1. Of the remaining 5 sources, 3 (CDFN 7514, CDFN 14642, and CDFN 25218) have a cataloged counterpart within 2-3″. For these power-law galaxies, we use the flux density of the nearby source as an upper limit if it exceeds our nominal limit of 80 Jy. One additional power-law galaxy, CDFN 45610, lies within the PSF of a bright 24 µm source, preventing a detailed analysis of its properties. Only one source, CDFN 38580, an X-ray–detected power-law galaxy at (Chapman et al. 2005), shows no evidence for 24 µm emission. As was found for the power-law X-ray sources in the EGS (Barmby et al. 2006), there is only weak agreement between the 24 µm flux densities and those predicted by extending the IRAC power-law fit, with the X-ray–detected and X-ray non-detected power-law galaxies having observed 24 µm flux densities that tend to lie within only 53% and 60% of the predicted values, respectively.
The fraction of AGN in MIR samples has been shown to increase with increasing 24 µm flux density (Treister et al. 2005; Brand et al. 2006) in general agreement with the models of Pearson (2005). We would therefore expect luminous AGN in a flux-limited sample to have a high 24 µm detection fraction, such as that seen for the power-law sample. To test this, we plot in Figure 9 the 24 µm detection fraction for the members of the comparison sample as a function of X-ray luminosity. The detection fraction is relatively high (%) at X-ray luminosities typical of starburst galaxies (log ( ergs s-1), see Alexander et al. 2002). This is not surprising, as rapidly star-forming galaxies with large numbers of X-ray binaries will also be luminous infrared sources. The detection fraction then drops to % at luminosities typical of starbursts and low-luminosity AGN ((ergs s-1)) before rising to 100% at log (ergs s-1). Because the comparison sample is composed of objects with high significance IRAC MIR detections, the 24 µm detection fraction is higher than that of an unbiased sample. For comparison, Rigby et al. (2004) find an overall 24 µm detection fraction of only 60% for hard X-ray sources in the CDF-S. Nevertheless, for AGN-dominated sources, a high 24 µm detection fraction like that of the power-law galaxies accompanies an X-ray-luminous AGN population. We note that of the 18 power-law galaxies not detected in X-rays, all but one are detected at 24 µm, with the exception being CDFN 45610, the power-law galaxy that lies in the PSF of a bright 24 µm source. Therefore, if these sources are AGN-dominated as expected, it is likely that they, along with the rest of the power-law sample (§5.1.2 and Figure 6), are intrinsically X-ray luminous but heavily obscured.
5.3. Radio Loudness
Eighteen of the 62 power-law galaxies (29%) have cataloged radio counterparts from the Richards (2000) 1.4 GHz VLA survey of the CDF-N. This survey has a detection limit of 40 Jy and is 95% complete at 80 Jy. In addition, 3 of these power-law galaxies (CDFN 16796, CDFN 27641, and CDFN 37999) are members of the radio-selected sub-millimeter SCUBA sample of Chapman et al. (2005), as is one radio source that fell below the Richards (2000) detection limit (CDFN 38580). For comparison, Polletta et al. (2006) found that half of their obscured AGN sample were radio-detected, although their radio limits were deeper and their IRAC coverage more shallow.
Since all of the radio-detected power-law galaxies are also detected at 24 µm, we can test for radio-loudness via the parameter , where = log (f/f) (see Appleton et al. 2004). Sources with have far more radio emission (with respect to MIR emission) than is expected from the radio/infrared correlation of radio-quiet AGN and star-forming galaxies, and are referred to as radio-excess AGN (e.g. Yun, Reddy, & Condon 2001, Donley et al. 2005). Kuraszkiewicz et al. (2007) show that is less sensitive to reddening and host galaxy dilution than measures of radio loudness based on radio and optical flux densities. Only 2 of the 18 radio-detected power-law galaxies are radio-excess AGN; the remaining galaxies are consistent with the radio/infrared correlation333We note that the radio-excess AGN CDFN 12939 was not included in the sample of Donley et al. (2005) because its X-ray exposure time fell slightly below the more stringent cut of 1 Ms. The source CDFN 20246 corresponds to VLA 123709+622258 in Donley et al. (2005).. Kuraszkiewicz et al. (2007) find that 15% of AGN are radio-intermediate or radio-loud based on a cut of , consistent with the radio-loud fractions of Kellermann et al. (1989) and Stern et al. (2000). The fraction of radio-excess AGN in the power-law sample (3%) may therefore be lower than average.
Both sources classified as radio-excess AGN have a cataloged X-ray counterpart; 11 of the remaining 16 radio sources are also bright X-ray sources, while 3 are weakly-detected. Only two radio sources (CDFN 40913 and CDFN 51788) are not detected in the X-ray. As such, selection criteria that include a radio flux density cut may be more likely to select X-ray bright AGN than selection via MIR properties alone. If such a cut were based on the current sensitivity of the CDF-N radio and X-ray surveys, however, only 13 of the 34 power-law galaxies detected in the X-ray catalog (38%) would be selected; the remaining 62% would be missed.
While the majority of the power-law galaxies with radio counterparts appear to be radio-quiet as defined by the radio/infrared correlation, their radio luminosities are consistent with those of AGN-powered sources. In the local universe, galaxies with log (W Hz-1) tend to be AGN-dominated (Condon et al. 2002; Yun et al. 2001). In the GOODS-North (GOODS-N) field, Morrison et al. (2006) show that galaxies with log (W Hz-1) and have up to an 80% X-ray detection rate. While a source of this luminosity could be a star-formation powered ULIRG (from the radio/infrared correlation, a radio luminosity of log (W Hz-1) corresponds to a total infrared (TIR, 8-1000 µm) luminosity of (Bell 2003)), the high X-ray detection rate suggests that the population is dominated by AGN.

All 16 of the 18 radio-detected power-law galaxies with redshifts have observed 1.4 GHz luminosities in excess of log (W Hz-1), and 14 (88%) have log (W Hz-1). In addition, 26 of the 27 radio non-detected power-law galaxies with redshifts have upper limits greater than log (W Hz-1) (the exception being CDFN 49937, a low-luminosity X-ray source), and 21 (78%) have limits greater than log (W Hz-1). Using a cut of log (W Hz-1), Morrison et al. (2006) found that 60% of luminous radio galaxies in the GOODS-N field have power-law dominant SEDs. Using the same cut, we find that as many as 81% of power-law selected AGN are radio luminous, though not necessarily radio-loud.
5.4. Optical Morphology and Detection Fraction
While it is difficult to determine optical morphologies for faint sources, particularly those with only ground-based optical data, at least 20 of the power-law galaxies have point-like optical/NIR counterparts (8 of which were detected in the GOODS Hubble Space Telescope (HST) field, and 12 of which have only ground-based data). Of these, 18 are detected in the X-ray, one is weakly-detected, and one is non-detected. As such, at least % of the X-ray–detected sources have optical counterparts dominated by the central engine. Of the 15 sources with BLAGN spectra, 13 are point-like, compared to 2 of the 4 sources with NLAGN spectra. Of the power-law galaxies with available GOODS HST data, of the sources with optical counterparts are point-like.


Worsley et al. (2006) stacked the X-ray emission from optical sources in the GOODS Fields to test whether these galaxies could account for the remaining unresolved fraction of the CXRB. While the stacked emission of galaxies not individually detected in the X-ray accounts for the unresolved portion of the CXRB at 0.5-6 keV, the reduced sensitivity of Chandra at higher energies makes a determination of the resolved fraction more difficult. They estimate that GOODS optical sources account for at most 40% of the unresolved emission from 6-8 keV, suggesting that some of the missing CXRB sources may also be missed in the GOODS images. Of the 27 power-law galaxies that lie in the GOODS region, 23 (85%) have cataloged GOODS optical counterparts. Two of the sources missed in the catalog (CDFN 32673 and CDFN 39529) are obscured X-ray sources similar to the extreme X-ray/optical sources (EXOs, e.g. Koekemoer et al. 2004), one (CDFN 33052) is not detected in the X-ray, and one (CDFN 25218) is an obscured, weakly-detected X-ray source that may have a faint B-band counterpart. Therefore, at most 7% (2/27) of the power-law galaxies in the GOODS region are obscured AGN not detected in either the GOODS optical or the X-ray catalogs.
5.5. Optical–MIR SEDs
We plot in Figure 10 the median optical through MIR rest-frame SEDs of the cataloged, weakly-detected, and X-ray non-detected power-law galaxies, normalized by their 1.25 µm monochromatic flux densities. For comparison, we plot the median radio-quiet, starlight-subtracted AGN SED of Elvis et al. (1994). The median SEDs of the power-law galaxies are generally flatter than the Elvis et al. SED, and show no evidence of a UV bump. The median SED of the power-law galaxies with X-ray detections resembles that of the BLAGN SED class of Alonso-Herrero et al. (2006); that of the non-detected power-law galaxies drops much more rapidly in the optical, presumably due to increasing optical obscuration, and resembles that of the the NLAGN SED class of Alonso-Herrero et al. (2006). The weakly-detected sources have optical SEDs that fall between those of the detected and non-detected sources, suggesting an intermediate level of obscuration. The steepest IRAC spectral index found in our sample is , only slightly steeper than that found by Alonso-Herrero et al. (2006) ( and Rigby et al. (2005) (.
Brand et al. (2006) show that X-ray detected AGN in the 5 ks XBoötes field and MIR-detected sources with clear signs of AGN activity in their optical spectra tend to have flat MIR spectral slopes (, e.g. Elvis et al. 1994), whereas star-forming galaxies typically have higher values of log. Power-law galaxies have log to , with a mean slope in of , suggesting that, when compared to unobscured AGN flat in log , either relatively more flux is observed at 24 µm or relatively less flux is observed at 8 µm. The power-law galaxies in the X-ray catalog tend to have slightly flatter slopes () than those not strongly detected in X-rays (). This trend can be seen in Figure 10, where the power-law galaxies not detected in the X-ray rise more prominently in log with increasing wavelength than do those galaxies detected in X-rays, suggesting that the X-ray non-detected power-law galaxies are more heavily obscured in the optical.
6. Comparison with other MIR selection techniques
In the following section, we compare the power-law selection technique to a number of other MIR-based AGN selection criteria. While the power-law galaxies display a large range of infrared-to-optical ratios, and cannot be selected on this basis, they comprise a significant fraction of the sources with high infrared-to-optical ratios, suggesting that many heavily optically-reddened sources have power-law continua in the NIR/MIR. The power-law selection more closely matches the Spitzer color-color selection criteria of Lacy et al. (2004) and Stern et al. (2005). We compare the X-ray completeness of these techniques, and show that, like the power-law selection, these color criteria tend to select high-redshift X-ray luminous AGN in the deep X-ray fields. We also discuss the X-ray detection fractions of the color-selected samples, which are lower than that of the power-law sample. We argue that this is due, at least in part, to a larger contamination by star-forming galaxies.
6.1. Optical vs 24 µm Emission
The selection of infrared-bright, optically-faint sources has been suggested as a means of identifying obscured AGN (Houck et al. 2005; Weedman et al. 2006; Yan et al. 2004, 2005). Approximately 40 such sources have been observed with the Spitzer IRS; the majority (75%) are dominated by silicate absorption, indicative of heavy obscuration, or are featureless. Although no deep X-ray information is available for those sources observed thus far, their spectral characteristics suggest that many are likely to be obscured AGN.
Only one member of the power-law sample, CDFN 27360 (an X-ray–detected AGN with a column density of cm-2 (see Table 3)), meets the strict criterion used by Houck et al. (2004) and Weedman et al. (2006) to select infrared-bright, optically-faint sources: mJy and (Houck et al. 2004), or mJy and (Weedman et al. 2006). These selection criteria, however, have been set to ensure that sources can be followed-up effectively with IRS. We plot in Figure 11 the positions of the comparison sample (discussed in §4) on the color-color plot of Yan et al. (2004); with the exception of the 7 sources that are X-ray non-detected at the 2.5 level (see §5.1), 6 of which have no R-band counterpart, only sources detected at 8µm, 24µm, and R-band are shown.

Following Yan et al. (2004, 2005) we define the following quantities:
| (1) |
| (2) |
According to Yan et al. (2004), sources with and are likely to be dust-reddened AGN, although 75% of the luminous starburst candidates with and followed-up with IRS by Yan et al. (2005) appear to be either unobscured AGN or galaxies with both a buried AGN and a starburst component. While the power-law galaxies (and X-ray–detected members of the comparison sample) cover a large range of and , as is expected for a sample of AGN with a variety of redshifts and obscurations, the power-law galaxies comprise an increasingly significant fraction of the highly optically-reddened members of the comparison sample with . This suggests that power-law selection is capable of detecting both optically obscured and unobscured AGN, as expected, and that a significant fraction (20-40%) of the infrared-bright/optically-faint sources in the comparison sample have power-law SEDs in the NIR/MIR. In addition, those power-law galaxies shown to be X-ray undetected to the 2.5 level all have upper limits of , consistent with the expectations for obscured AGN. In the following section, we compare the power-law selection to selection criteria that more closely match those used here.
6.2. Spitzer Color-Color Selection
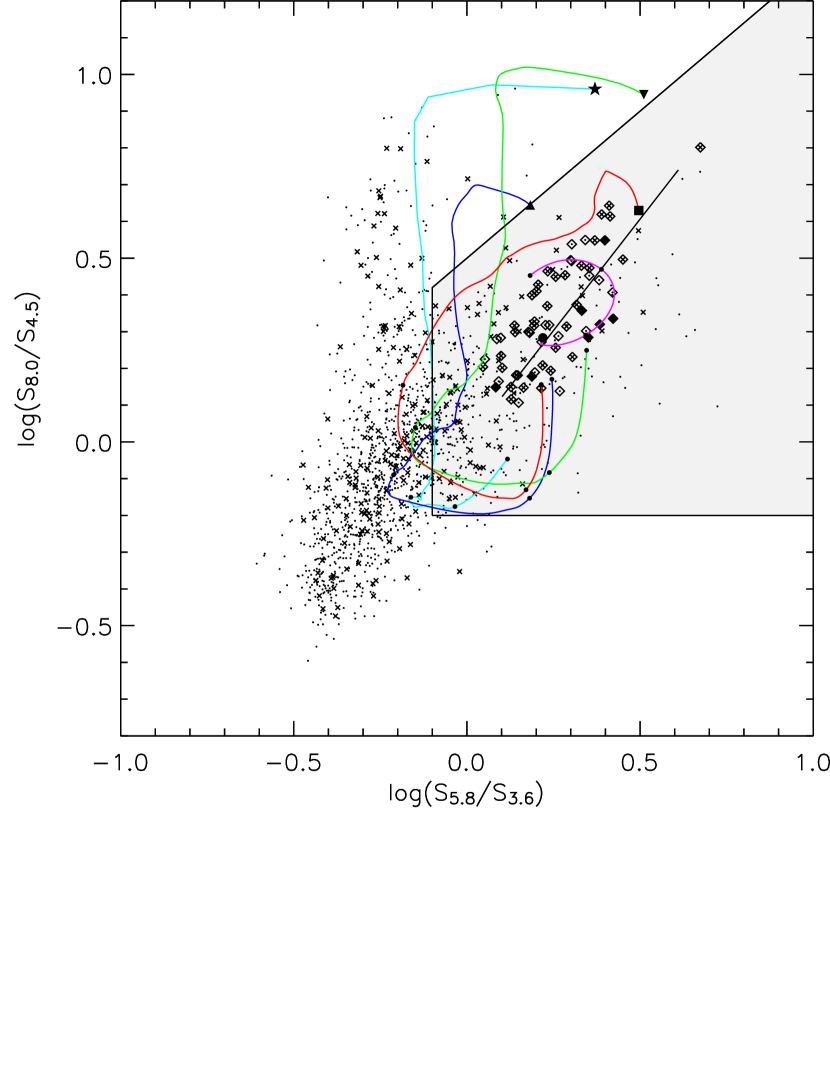
MIR AGN color selection criteria have been defined by Ivison et al. (2004), Lacy et al. (2004), Stern et al. (2005), and Hatziminaoglou et al. (2005). The completeness and reliability of the latter three criteria in selecting X-ray–detected AGN in the Extended Groth Strip (EGS) is discussed by Barmby et al. (2005). We plot in Figures 12 and 13 the position of the power-law galaxies with respect to the IRAC color-color cuts of Lacy et al. (2004) and Stern et al. (2005), both of which have been designed for relatively shallow surveys. In addition, we overplot the redshifted IRAC colors of the Dale & Helou (2002) star-forming template (which is degenerate with their parameter for the wavelengths of interest), the median radio-quiet AGN SED of Elvis et al. (1994), and the SEDs of the ULIRGs Mrk 273, IRAS 17208-0014, and Arp 220, described in Appendix A.
The selection criteria of Lacy et al. are based on SDSS quasars, and therefore are not designed to select AGN in which the host galaxy dominates the MIR energy, as well as AGN that are obscured in the MIR. As discussed in Alonso-Herrero et al. (2006) and as shown in Figure 12, IRAC power-law galaxies fall along a line well within the Lacy et al. selection region, although these galaxies fill only a small fraction of the available color space within the defined cut. Only 16% of the objects from the comparison sample that satisfy the Lacy et al. color cuts also meet the power-law criteria.
The Stern et al. (2005) selection criteria provide a slightly closer match to the power-law selection technique. Stern et al. define their color cut using sources from AGES444the AGN and Galaxy Evolution Survey, C. S. Kochanek et al., in prep, 800 of which are spectroscopically confirmed AGN. Their color criterion identifies 91% of the BLAGN and 40% of the NLAGN in the AGES sample. 17% of the sources that met their AGN criteria were not classified as AGN based on their optical spectra, but may be optically normal (optically dull) AGN. All of the power-law galaxies meet the Stern et al. criteria, and 29% of the sources from the sample that meet the Stern et al. criteria also meet the power-law criteria. The power-law galaxies show a larger scatter about the power-law locus in the Stern et al. diagram (Figure 13) than they do in the Lacy et al. diagram (Figure 12); this is likely to be due, at least in part, to the smaller wavelength baseline probed by the Stern et al. colors.
6.2.1 X-ray completeness of color-selected samples
In the EGS, with an X-ray exposure time of ks, the Lacy et al. and Stern et al. color criteria selected 73% and 51% of the X-ray AGN, respectively (Barmby et al. 2005). In the deeper CDF-N field, these criteria select only 21% and 17% of the Alexander et al. (2003) X-ray sample. However, only 50% of the X-ray sources in the CDF-N meet the exposure time and IRAC cuts used to define the comparison and color-selected samples. When we consider only those X-ray sources in the comparison sample, the Lacy et al. and Stern et al. criteria select 39% and 33% of the X-ray sources, respectively. Further restricting the comparison to sources in the comparison sample with X-ray luminosities indicative of AGN activity, log (erg s-1), increases the selection fractions to 52% and 47%, respectively. For comparison, our strict power-law criteria recover of the X-ray luminous AGN in the comparison sample.
Power-law galaxies, a subsample of both the Lacy et al. and Stern et al. criteria, tend to preferentially lie at both high luminosity and high redshift. The same is true for the full color-selected samples, as shown in Figures 14 and 15, in which we plot only sources with spectroscopic redshifts and only the Lacy et al. color criteria. Including photometric redshifts does not change the results, and the same trends are seen for both the Lacy et al. and Stern et al. selection techniques.
At low redshift, only a small fraction of the comparison sample lies inside the Lacy et al. selection region (see Figure 14). At redshifts of , however, the vertical branch in color-space populated by low-redshift () aromatic-dominated sources (Sajina, Lacy, & Scott 2005) disappears, and at , all of the remaining IRAC sources meet the Lacy et al. criteria. Similarly, at log (erg s-1), only a small fraction of the sources in the comparison sample fall in the selection region (see Figure 15). In contrast, 72% of the X-ray sources in the comparison sample with log (erg s-1) and 100% of those sources with log (erg s-1) meet the Lacy et al. selection criteria. These high luminosity sources lie in the same region of color space as the power-law selected AGN (see Figure 12), although as is apparent from Figure 6, the Lacy et al. criteria (and the Stern et al. criteria) select a more complete sample of AGN with high X-ray luminosities than does the power-law selection. As is also shown in Figure 6, however, the X-ray luminosities of the color-selected sources extend below the traditional AGN limit of log (erg s-1), suggesting either heavy obscuration of highly-luminous AGN, or possible contamination by star-forming galaxies.
6.2.2 AGN Reliability
Of the sources selected via the power-law criteria, 55% were detected in the X-ray catalog of Alexander et al. (2003). The X-ray detection fractions of the sources selected via the Lacy et al. and Stern et al. criteria are lower: 25% and 38%, respectively. We searched for faint X-ray emission from the color-selected sources using the method described in §5.1; 65% of the Lacy et al. sources and 70% of the Stern et al. sources show evidence for X-ray emission (at the 2.5 level or higher), compared to 85% for the power-law galaxies. Do these techniques select a larger fraction of AGN not detected in X-rays, or do they suffer from greater contamination from star-forming galaxies?
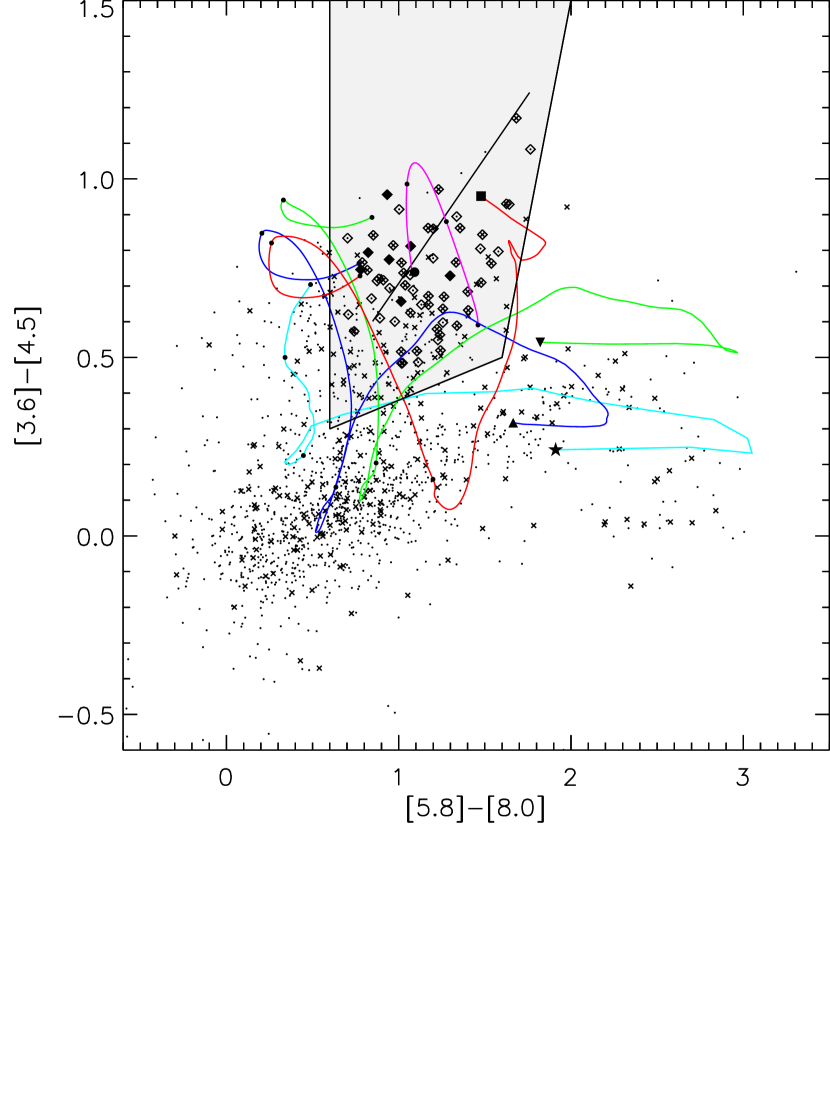


A spectroscopic follow-up of candidate obscured AGN selected via the Lacy et al. criteria reveals that most () have spectral signatures typical of type-2 AGN (Lacy et al. 2005). However, the 12 candidate sources for which spectra were taken were chosen to have 8 µm flux densities mJy, and all lie at . As shown in Figure 12, the SEDs of the star-formation dominated ULIRG Arp 220 enters the Lacy et al. selection region at low ( to 0.67) and moderately high () redshift, as does that of IRAS 17208-0014 ( to 0.89 and ). The Dale & Helou (2002) star-forming template shows similar behavior, falling just inside the AGN selection region at low redshift ( to 0.58) and re-entering the region at high redshift (), suggesting that pure color-selection is capable of selecting both normal and highly-luminous star-forming galaxies at low and moderately high redshift. The simulations of Sajina et al. (2005) also show a significant number of aromatic feature-dominated sources near the outskirts of the Lacy et al. AGN selection region, and suggest that while the IRAC colors provide an effective means of identifying obscured AGN up to , such criteria are less effective at higher redshift, where the IRAC bands sample the NIR light from the galaxy (see also Alonso-Herrero et al. 2006). As expected, the AGN template (Elvis et al. 1994) lies in the same region of color space as the power-law galaxies, as does the low-redshift template of Mrk 273, a ULIRG with AGN signatures in the optical and NIR (Veilleux et al. 1999; Risaliti et al. 2006). Mrk 273 meets the Lacy et al. criteria at all redshifts except to 1.40.
The Stern et al. criteria also suffer from potential contamination from cold ULIRGs and star-forming galaxies, although the star-forming templates tend to fall in the selection region for smaller redshift intervals than in the Lacy et al. color-space. The star-forming template of Dale & Helou (2002) lies along the edge of the selection region at low redshift ( to 0.56) but it does not re-enter the selection region at the redshifts plotted here (). Arp 220 falls in the selection region twice (from redshifts of to 0.55 and to 1.44), as does IRAS 17208-0014 ( to 0.58 and to 1.60). Once again, both the AGN template (Elvis et al. 1994) and the low-redshift Mrk 273 template have colors similar to those of the power-law galaxies. The Mrk 273 template meets the Stern et al. criteria in three redshift intervals ( to 0.06, to 0.39, and to 1.59), whereas the AGN template falls in the selection region at all redshifts plotted here.
The Mrk 273, Arp 220, and IRAS 17208-0014 templates all lie near regions of color-space populated by power-law galaxies. The template of Mrk 273, a ULIRG with AGN signatures, meets our power-law criteria (, , monotonically rising) at redshifts of to 0.08, to 0.39 and at (assuming 10% flux errors in the 3.6 and 4.5 µm bands, and 15% flux errors in the 5.8 and 8.0 µm bands). The Arp 220 template, however, does not meet these criteria at redshifts less than , as expected. With the exception of a narrow redshift window of to 0.53 in which IRAS 17208-0014 appears as a power-law galaxy, the same is true for this star-forming template, which meets our criteria at . Only five of the sources in our sample with redshift estimates lie at ; none of these lie between and 0.53, and all are detected in the X-ray. We therefore expect little contamination from low-redshift ULIRGS, although the presence of such sources cannot be ruled out. As for contamination from high redshift star-forming galaxies, a ULIRG with an SED like that of Arp 220 that lies at must have a total infrared luminosity (TIR, 8-1000 µm) of log (L☉) to have a 24 µm flux density Jy (see Figure 16). The fraction of ULIRGS dominated by AGN increases with infrared luminosity, with 50% of ULIRGs showing Seyfert-like properties at log (L☉) (Veilleux et al. 1999). It is therefore unlikely that HyperLIRGS with log (L☉) have NIR luminosities dominated by star-formation. As such, we also expect little contamination in the power-law sample from high-redshift star-forming galaxies, so long as the power-law objects are also detected at 24 µm (as is the case both for the sample of Alonso-Herrero et al. (2006) and for the majority of our sample).
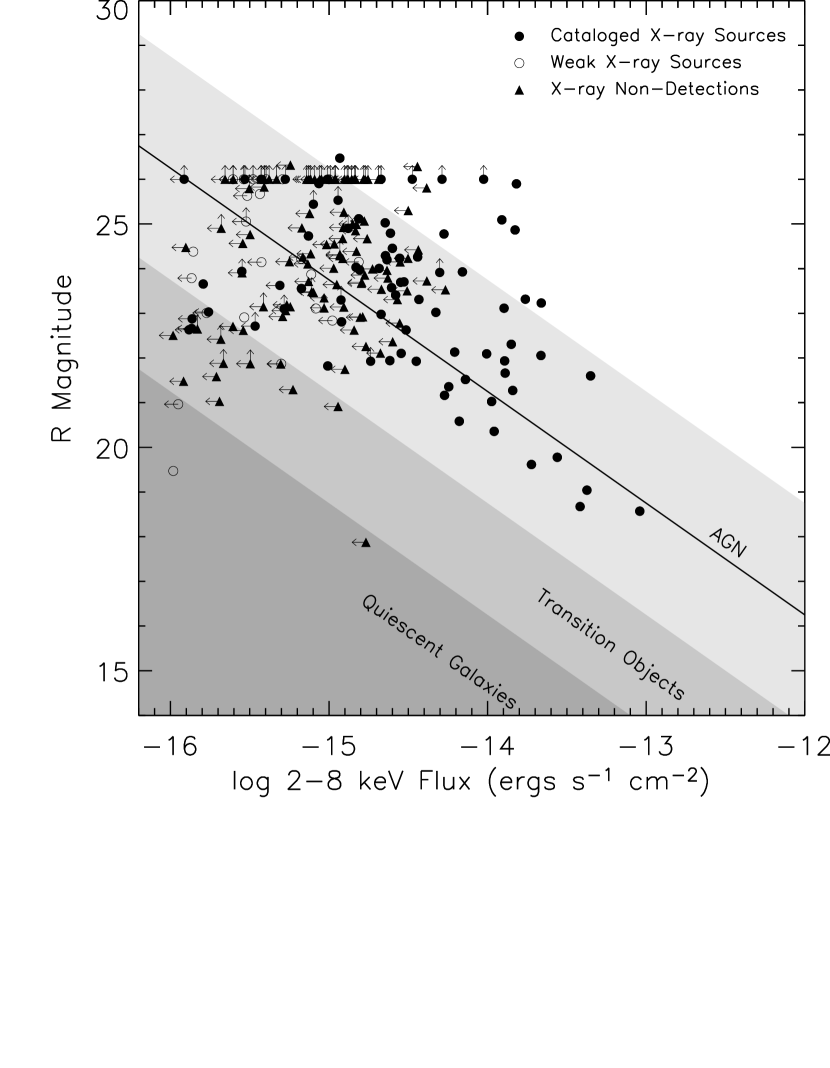
As a final check, we plot in Figures 12 and 13 the seven power-law galaxies in our sample that are not detected in the X-ray at the 2.5 level. With one or two exceptions, they are well removed from the colors of Arp 220 and IRAS 17208-0014 for any value of (particularly in Figure 12). We therefore believe they contain AGN that are heavily obscured in the X-ray. This test illustrates the utility of the color-color plots in identifying regions of color space within the color selection regions and near the power-law locus in which contamination by star-forming galaxies is possible. The current templates suggest that pure color selection is likely to select star-forming galaxies and ULIRGs at both low and high redshifts. Several other lines of evidence also point towards a higher fraction of star-forming galaxies in the color-selected samples. While % of the power-law galaxies are detected at 24 µm, the 24 µm detection fractions of the Lacy et al. and Stern et al. samples are lower: 72% and 83%, respectively. In addition, while 88% of the radio-detected power-law galaxies with redshift estimates have radio luminosities of W Hz-1, the value typical of AGN-powered radio galaxies in GOODS-N (Morrison et al. 2006), only 49% and 54% of the Lacy et al. and Stern et al. radio sources (with redshift estimates) have luminosities that exceed this value. Finally, we plot in Figure 17 the position of the color-selected sources on the X-ray to optical diagnostic diagram. While the current detections and upper limits place only two power-law galaxies within the transition region and none near the region populated by quiescent galaxies (see Figure 2), 15% and 10% of the Lacy et al. and Stern et al. sources fall in these regions, and more have upper limits that place them just outside.
6.2.3 SEDs of color-selected sources
How do the MIR SEDs of the Lacy et al. and Stern et al. selected sources compare to those of the power-law galaxies? Of the Lacy et al. sources, 20% can be fit by red, AGN-dominated power-laws () and 30% can be fit by blue, stellar-dominated power-laws (). A higher fraction of the Stern et al. sources have good power-law fits: 37% are red power-laws and 34% are blue power-laws555We note we have applied only a power-law fit probability to derive the above numbers, and have excluded the other criteria discussed in §3 (i.e. no turnovers in flux density, no apparent stellar bump). The number of galaxies identified with red power-laws using just these two criteria is therefore 79, not 62.. The comparison sample (see Section 4) shows the behavior of objects selected without regard to the presence of an AGN; 6% and 39% of the full comparison sample can be fit by red and blue power-laws, as can 16% and 35% of the cataloged X-ray sources in the comparison sample.
7. Obscuration
In the local universe, Seyfert 2’s are four times more numerous than Seyfert 1’s (Maiolino & Rieke 1995) and at least half of all Seyfert 2’s are Compton-thick (Maiolino et al. 1998; Risaliti et al. 1999). In the more distant universe, X-ray background and luminosity function synthesis models predict global obscured (log (cm-2)) ratios of 3:1 to 4:1 (Comastri et al. 2001; Ueda et al. 2003; Gilli 2004; Treister et al. 2005; Tozzi et al. 2006), significantly higher than the observed type 2 to type 1 ratio of spectroscopically identified X-ray sources in the deep fields, 2:1 (e.g., Barger et al. 2003; Szokoly et al. 2004; Treister et al. 2005), but slightly lower than the 6:1 ratio observed for high-redshift X-ray–detected SCUBA galaxies (Alexander et al. 2005).
In the following discussion, we estimate the X-ray column densities of the power-law sample and compare the resulting obscured fraction to predictions from the XRB. If we consider only those power-law galaxies detected in the X-ray, we find an obscured ratio of 2:1. Including the power-law galaxies both weakly- and non-detected in the X-ray results in an obscured ratio of . We use a Monte Carlo code to measure the dispersion in this ratio, and investigate the change in the obscured fraction with X-ray luminosity and redshift. By comparing the space density of obscured AGN in the power-law sample to the predictions of Treister et al. (2006), we estimate that at most 20-30% of obscured, MIR-detected AGN have SEDs that meet our robust power-law criteria. We also discuss the effect of large obscuring columns on the NIR/MIR continuum, and show that while heavily obscured AGN can have NIR emission dominated by the AGN, the power-law criteria may be biased against the most heavily obscured (Compton-thick) AGN.
7.1. Column Densities
We estimated the intrinsic column density, , of each X-ray–detected power-law and color-selected galaxy by comparing the observed hard to soft-band X-ray flux ratio to that expected for a typical AGN at a given redshift, after correcting the flux ratios for a Galactic column density of cm-2. When no redshift was available, we estimated the column densities at redshifts of and , the approximate limits of the power-law sample. We assumed an intrinsic photon index of (Tozzi et al. 2006), and did not include a Compton reflection component, which tends to decrease the necessary column by % (see Donley et al. 2005). The estimated column densities of the power-law galaxies are given in Tables 2 and 3 and plotted in Figure 18.
7.1.1 Obscured fraction
A comparison between the X-ray-cataloged and weakly-detected power-law galaxies is complicated, because only one of the latter has both a hard and soft-band detection. We can therefore place only upper limits on the columns of 6 of the weakly-detected AGN, lower limits on two, and no limit on the remaining one. However, all weakly-detected power-law galaxies for which we can estimate are consistent with being obscured ( cm-2), but not Compton-thick ( cm-2). Of the X-ray–detected power-law galaxies, 68% are obscured, in agreement with obscured fractions found by Ueda et al. (2003) for AGN at similar redshifts. If we consider only those power-law galaxies in the X-ray catalog, we therefore derive an obscured to unobscured ratio of 2:1.
Several lines of evidence point towards high obscuration in the sources not detected in X-rays. First, the power-law selection criteria (§5.1.2) and high 24 µm detection fraction (§5.2) appear to be indicative of a population of intrinsically X-ray luminous sources (see Fig. 10), sources that, if unobscured, should be detectable out to high redshift (see Fig. 9). Secondly, the median optical–MIR SED of the sources not detected in X-rays falls below that of the weakly-detected sources at optical wavelengths, which in turn falls below that of the strongly-detected sources, suggesting a continuously increasing optical obscuration for a given 1.25 µm flux density (see Fig. 11). Adding the 10 weakly-detected power-law galaxies, all of which are likely to be obscured (see Table 2), we calculate an obscured fraction of 75%. If we futher include the power-law galaxies not detected in X-rays, assuming that all are obscured, the maximum obscured fraction of power-law galaxies rises to 82% (4:1-5:1). (Considering only those power-law galaxies with gives an obscured fraction of 81%). This upper limit on the obscured fraction is consistent with the fraction of NLAGN SEDs found by Alonso-Herrero et al. (2006) for power-law sources in the CDF-S (%).
To place a lower limit on the obscured fraction, we consider two additional scenarios. If we assume that all of the X-ray non-detected power-law galaxies are obscured, as before, but assume instead that the 6 weakly-detected power-law galaxies with upper limits on their column densities are unobscured, the obscured fraction drops to 71%. If we further consider only those power-law galaxies with column density estimates (i.e. those sources strongly or weakly detected in the X-ray) and assume again that all of the weakly-detected power-law galaxies with upper limits on their column densities are unobscured, the minimum obscured fraction drops to . This lower limit, however, falls below the obscured fraction of the X-ray–detected power-law galaxies (68%). As it is unlikely that the power-law galaxies not detected in the X-ray are significantly less obscured than those detected in the X-ray, the obscured fraction of the X-ray–detected power-law galaxies can be taken as the lower limit on the obscured fraction.
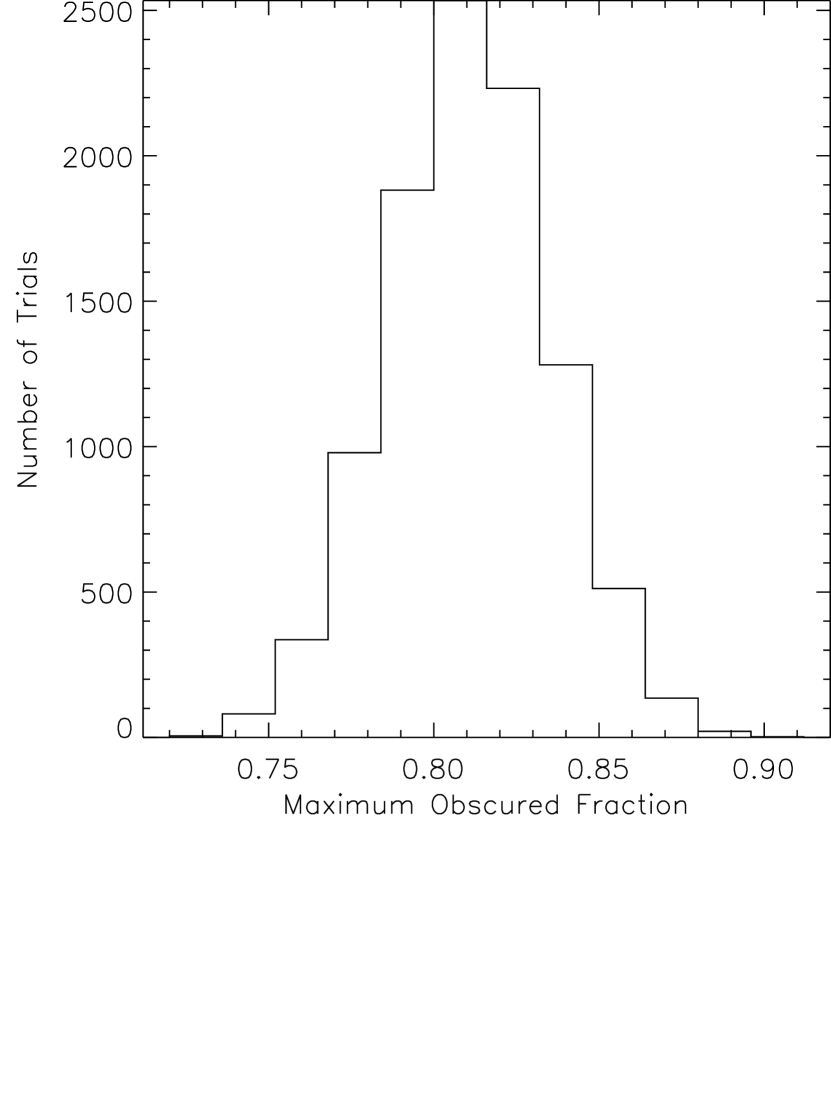
To investigate the dispersion in the observed ratio of obscured to unobscured AGN, we ran a Monte Carlo simulation in which we varied both the assumed intrinsic photon index, , and the photometric redshifts, and then recalculated the column densities of the power-law galaxies. The intrinsic photon index was drawn from the distribution of Tozzi et al (2006), as measured for the brightest 30 sources in their sample: . We allowed the photometric redshifts of the power-law galaxies to vary about their mean by (see §4). For the simulation, we assigned the 6 cataloged and weakly-detected sources with hard-to-soft flux ratios but no redshift estimate the median redshift of our sample, . The results are shown in Figure 19. The maximum obscured fraction varies from % to % (3:1-6:1), with a mean of (4:1).
7.1.2 Redshift and luminosity dependence of obscured fraction

We plot in the right panel of Figure 19 the obscured fraction as a function of redshift and observed X-ray luminosity. Solid and dotted lines represent power-law galaxies with low ( (erg s-1)) and high ( (erg s-1)) absorption-corrected X-ray luminosities, and thin and thick lines represent power-law galaxies with low () and high () redshifts, respectively. We include all X-ray sources with redshifts for which column densities are available, and exclude those sources with only upper limits on the X-ray luminosity. In addition to having a relatively high obscured to unobscured ratio, power-law galaxies appear to be more heavily obscured at low X-ray luminosities and at high redshifts. The upper limit on the obscured fraction varies from 0.5, for low-redshift, high-luminosity power-law galaxies, to 1, for high-redshift, low-luminosity sources. As we can plot only those power-law galaxies detected in the X-ray for which redshift estimates are available (37/63), systematic effects are likely to be present (e.g. Treister et al. 2005).
The trends we find are consistent with previous results. A number of authors have predicted an increase in the obscured fraction of AGN with increasing redshift (e.g., Gilli et al. 2001, 2003; La Franca et al. 2005; Ballantyne et al. 2006; Tozzi et al. 2006), although a constant obscured fraction also appears to be consistent with the current data (Ueda et al. 2003; Gilli 2004; Treister et al. 2004; Treister & Urry 2005). Akylas et al. (2006) suggest that the observed increase in the obscured fraction with redshift may be due to statistical fluctuations in the small number of counts in the low energy bands, which can cause the column densities of high redshift sources to be overestimated. Stronger evidence exists for a decrease in the obscured fraction with increasing X-ray luminosity (Ueda et al. 2003; Steffen et al. 2003; Hasinger 2004; Szokoly et al. 2004; Barger et al. 2005; Treister et al. 2005; Ballantyne et al. 2006), as expected from the receding torus model (Lawrence 1991). For instance, Szoloky et al. (2004) find X-ray Type 2 fractions of 75%, 44%, and 33% for AGN with X-ray luminosities of log (erg s-1), respectively, and Ballantyne et al. (2006) find that the model that simultaneously best describes local AGN data, the CXRB spectrum, and X-ray number counts requires an obscured ratio of 4:1 for low luminosity AGN and 1:1 to 2:1 for AGN with log (erg s-1).

7.1.3 Obscured fraction of color-selected samples
If we assume that all of the color-selected sources are AGN, and that all X-ray–non-detected sources are obscured, the Lacy et al. and Stern et al. selection criteria give upper limits on the obscured fraction of 92% (12:1) and 88% (7:1). As discussed in §6.2.2, however, it is likely that these samples contain star-forming galaxies as well as AGN; these estimates of the obscured fractions are therefore almost certainly high. By comparing the numbers of IR color-selected and optically-selected AGN, Stern et al. (2004) estimated an obscured AGN fraction of 76%, similar to that found for the power-law galaxies, although Richards et al. (2006) use a different infrared-to-optical flux ratio to revise this estimate to %. Lacy et al. (2004) similarly found an obscured ratio of 46% for the brightest members of their sample. It is important to note, however, that both the color- and power-law criteria select luminous AGN whose NIR/MIR emission is dominated by the central engine. Low-luminosity and heavily-obscured AGN whose NIR/MIR emission is dominated by the host galaxy will tend to fall outside of the color-selection and power-law regions, increasing the total obscured fraction of AGN.
7.2. Space Densities of Obscured AGN
If we assume that all of the power-law galaxies not detected in X-rays are obscured, the power-law sample contains at most 51 obscured AGN and at least 11 unobscured AGN (assuming that CDFN 50281, with a column density of cm-2 is unobscured). How do these numbers compare to the predicted space densities of Type 1 and Type 2 AGN?
Treister et al. (2006, private comm.) predict 199 AGN in a 350 arcmin2 area (the area of our survey) down to a 24 µm limiting flux density of Jy, of which should be detected in the hard X-ray band and of which are obscured (Type II). For comparison, the X-ray catalog of Alexander et al. (2003) contains 147-149 hard X-ray sources that meet our exposure cut (and therefore lie in the survey area) and which have Jy and AGN-like X-ray luminosities of log (ergs s-1). At a flux density of 80 Jy, the predicted number counts (for X-ray detected AGN) therefore lie within a factor of of the observed values.
As discussed in §5.2, all but 5 of the power-law galaxies have 24 µm counterparts and all but one of the MIPS-detected sources have a 24 µm flux density Jy. Of the 5 sources without 24 µm counterparts, however, only one source is a clear non-detection. The power-law sample therefore contains 56-60 galaxies with 24 µm fluxes Jy. Based on the Treister et al. (2006) predictions, these sources should account for of the MIR-detected AGN (or if we boost the Treister et al. counts by a factor of 1.4). Likewise, the 45-49 obscured power-law galaxies with 24 µm fluxes Jy should account for at most () of the obscured, Type II, MIR-detected AGN.
Our results therefore suggest that at most % of the MIPS-detected AGN and MIPS-detected obscured AGN have high power-law IRAC continua; the remainder could have SEDs dominated by or strongly affected by the host galaxy, red power-law SEDs that fall below our IRAC detection limit, or have been rejected due to noise that caused them to fail our relatively stringent signal-to-noise criteria. It is not surprising that we find a fairly small portion of power-law AGN, as our selection criteria require the AGN to be both of high luminosity and energetically dominant over the other source components in the near- to mid-IR. Franceschini et al. (2005) find that of a sample of Chandra-detected AGN in the SWIRE survey, only 62% have optical-IR SEDs typical of Type 1 or Type 2 AGN, and 40-60% of X-ray–selected AGN are known to be optically-dull (Hornschemeier et al. 2001; Barger et al. 2001; Giacconi et al. 2001). The fraction of AGN with optical–IR SEDs dominated by star-formation is likely to be even higher for heavily obscured AGN samples, such as that identified here. Polletta et al. (2006) select obscured AGN candidates on the basis of red non-stellar SEDs, similar to the power-law criterion used here; only 40% of their obscured AGN candidates show AGN signatures in the optical/NIR SEDs.
7.3. Effect of Reddening on Obscured AGN
Is it reasonable to assume that heavily obscured AGN at high redshift could have NIR/MIR SEDs still dominated by the central engine? Observations of QSOs indicate that AGN can be up to 2–3 magnitudes brighter than their host galaxies in the NIR (e.g. McLeod & Rieke 1994; Percival et al. 2001; Marble et al. 2003), although the contribution of the non-stellar continuum varies from source to source and as a function of wavelength. The total H-band contribution of luminous AGN, for example, ranges from 35 to 90% (McLeod & Rieke 1994), and while the non-stellar continuum of NGC 1068 accounts for 80% of the flux at 2.3 µm in the inner , the contribution drops to 30% at 1.6 µm (Origlia et al. 1993).
In the Milky Way, a column density of log (cm-2) corresponds to an of mag (Bohlin, Savage, & Drake 1978). The to ratio of AGN, however, appears to be an order of magnitude lower than that of the Milky Way (e.g. Maccacaro, Perola, & Elvis 1982; Reichert et al. 1985; Granato et al. 1997; Maiolino et al. 2001a), due either to a higher gas-to-dust ratio, or to the formation of large grains in the dense AGN environment (Maiolino et al. 2001a, 2001b). Following Martínez-Sansigre (2006), we therefore adopt an AGN to conversion of , for which column densities of log (cm-2) correspond to mag, respectively.
Assuming the IR extinction law of Rieke & Lebofsky (1985), we estimate the observed IRAC extinctions for an obscured AGN at , where IRAC samples the µm rest-frame emission. At a column density of log (cm-2), the extinctions at the center of the IRAC channels are negligible (0.02-0.06 mag), but they rise with column density to 0.2-0.6 mag for log (cm-2) and 1.8-6.2 mag for log (cm-2). It is therefore reasonable to assume that luminous obscured AGN could dominate the emission of their host galaxies at all but the highest column densities.
If the interstellar extinction law is applicable to AGN, differential extinction across the IRAC bands will redden the observed spectral slope, potentially increasing the number of heavily obscured luminous AGN in the power-law sample. At , a column density of log (cm-2) has only a minor effect on the measured slope: an observed spectral index of corresponds to an unreddened intrinsic slope of . At higher column densities of log (cm-2) and log (cm-2), however, the best-fit intrinsic slopes at increase to and . The unrealistic predicted intrinsic slope of the high-redshift Compton-thick model suggests that highly obscured AGN at high redshift are likely to have steep observed spectral slopes, if their IR and X-ray emission are subject to the same obscuring material. For example, the spectral slope of CDFN 44836, , could be caused by the extinction of an source by a column density of log (cm-2) at . At such high column densities, however, the de-reddened source begins to steepen at the bluest bands, no longer resembling a power-law source.
While the above results therefore suggest that power-law selection may be biased against Compton-thick AGN, there exist a population of AGN whose X-rays are more heavily obscured than their optical/NIR emission (e.g. Akiyama et al. 2003; Brusa et al. 2003; Page et al. 2003; Wilkes et al. 2005). For instance, 10% of the BLAGN sample of Perola et al. (2004) have X-ray columns of log (cm-2). Shi et al. (2006) also find several Compton-thick AGN that do not follow an observed correlation between X-ray column density and the strength of the silicate emission or absorption feature. Instead, their silicate absorption is weaker than expected, suggesting a Compton-thick absorber that obscures the X-ray emission, but not the IR emission. These outliers could also be explained, however, by a Compton-thick absorber that obscures the mid-IR so strongly that the output in this range is dominated by star formation in the host galaxies.
8. Conclusions
We define a sample of 62 power-law galaxies in the CDF-N. Sources were required to be detected to in each of the IRAC bands, have IRAC slopes of (where ), and to lie in regions with both deep X-ray ( Ms) and radio coverage. We studied the multiwavelength properties of the power-law galaxies and compared the power-law selection technique to other MIR-based AGN selection criteria. We then measured the intrinsic obscuring column densities of the power-law galaxies to estimate the obscured fraction of the sample, which should be less affected by obscuration than optical and/or X-ray selected samples. The main results of this paper are as follows:
-
•
Power-law selection requires the AGN to be energetically-dominant in the near/mid infrared. On average, AGN with X-ray luminosities of log (erg s-1) have SEDs dominated by or strongly affected by the stellar continuum. Therefore, power-law galaxies tend to have high X-ray luminosities, and make up a significant fraction of the X-ray luminous AGN population.
-
•
Power-law galaxies lie at significantly higher redshifts than the typical IRAC– or X-ray–detected source, primarily due to their high luminosities. While the power-law sample defined here accounts for only of the X-ray and MIR-detected AGN in the comparison sample, approximately 50% of the high-redshift X-ray sample are power-law galaxies.
-
•
45% of the power-law galaxies are not detected in the X-ray catalog of Alexander et al. (2003) at exposures of Ms. A search for faint emission reveals that 15% remain undetected at the detection level. X-ray detection is not a strong function of redshift, X-ray exposure time (at Ms), power-law slope, or power-law fit probability.
-
•
Almost all (93-98%) of the IRAC-selected power-law galaxies are detected at 24 µm. The 24 µm detection fraction of AGN in the comparison sample increases with X-ray luminosity. Because we require all power-law galaxies to be detected in each of the four IRAC bands, the 24 µm detection fraction is almost certainly higher than would be expected for an unbiased sample of AGN. Nevertheless, comparison with a sample suffering from the same bias (the comparison sample) shows that the high detection fraction is representative of an intrinsically X-ray luminous AGN population.
-
•
30% of the power-law galaxies have radio counterparts from the Richards et al. (2000) VLA survey of the CDF-N. Only two of the 18 radio-detected sources (11%) have radio emission in excess of that predicted by the radio-infrared correlation, suggesting an overall radio-loud fraction of only 3%. In comparison, almost all of the radio-excess AGN of Donley et al. (2005) have optical/MIR SEDs dominated by the stellar bump. Further exploration of a possible systematic difference in the radio properties of the two samples would be interesting. While there is very little overlap between the radio-excess and power-law samples, both have similarly low X-ray detection fractions, suggesting that this may be a common feature of AGN selected independently of their X-ray and optical properties, regardless of redshift or luminosity.
-
•
The optical–MIR SEDs of the power-law galaxies are flatter than the median radio-quiet SED of Elvis et al. (1994). Sources not detected in X-rays have SEDs that drop off more rapidly in the optical than those of the power-law galaxies detected in X-rays, as discussed in Alonso-Herrero et al. (2006), presumably due to increasing optical obscuration. Weakly-detected power-law galaxies have intermediate optical SEDs.
-
•
At least half of the power-law galaxies detected in the X-ray catalog have compact optical counterparts, suggesting that the optical light is dominated by the AGN, as expected. Only 2 non– or weakly-detected sources have compact optical counterparts. 15% of the power-law galaxies in the GOODS field do not have optical counterparts brighter than the GOODS limiting magnitudes.
-
•
Power-law galaxies comprise a subset of the MIR sources selected via color criteria (e.g. Lacy et al. 2004; Stern et al. 2005). While color-selected AGN samples include a higher fraction of high-luminosity AGN than does the power-law selected sample, the color criteria select larger fractions of sources not detected in X-rays, due at least in part to a higher degree of contamination by star-forming galaxies. Combining color-selection with additional tests designed to rule out emission from star-forming galaxies is likely to produce more reliable samples of AGN.
-
•
68% (2:1) of the X-ray–detected power-law galaxies are obscured (log (cm-2)), and all of the weakly-detected power-law galaxies are consistent with being obscured, but not Compton-thick (log (cm-2)). If we assume that all of the X-ray non-detected power-law galaxies are obscured, we derive a maximum obscured fraction of 81% (4:1). Power-law galaxies also appear to be more heavily obscured at low X-ray luminosities and at high redshift.
-
•
Power-law galaxies detected to high in the IRAC bands account for % of both the MIR-detected AGN and the MIR-detected obscured AGN predicted by the X-ray luminosity function synthesis models of Treister et al. (2006) down to 24 µm flux densities of Jy. This percentage is best interpreted as a lower limit since our conservative selection criteria may exclude some power-law objects.
-
•
At all but the highest column densities, NIR/MIR extinction should have only a minor effect on the power-law emission of luminous AGN. IRAC power-law selection, however, is likely to be biased against high-redshift Compton-thick AGN if the covering fractions of the X-ray and NIR-emitting regions are the same.

References
- Akiyama et al. (2003) Akiyama, M., Ueda, Y., Ohta, K., Takahashi, T., & Yamada, T. 2003, ApJS, 148, 275
- (2) Akylas, A., Georgantopoulos, I., Georgakakis, A., Kitsionas, S., & Hatziminaoglou, E., 2006, A&A, in press
- Alexander et al. (2002) Alexander, D. M., Aussel, H., Bauer, F. E., Brandt, W. N., Hornschemeier, A. E., Vignali, C., Garmire, G. P., & Schneider, D. P. 2002, ApJ, 568, L85
- Alexander et al. (2003) Alexander, D. M., et al. 2003, AJ, 126, 539
- Alexander et al. (2005) Alexander, D. M., Smail, I., Bauer, F. E., Chapman, S. C., Blain, A. W., Brandt, W. N., & Ivison, R. J. 2005, Nature, 434, 738
- Alonso-Herrero et al. (2004) Alonso-Herrero, A., et al. 2004, ApJS, 154, 155
- Alonso-Herrero et al. (2006) Alonso-Herrero, A., et al. 2006, ApJ, 640, 167
- Appleton et al. (2004) Appleton, P. N., et al. 2004, ApJS, 154, 147
- Armus et al. (2006) Armus, L. et al. 2006, submitted to ApJ, and Armus, private communication
- Ballantyne et al. (2006) Ballantyne, D. R., Everett, J. E., & Murray, N. 2006, ApJ, 639, 740
- Barger et al. (2001) Barger, A. J., Cowie, L. L., Bautz, M. W., Brandt, W. N., Garmire, G. P., Hornschemeier, A. E., Ivison, R. J., & Owen, F. N. 2001, AJ, 122, 2177
- Barger et al. (2002) Barger, A. J., Cowie, L. L., Brandt, W. N., Capak, P., Garmire, G. P., Hornschemeier, A. E., Steffen, A. T., & Wehner, E. H. 2002, AJ, 124, 1839
- Barger et al. (2003) Barger, A. J., et al. 2003, AJ, 126, 632
- Barger et al. (2005) Barger, A. J., Cowie, L. L., Mushotzky, R. F., Yang, Y., Wang, W.-H., Steffen, A. T., & Capak, P. 2005, AJ, 129, 578
- Barmby et al. (2006) Barmby, P., et al. 2006, ApJ, 642, 126
- Bauer et al. (2004) Bauer, F. E., Alexander, D. M., Brandt, W. N., Schneider, D. P., Treister, E., Hornschemeier, A. E., & Garmire, G. P. 2004, AJ, 128, 2048
- Bell (2003) Bell, E. F. 2003, ApJ, 586, 794
- Bertin & Arnouts (1996) Bertin, E., & Arnouts, S. 1996, A&AS, 117, 393
- Bevington & Robinson (2003) Bevington, P. R., & Robinson, D. K. 2003, Data reduction and error analysis for the physical sciences, 3rd ed., by Philip R. Bevington, and Keith D. Robinson. Boston, MA: McGraw-Hill, ISBN 0-07-247227-8, 2003.
- Bohlin et al. (1978) Bohlin, R. C., Savage, B. D., & Drake, J. F. 1978, ApJ, 224, 132
- Brand et al. (2006) Brand, K., et al. 2006, ApJ, 644, 143
- Brusa et al. (2003) Brusa, M., et al. 2003, A&A, 409, 65
- Capak et al. (2004) Capak, P., et al. 2004, AJ, 127, 180
- Chapman et al. (2005) Chapman, S. C., Blain, A. W., Smail, I., & Ivison, R. J. 2005, ApJ, 622, 772
- Comastri et al. (2001) Comastri, A., Fiore, F., Vignali, C., Matt, G., Perola, G. C., & La Franca, F. 2001, MNRAS, 327, 781
- Condon et al. (2002) Condon, J. J., Cotton, W. D., & Broderick, J. J. 2002, AJ, 124, 675
- Cowie et al. (2004) Cowie, L. L., Barger, A. J., Hu, E. M., Capak, P., & Songaila, A. 2004, AJ, 127, 3137
- Dale & Helou (2002) Dale, D. A., & Helou, G. 2002, ApJ, 576, 159
- Dawson et al. (2003) Dawson, S., McCrady, N., Stern, D., Eckart, M. E., Spinrad, H., Liu, M. C., & Graham, J. R. 2003, AJ, 125, 1236
- Devriendt et al. (1999) Devriendt, J. E. G., Guiderdoni, B., & Sadat, R. 1999, A&A, 350, 381
- Donley et al. (2005) Donley, J. L., Rieke, G. H., Rigby, J. R., & Pérez-González, P. G. 2005, ApJ, 634, 169
- Duc, Mirabel, & Maza (1997) Duc, P.-A., Mirabel, I. F., and Maza, J. 1997, A&AS, 124, 533
- Elvis et al. (1994) Elvis, M., et al. 1994, ApJS, 95, 1
- Fazio et al. (2004) Fazio, G. G., et al. 2004, ApJS, 154, 10
- Farrah et al. (2003) Farrah, D., Alfonso, J., Efstathiou, A., Rowan-Robinson, M., Fox, M., & Clements, D. 2003, MNRAS, 343, 585
- Franceschini et al. (2005) Franceschini, A., et al. 2005, AJ, 129, 2074
- Freeman et al. (2002) Freeman, P. E., Kashyap, V., Rosner, R., & Lamb, D. Q. 2002, ApJS, 138, 185
- Frueh et al. (1996) Frueh, M. L., Corwin, H. G. Jr., de Vaucouleurs, G., & Buta, R. 1996, AJ, 111, 722
- Giacconi et al. (2001) Giacconi, R., et al. 2001, ApJ, 551, 624
- Giacconi et al. (2002) Giacconi, R., et al. 2002, ApJS, 139, 369
- Giavalisco et al. (2004) Giavalisco, M., et al. 2004, ApJ, 600, L93
- Gilli et al. (2001) Gilli, R., Salvati, M., & Hasinger, G. 2001, A&A, 366, 407
- Gilli et al. (2003) Gilli, R., et al. 2003, ApJ, 592, 721
- Gilli (2004) Gilli, R. 2004, Advances in Space Research, 34, 2470
- Goldader et al. (1995) Goldader, J. D., Joseph, R. D., Doyon, Rene, & Sanders, D. B. 1995, ApJ, 444, 97
- Gordon et al. (2004) Gordon, K. D., et al. 2004, Proc. SPIE, 5487, 177
- Gordon et al. (2005) Gordon, K. D., et al. 2005, PASP, 117, 503
- Granato et al. (1997) Granato, G. L., Danese, L., & Franceschini, A. 1997, ApJ, 486, 147
- Hasinger (2004) Hasinger, G. 2004, Nuclear Physics B Proceedings Supplements, 132, 86
- Hatziminaoglou et al. (2005) Hatziminaoglou, E., et al. 2005, AJ, 129, 1198
- Higdon et al. (2006) Higdon, S. J. U., Armus, L., Higdon, J. L., Soifer, B. T., & Spoon, H. W. W., 2006, ApJ, in press, astro-ph/0605359
- Hornschemeier et al. (2001) Hornschemeier, A. E., et al. 2001, ApJ, 554, 742
- Hornschemeier et al. (2003) Hornschemeier, A. E., et al. 2003, AJ, 126, 575
- Houck et al. (2005) Houck, J. R., et al. 2005, ApJ, 622, L105
- Huang et al. (2004) Huang, J.-S., et al. 2004, ApJS, 154, 44
- Imanishi (2006) Imanishi, M. 2006, AJ, 131, 2406
- Imanishi, Dudley, & Maloney (2006) Imanishi, M., Dudley, C. C., & Maloney, P. R. 2006, ApJ, 637, 114
- Ivezić et al. (2002) Ivezić, Ž., et al. 2002, AJ, 124, 2364
- Ivison et al. (2004) Ivison, R. J., et al. 2004, ApJS, 154, 124
- Johansson et al. (2004) Johansson, P. H., Väisänen, P., & Vaccari, M. 2004, A&A, 427, 795
- Kellermann et al. (1989) Kellermann, K. I., Sramek, R., Schmidt, M., Shaffer, D. B., & Green, R. 1989, AJ, 98, 1195
- Klaas et al. (1997) Klaas, U., Haas, M., Heinrichsen, I., & Schulz, B. 1997, å, 325, L21
- Koekemoer et al. (2004) Koekemoer, A. M., et al. 2004, ApJ, 600, L123
- (64) Kuraszkiewicz, J. et al. 2007, ApJ, submitted
- La Franca et al. (2005) La Franca, F., et al. 2005, ApJ, 635, 864
- Lacy et al. (2004) Lacy, M., et al. 2004, ApJS, 154, 166
- Lacy et al. (2005) Lacy, M., Canalizo, G., Rawlings, S., Sajina, A., Storrie-Lombardi, L., Armus, L., Marleau, F. R., & Muzzin, A. 2005, Memorie della Societa Astronomica Italiana, 76, 154
- Lawrence (1991) Lawrence, A. 1991, MNRAS, 252, 586
- Leipski et al. (2005) Leipski, C., et al. 2005, A&A, 440, L5
- Maccacaro et al. (1982) Maccacaro, T., Perola, G. C., & Elvis, M. 1982, ApJ, 257, 47
- Maccacaro et al. (1988) Maccacaro, T., Gioia, I. M., Wolter, A., Zamorani, G., & Stocke, J. T. 1988, ApJ, 326, 680
- Maiolino & Rieke (1995) Maiolino, R., & Rieke, G. H. 1995, ApJ, 454, 95
- Maiolino et al. (1998) Maiolino, R., Salvati, M., Bassani, L., Dadina, M., della Ceca, R., Matt, G., Risaliti, G., & Zamorani, G. 1998, A&A, 338, 781
- Maiolino et al. (2001) Maiolino, R., Marconi, A., Salvati, M., Risaliti, G., Severgnini, P., Oliva, E., La Franca, F., & Vanzi, L. 2001a, A&A, 365, 28
- Maiolino et al. (2001) Maiolino, R., Marconi, A., & Oliva, E. 2001b, A&A, 365, 37
- Marble et al. (2003) Marble, A. R., Hines, D. C., Schmidt, G. D., Smith, P. S., Surace, J. A., Armus, L., Cutri, R. M., & Nelson, B. O. 2003, ApJ, 590, 707
- Martínez-Sansigre et al. (2005) Martínez-Sansigre, A., Rawlings, S., Lacy, M., Fadda, D., Marleau, F. R., Simpson, C., Willott, C. J., & Jarvis, M. J. 2005, Nature, 436, 666
- Martínez-Sansigre et al. (2006) Martínez-Sansigre, A., Rawlings, S., Lacy, M., Fadda, D. , Jarvis, M. J., Marleau, F. R., Simpson, C., Willott, C. J. 2006, MNRAS, in press
- McLeod & Rieke (1994) McLeod, K. K., & Rieke, G. H. 1994, ApJ, 431, 137
- Morrison et al. (2006) Morrison, G., et al. 2006, ArXiv Astrophysics e-prints, arXiv:astro-ph/0603412
- Mushotzky et al. (2000) Mushotzky, R. F., Cowie, L. L., Barger, A. J., & Arnaud, K. A. 2000, Nature, 404, 459
- Neugebauer et al. (1979) Neugebauer, G., Oke, J. B., Becklin, E. E., & Matthews, K. 1979, ApJ, 230, 79
- Origlia et al. (1993) Origlia, L., Moorwood, A. F. M., & Oliva, E. 1993, A&A, 280, 536
- Page et al. (2003) Page, M. J., et al. 2003, Astronomische Nachrichten, 324, 101
- Papovich et al. (2004) Papovich, C., et al. 2004, ApJS, 154, 70
- Pearson (2005) Pearson, C. 2005, MNRAS, 358, 1417
- Percival et al. (2001) Percival, W. J., Miller, L., McLure, R. J., & Dunlop, J. S. 2001, MNRAS, 322, 843
- Pérez-González et al. (2005) Pérez-González, P. G., et al. 2005, ApJ, 630, 82
- Perola et al. (2004) Perola, G. C., et al. 2004, A&A, 421, 491
- Polletta et al. (2006) Polletta, M. d. C., et al. 2006, ApJ, 642, 673
- Ptak et al. (2003) Ptak, A., Heckman, T., Levenson, N. A., Weaver, K., & Strickland, D. 2003, ApJ, 592, 782
- Reichert et al. (1985) Reichert, G. A., Mushotzky, R. F., Holt, S. S., & Petre, R. 1985, ApJ, 296, 69
- Rieke (1978) Rieke, G. H. 1978, ApJ, 226, 550
- Rieke & Lebofsky (1981) Rieke, G. H., & Lebofsky, M. J. 1981, ApJ, 250, 87
- Rieke & Lebofsky (1985) Rieke, G. H., & Lebofsky, M. J. 1985, ApJ, 288, 618
- Rieke et al. (1985) Rieke, G. H., Cutri, R. M., Black, J. H., Kailey, W. F., McAlary, C. W., Lebofsky, M. J., & Elston, R. 1985, ApJ, 290, 116
- Richards (2000) Richards, E. A. 2000, ApJ, 533, 611
- Richards et al. (2006) Richards, G. T., et al. 2006, ArXiv Astrophysics e-prints, arXiv:astro-ph/0601558
- Rigby et al. (2004) Rigby, J. R., et al. 2004, ApJS, 154, 160
- Rigby et al. (2005) Rigby, J. R., Rieke, G. H., Pérez-González, P. G., Donley, J. L., Alonso-Herrero, A., Huang, J.-S., Barmby, P., & Fazio, G. G. 2005, ApJ, 627, 134
- Rigopolou et al. (1999) Rigopoulou, D., Spoon, H. W. W., Genzel, R., Lutz, D., Moorwood, A. F. M., & Tran, Q. D. 1999, AJ, 118, 2625
- Risaliti et al. (1999) Risaliti, G., Maiolino, R., & Salvati, M. 1999, ApJ, 522, 157
- Risaliti et al. (2006) Risaliti, G., et al. 2006, MNRAS, 365, 303
- Sajina et al. (2005) Sajina, A., Lacy, M., & Scott, D. 2005, ApJ, 621, 256
- Scoville et al. (2000) Scoville, N. Z., Evans, A. S., Thompson, R., Rieke, M., Hines, D. C., Low, F. J., Dinshaw, N., Surace, J. A., and Armus, L. 2000, AJ, 119, 991
- Shi et al. (2006) Shi. Y. et al. 2006, ApJ, submitted
- Silva et al. (1998) Silva, L., Granato, G. L., Bressan, A., & Danese, L. 1998, ApJ, 509, 103
- Spinoglio & Malkan (1989) Spinoglio, L., & Malkan, M. A. 1989, ApJ, 342, 83
- Steffen et al. (2003) Steffen, A. T., Barger, A. J., Cowie, L. L., Mushotzky, R. F., & Yang, Y. 2003, ApJ, 596, L23
- Stern et al. (2000) Stern, D., Djorgovski, S. G., Perley, R. A., de Carvalho, R. R., & Wall, J. V. 2000, AJ, 119, 1526
- Stern et al. (2005) Stern, D., et al. 2005, ApJ, 631, 163
- Strecker, Erickson, & Witteborn (1979) Strecker, D. W., Erickson, E. F., d Witteborn, F. C. 1979, ApJS, 41, 501
- Sturm et al. (2000) Stürm, E., Lutz, D., Tran, D., Feuchtgruber, H., Genzel, R., Kunze, D., Moorwood, A. F. M., & Thornley, M. D. 2000, A&A, 358, 481
- Surace, Sanders, & Evans (2000) Surace, J. A., Sanders, D. B., & Evans, A. E. 2000, ApJ, 529, 170
- Swinbank et al. (2004) Swinbank, A. M., Smail, I., Chapman, S. C., Blain, A. W., Ivison, R. J., & Keel, W. C. 2004, ApJ, 617, 64
- Szokoly et al. (2004) Szokoly, G. P., et al. 2004, ApJS, 155, 271
- Tozzi et al. (2006) Tozzi, P., et al. 2006, A&A, 451, 457
- Treister et al. (2004) Treister, E., et al. 2004, ApJ, 616, 123
- Treister et al. (2005) Treister, E., et al. 2005, ApJ, 621, 104
- Treister & Urry (2005) Treister, E., & Urry, C. M. 2005, ApJ, 630, 115
- Ueda et al. (2003) Ueda, Y., Akiyama, M., Ohta, K., & Miyaji, T. 2003, ApJ, 598, 886
- Veilleux et al. (1999) Veilleux, S., Kim, D.-C., & Sanders, D. B. 1999, ApJ, 522, 113
- Weedman et al. (2006) Weedman, D. W., Le Floc’h, E., Higdon, S. J. U., Higdon, J. L., & Houck, J. R. 2006, ApJ, 638, 613
- Wilkes et al. (2005) Wilkes, B. J., Pounds, K. A., Schmidt, G. D., Smith, P. S., Cutri, R. M., Ghosh, H., Nelson, B., & Hines, D. C. 2005, ApJ, 634, 183
- Wirth et al. (2004) Wirth, G. D., et al. 2004, AJ, 127, 3121
- Worsley et al. (2004) Worsley, M. A., Fabian, A. C., Barcons, X., Mateos, S., Hasinger, G., & Brunner, H. 2004, MNRAS, 352, L28
- Worsley et al. (2005) Worsley, M. A., et al. 2005, MNRAS, 357, 1281
- Worsley et al. (2006) Worsley, M. A., Fabian, A. C., Bauer, F. E., Alexander, D. M., Brandt, W. N., & Lehmer, B. D. 2006, MNRAS, 368, 1735
- Yan et al. (2004) Yan, L., et al. 2004, ApJS, 154, 60
- Yan et al. (2005) Yan, L., et al. 2005, ApJ, 628, 604
- Yun et al. (2001) Yun, M. S., Reddy, N. A., & Condon, J. J. 2001, ApJ, 554, 803
| ID | aaChi-squared probability (see §3) | bbIRAC spectra index; | 24 µm | 1.4 GHz | 0.5-8 keV | log Lxcc0.5-8 keV | X-ray | ddX-ray off-axis angle | ee = log (f/f) | |||
|---|---|---|---|---|---|---|---|---|---|---|---|---|
| Flux Density | Flux Density | X-ray Flux | (ergs s-1) | Exposure | () | |||||||
| (Jy) | (Jy) | (ergs s-1 cm-2) | (s) | |||||||||
| CDFN 11348 | 12 35 25.58 | 62 16 09.41 | 0.86 | -0.86 | 204.0 | 80.0 | 8.10E-16 | 9.59E+05 | 9.6 | 0.41 | ||
| CDFN 17315 | 12 35 29.37 | 62 12 56.53 | 0.22 | -1.94 | 2.41 | 251.9 | 135.0 | 7.02E-15 | 44.5 | 7.43E+05 | 8.9 | 0.27 |
| CDFN 11516 | 12 35 37.11 | 62 17 23.40 | 0.49 | -0.89 | 2.05 | 234.9 | 80.0 | 5.27E-15 | 44.2 | 9.00E+05 | 8.7 | 0.47 |
| CDFN 07514 | 12 35 38.08 | 62 19 40.56 | 0.86 | -0.79 | 2.97 0.40 | 157.2 | 80.0 | 2.00E-15 | 44.2 | 9.86E+05 | 9.7 | |
| CDFN 12939 | 12 35 38.52 | 62 16 42.91 | 0.69 | -1.15 | 0.71 | 1413.8 | 3550.0 | 2.23E-13 | 44.7 | 9.60E+05 | 8.3 | -0.40 |
| CDFN 14642 | 12 35 43.35 | 62 16 17.15 | 0.84 | -1.17 | 2.36 0.34 | 117.6 | 80.0 | 9.19E-16 | 43.6 | 1.25E+06 | 7.6 | |
| CDFN 08362 | 12 35 46.64 | 62 20 13.23 | 0.57 | -1.39 | 118.5 | 80.0 | 7.85E-16 | 9.66E+05 | 9.3 | 0.17 | ||
| CDFN 10934 | 12 35 48.89 | 62 19 04.46 | 0.26 | -1.58 | 115.4 | 80.0 | 4.92E-16 | 9.84E+05 | 8.4 | 0.16 | ||
| CDFN 16796 | 12 35 49.43 | 62 15 36.52 | 0.22 | -0.79 | 2.20 | 585.6 | 74.6 | 1.34E-15 | 43.7 | 1.58E+06 | 6.8 | 0.89 |
| CDFN 25218 | 12 35 50.36 | 62 10 41.70 | 0.11 | -2.04 | 108.5 | 80.0 | 4.21E-16 | 7.04E+05 | 7.2 | |||
| CDFN 20981 | 12 35 54.30 | 62 13 43.37 | 0.95 | -0.69 | 131.7 | 80.0 | 2.04E-16 | 1.74E+06 | 6.0 | 0.22 | ||
| CDFN 25248 | 12 36 06.37 | 62 12 32.41 | 0.81 | -0.60 | 2.89 0.39 | 139.2 | 80.0 | 9.64E-16 | 43.8 | 1.81E+06 | 4.8 | 0.24 |
| CDFN 33052 | 12 36 08.87 | 62 08 03.56 | 0.10 | -1.37 | 151.8 | 80.0 | 4.67E-16 | 5.43E+05 | 7.3 | 0.28 | ||
| CDFN 27463 | 12 36 11.95 | 62 11 47.18 | 0.77 | -0.53 | 2.92 0.39 | 180.3 | 80.0 | 1.23E-16 | 42.9 | 1.68E+06 | 4.5 | 0.35 |
| CDFN 31054 | 12 36 14.04 | 62 09 47.93 | 0.78 | -0.59 | 1.65 0.27 | 60.8 | 80.0 | 2.46E-16 | 42.6 | 1.79E+06 | 5.6 | -0.12 |
| CDFN 23661 | 12 36 22.98 | 62 15 26.28 | 0.16 | -1.40 | 2.59 | 454.5 | 80.0 | 1.88E-14 | 45.0 | 1.85E+06 | 3.0 | 0.75 |
| CDFN 39358 | 12 36 23.37 | 62 06 05.23 | 0.21 | -1.92 | 1.86 0.29 | 479.5 | 71.7 | 4.71E-16 | 43.0 | 5.42E+05 | 8.3 | 0.83 |
| CDFN 37928 | 12 36 29.21 | 62 07 37.61 | 0.91 | -0.59 | 1.35 0.23 | 161.6 | 80.0 | 2.15E-16 | 42.3 | 1.77E+06 | 6.6 | 0.31 |
| CDFN 37999 | 12 36 32.59 | 62 07 58.95 | 0.11 | -2.14 | 2.00 | 711.8 | 90.6 | 1.83E-15 | 43.7 | 1.78E+06 | 6.2 | 0.90 |
| CDFN 27641 | 12 36 35.60 | 62 14 23.51 | 0.86 | -1.82 | 2.02 | 1345.2 | 87.8 | 2.52E-15 | 43.8 | 1.92E+06 | 1.2 | 1.19 |
| CDFN 28773 | 12 36 36.66 | 62 13 46.46 | 0.63 | -0.74 | 0.96 | 459.6 | 80.0 | 1.01E-14 | 43.7 | 1.91E+06 | 1.1 | 0.76 |
| CDFN 14667 | 12 36 36.90 | 62 22 27.27 | 0.57 | -2.03 | 292.9 | 80.0 | 3.45E-15 | 1.06E+06 | 8.6 | 0.56 | ||
| CDFN 37334 | 12 36 37.08 | 62 08 51.90 | 0.32 | -0.90 | 1.71 0.27 | 301.7 | 71.1 | 1.19E-16 | 42.3 | 1.78E+06 | 5.2 | 0.63 |
| CDFN 44902 | 12 36 40.59 | 62 04 51.34 | 0.27 | -0.87 | 1.16 0.22 | 166.6 | 80.0 | 8.28E-16 | 42.8 | 6.96E+05 | 9.1 | 0.32 |
| CDFN 24409 | 12 36 42.22 | 62 17 10.89 | 0.65 | -0.80 | 2.72 | 91.7 | 80.0 | 3.35E-15 | 44.3 | 1.65E+06 | 3.2 | 0.06 |
| CDFN 11965 | 12 36 42.23 | 62 24 39.01 | 0.59 | -0.71 | 1.90 0.29 | 480.4 | 82.1 | 1.95E-15 | 43.7 | 9.62E+05 | 10.7 | 0.77 |
| CDFN 14360 | 12 36 47.27 | 62 23 49.06 | 0.29 | -1.28 | 216.0 | 80.0 | 7.05E-16 | 9.75E+05 | 9.9 | 0.43 | ||
| CDFN 18906 | 12 36 48.30 | 62 21 06.89 | 0.76 | -1.45 | 149.4 | 80.0 | 2.94E-16 | 1.68E+06 | 7.2 | 0.27 | ||
| CDFN 41981 | 12 36 49.66 | 62 07 37.84 | 0.50 | -2.30 | 1.54 0.25 | 1239.3 | 307.0 | 2.59E-14 | 44.6 | 1.74E+06 | 6.3 | 0.61 |
| CDFN 49937 | 12 36 58.76 | 62 04 01.80 | 0.12 | -1.17 | 0.29 | 138.7 | 80.0 | 9.75E-15 | 42.4 | 7.33E+05 | 10.1 | 0.24 |
| CDFN 19080 | 12 36 58.96 | 62 22 14.89 | 0.28 | -1.94 | 106.6 | 80.0 | 4.41E-16 | 1.62E+06 | 8.4 | 0.12 | ||
| CDFN 14046 | 12 36 59.07 | 62 25 21.81 | 0.31 | -1.04 | 2.82 0.38 | 164.3 | 80.0 | 1.16E-14 | 44.9 | 8.68E+05 | 11.5 | 0.31 |
| CDFN 44836 | 12 37 01.69 | 62 07 20.21 | 0.56 | -3.15 | 323.6 | 80.0 | 8.56E-16 | 1.74E+06 | 6.9 | 0.61 | ||
| CDFN 53291 | 12 37 01.70 | 62 02 22.05 | 0.10 | -1.59 | 2.17 0.32 | 99.6 | 80.0 | 1.89E-15 | 43.8 | 6.41E+05 | 11.8 | 0.10 |
| CDFN 45610 | 12 37 06.59 | 62 07 26.83 | 0.79 | -1.05 | -1.0 | 80.0 | 7.08E-16 | 1.76E+06 | 7.0 | |||
| CDFN 29120 | 12 37 06.90 | 62 17 02.37 | 0.29 | -1.06 | 1.02 | 766.3 | 80.0 | 3.54E-14 | 44.3 | 1.87E+06 | 3.9 | 0.98 |
| CDFN 16936 | 12 37 07.01 | 62 24 27.81 | 0.92 | -1.25 | 161.3 | 80.0 | 1.00E-15 | 1.08E+06 | 10.8 | 0.30 | ||
| CDFN 45284 | 12 37 09.85 | 62 08 00.82 | 0.39 | -1.40 | 2.18 | 128.6 | 80.0 | 2.11E-14 | 44.9 | 1.71E+06 | 6.6 | 0.21 |
| CDFN 20246 | 12 37 10.00 | 62 22 58.92 | 0.20 | -1.42 | 1.41 0.24 | 318.6 | 708.0 | 5.21E-15 | 43.8 | 1.60E+06 | 9.4 | -0.35 |
| CDFN 38580 | 12 37 12.07 | 62 12 11.61 | 0.70 | -1.14 | 2.91 | 80.0 | 80.0 | 3.84E-16 | 43.4 | 1.72E+06 | 3.5 | |
| CDFN 32673 | 12 37 13.72 | 62 15 45.14 | 0.52 | -1.14 | 129.8 | 80.0 | 4.46E-16 | 1.90E+06 | 3.7 | 0.21 | ||
| CDFN 43967 | 12 37 14.06 | 62 09 16.80 | 0.38 | -0.96 | 1.84 0.28 | 105.3 | 80.0 | 3.57E-15 | 43.9 | 1.83E+06 | 5.7 | 0.12 |
| CDFN 30147 | 12 37 16.69 | 62 17 33.18 | 0.56 | -1.75 | 1.15 | 1015.7 | 346.0 | 2.17E-14 | 44.2 | 1.84E+06 | 5.1 | 0.47 |
| CDFN 50281 | 12 37 16.99 | 62 05 53.05 | 0.59 | -1.05 | 1.94 | 398.5 | 80.0 | 1.94E-15 | 43.7 | 7.26E+05 | 8.9 | 0.70 |
| CDFN 28149 | 12 37 17.90 | 62 18 55.56 | 0.17 | -1.24 | 2.24 | 195.2 | 80.0 | 9.95E-15 | 44.6 | 1.78E+06 | 6.2 | 0.39 |
| CDFN 46227 | 12 37 21.72 | 62 08 50.41 | 0.84 | -0.80 | 2.56 0.36 | 292.1 | 80.0 | 2.43E-16 | 43.1 | 1.77E+06 | 6.6 | 0.56 |
| CDFN 51788 | 12 37 23.03 | 62 05 39.45 | 0.99 | -1.08 | 2.28 0.33 | 146.6 | 78.5 | 2.65E-15 | 44.0 | 7.43E+05 | 9.4 | 0.27 |
| CDFN 27360 | 12 37 26.58 | 62 20 26.46 | 0.14 | -2.26 | 1.86 0.29 | 777.7 | 102.0 | 1.40E-15 | 43.5 | 1.40E+06 | 8.0 | 0.88 |
| CDFN 38126 | 12 37 28.65 | 62 14 22.56 | 0.58 | -1.80 | 226.1 | 80.0 | 1.20E-16 | 1.82E+06 | 5.0 | 0.45 | ||
| CDFN 40913 | 12 37 30.77 | 62 12 58.50 | 0.97 | -1.78 | 139.3 | 107.0 | 2.08E-16 | 1.79E+06 | 5.3 | 0.11 |
| ID | aaChi-squared probability (see §3) | bbIRAC spectra index; | 24 µm | 1.4 GHz | 0.5-8 keV | log Lxcc0.5-8 keV | X-ray | ddX-ray off-axis angle | ee = log (f/f) | |||
|---|---|---|---|---|---|---|---|---|---|---|---|---|
| Flux Density | Flux Density | X-ray Flux | (ergs s-1) | Exposure | () | |||||||
| (Jy) | (Jy) | (ergs s-1 cm-2) | (s) | |||||||||
| CDFN 39529 | 12 37 36.83 | 62 14 28.72 | 0.20 | -1.44 | 118.9 | 57.8 | 6.21E-15 | 1.74E+06 | 6.0 | 0.31 | ||
| CDFN 26243 | 12 37 39.78 | 62 22 39.67 | 0.38 | -2.08 | 218.2 | 80.0 | 3.33E-15 | 6.12E+05 | 10.7 | 0.44 | ||
| CDFN 44598 | 12 37 41.00 | 62 12 00.29 | 0.26 | -0.63 | 1.17 | 558.2 | 80.0 | 2.02E-14 | 44.2 | 1.76E+06 | 6.7 | 0.84 |
| CDFN 34143 | 12 37 42.58 | 62 18 11.67 | 0.16 | -1.55 | 2.31 | 149.6 | 80.0 | 2.08E-14 | 44.9 | 1.69E+06 | 7.8 | 0.27 |
| CDFN 44751 | 12 37 44.67 | 62 12 18.71 | 0.21 | -0.94 | 1.69 0.27 | 416.1 | 67.3 | 2.88E-16 | 42.7 | 1.76E+06 | 7.1 | 0.79 |
| CDFN 40112 | 12 37 57.32 | 62 16 27.57 | 0.28 | -1.55 | 2.92 | 122.3 | 80.0 | 4.68E-15 | 44.5 | 1.70E+06 | 8.7 | 0.18 |
| CDFN 54722 | 12 37 57.55 | 62 08 00.51 | 0.65 | -1.13 | 174.9 | 80.0 | 1.01E-15 | 6.41E+05 | 10.3 | 0.34 | ||
| CDFN 49940 | 12 37 59.62 | 62 11 02.09 | 0.58 | -1.42 | 0.91 | 2132.0 | 85.0 | 1.52E-13 | 44.8 | 7.33E+05 | 9.1 | 1.40 |
| CDFN 45792 | 12 38 00.94 | 62 13 35.90 | 0.43 | -0.72 | 0.44 | 4092.5 | 190.0 | 7.78E-14 | 43.7 | 1.44E+06 | 8.8 | 1.33 |
| CDFN 53792 | 12 38 31.18 | 62 12 21.98 | 0.59 | -0.77 | 1.63 0.26 | 297.0 | 80.0 | 3.76E-15 | 43.8 | 6.62E+05 | 12.4 | 0.57 |
| CDFN 53753 | 12 38 32.19 | 62 12 30.60 | 0.25 | -0.66 | 1.63 0.26 | 198.4 | 80.0 | 2.79E-15 | 43.7 | 6.15E+05 | 12.5 | 0.39 |
| CDFN 54888 | 12 38 34.09 | 62 12 05.88 | 0.67 | -1.75 | 1.96 0.30 | 476.4 | 80.0 | 1.59E-15 | 43.6 | 5.57E+05 | 12.8 | 0.77 |
| Source | z | X-ray | EER | Detection | Aperture | Flux | H/SbbFlux ratio corrected for Galactic absorption | log NH | |
|---|---|---|---|---|---|---|---|---|---|
| BandaaFull band = 0.5-8 keV; Hard band = 2-8 keV; Soft band = 0.5-2 keV | (%) | Corrected | (erg s-1 cm-2) | (cm-2) | |||||
| Count Rate (s-1) | |||||||||
| CDFN14642 | 2.36 | Full | 80 | 4.6 | 4.44E-05 | 0.28 | 9.19E-16 | 11.17 | 23.7 |
| Hard | 70 | 3.3 | 2.33E-05 | 6.98E-16 | |||||
| Soft | 60 | 3.3 | 1.27E-05 | 6.08E-17 | |||||
| CDFN20981 | Full | 80 | 2.5 | 1.44E-05 | 0.41 | 1.68E-16 | 6.96 | 22.5 - 23.7 | |
| Hard | 80 | 2.5 | 1.00E-05 | 2.31E-16 | |||||
| Soft | 60 | 3.3 | 6.35E-06 | 3.18E-17 | |||||
| CDFN25218 | Full | 80 | 3.5 | 3.61E-05 | 0.61 | 4.21E-16 | 5.58 | 22.4 - 23.6 | |
| Hard | 70 | 2.8 | 2.35E-05 | 5.42E-16 | |||||
| Soft | 80 | 2.5 | 1.86E-05 | 9.33E-17 | |||||
| CDFN37334 | 1.71 | Full | 80 | 2.6 | 1.02E-05 | 0.20 | 1.19E-16 | 8.83 | 23.3 |
| Hard | 80 | 2.5 | 1.17E-05 | 2.70E-16 | |||||
| Soft | 70 | 3.2 | 5.85E-06 | 2.93E-17 | |||||
| CDFN37928 | 1.35 | Full | 70 | 2.5 | 9.22E-06 | 0.69 | 1.07E-16 | 5.09 | 22.9 |
| Hard | 70 | 2.5 | 8.10E-06 | 1.87E-16 | |||||
| Soft | 60 | 2.8 | 7.03E-06 | 3.52E-17 | |||||
| CDFN38126 | Full | 80 | 2.7 | 1.03E-05 | 1.20E-16 | ||||
| Hard | 80 | 2.5 | 1.03E-05 | 2.38E-16 | |||||
| Soft | 80 | 2.5 | 6.97E-06 | 3.49E-17 | |||||
| CDFN39358 | 1.86 | Full | 80 | 2.8 | 4.04E-05 | 0.14 | 4.71E-16 | 9.42 | 23.4 |
| Hard | 80 | 2.6 | 3.39E-05 | 7.82E-16 | |||||
| Soft | 70 | 2.5 | 1.59E-05 | 7.97E-17 | |||||
| CDFN44751 | 1.69 | Full | 80 | 3.7 | 2.47E-05 | 0.52 | 2.88E-16 | 6.21 | 23.2 |
| Hard | 80 | 2.5 | 2.01E-05 | 4.64E-16 | |||||
| Soft | 80 | 4.2 | 1.43E-05 | 7.17E-17 | |||||
| CDFN44902 | 1.16 | Full | 70 | 2.5 | 4.54E-05 | 1.05 | 5.29E-16 | 3.41 | 22.5 |
| Hard | 80 | 2.5 | 2.78E-05 | 6.41E-16 | |||||
| Soft | 60 | 5.0 | 3.60E-05 | 1.80E-16 | |||||
| CDFN46227 | 2.56 | Full | 60 | 2.5 | 1.04E-05 | 0.83 | 1.21E-16 | 4.37 | 23.3 |
| Hard | 60 | 2.5 | 6.83E-06 | 1.58E-16 | |||||
| Soft | 60 | 2.7 | 6.91E-06 | 3.46E-17 |
| Source | z | 0.5-8 keV | 2-8 keV | 0.5-2 keV | aaAlexander et al. (2003) | H/SbbFlux ratio corrected for Galactic absorption | log NHccSources with no lower error have an immeasurably low lower limit. |
|---|---|---|---|---|---|---|---|
| FluxaaAlexander et al. (2003) | FluxaaAlexander et al. (2003) | FluxaaAlexander et al. (2003) | (cm-2) | ||||
| (erg s-1 cm-2) | (erg s-1 cm-2) | (erg s-1 cm-2) | |||||
| CDFN07514 | 2.97 | 2.00E-15 | 1.54E-15 | 4.19E-16 | 1.1 | 3.54 | 23.3 |
| CDFN11516 | 2.05 | 5.27E-15 | 2.85E-15 | 2.04E-15 | 1.8 | 1.33 | 21.2 |
| CDFN11965 | 1.90 | 1.95E-15 | 1.56E-15 | 3.44E-16 | 0.9 | 4.38 | 23.1 |
| CDFN12939 | 0.71 | 2.23E-13 | 1.36E-13 | 8.05E-14 | 1.6 | 1.62 | 21.4 |
| CDFN14046 | 2.82 | 1.16E-14 | 6.63E-15 | 4.32E-15 | 1.7 | 1.47 | 22.0 |
| CDFN14667 | 3.45E-15 | 2.13E-15 | 1.13E-15 | 1.6 | 1.81 | 21.5 - 22.6 | |
| CDFN16796 | 2.20 | 1.34E-15 | 1.20E-15 | 1.20E-16 | 0.4 | 9.72 | 23.6 |
| CDFN17315 | 2.41 | 7.02E-15 | 4.72E-15 | 2.18E-15 | 1.5 | 2.08 | 22.6 |
| CDFN20246 | 1.41 | 5.21E-15 | 4.99E-15 | 1.35E-16 | -0.6 | 36.19 | 23.6 |
| CDFN23661 | 2.59 | 1.88E-14 | 1.10E-14 | 7.43E-15 | 1.8 | 1.41 | 21.8 |
| CDFN24409 | 2.72 | 3.35E-15 | 2.32E-15 | 9.48E-16 | 1.4 | 2.35 | 22.8 |
| CDFN25248 | 2.89 | 9.64E-16 | 8.63E-16 | 1.08E-16 | 0.5 | 7.75 | 23.7 |
| CDFN27360 | 1.86 | 1.40E-15 | 1.32E-15 | 1.52E-16 | 0.5 | 8.43 | 23.4 |
| CDFN27641 | 2.02 | 2.52E-15 | 2.48E-15 | 2.07E-16 | 0.2 | 11.66 | 23.6 |
| CDFN28149 | 2.24 | 9.95E-15 | 6.20E-15 | 3.43E-15 | 1.6 | 1.73 | 22.3 |
| CDFN28773 | 0.96 | 1.01E-14 | 5.35E-15 | 4.57E-15 | 1.9 | 1.12 | 21.2 |
| CDFN29120 | 1.02 | 3.54E-14 | 1.89E-14 | 1.57E-14 | 1.9 | 1.15 | 21.4 |
| CDFN30147 | 1.15 | 2.17E-14 | 1.73E-14 | 4.26E-15 | 1.0 | 3.92 | 22.6 |
| CDFN32673 | 4.46E-16 | 5.30E-16 | 2.55E-17 | 1.4 | 19.96 | 22.9 - 24.0 | |
| CDFN34143 | 2.31 | 2.08E-14 | 1.29E-14 | 7.30E-15 | 1.6 | 1.69 | 22.2 |
| CDFN37999 | 2.00 | 1.83E-15 | 1.83E-15 | 1.17E-16 | 0.1 | 15.24 | 23.7 |
| CDFN38580 | 2.91 | 3.84E-16 | 3.74E-16 | 2.93E-17 | 0.2 | 12.42 | 23.9 |
| CDFN39529 | 6.21E-15 | 5.16E-15 | 1.09E-15 | 0.9 | 4.57 | 22.3 - 23.5 | |
| CDFN40112 | 2.92 | 4.68E-15 | 2.42E-15 | 2.27E-15 | 2.0 | 1.02 | 20.7 |
| CDFN41981 | 1.54 | 2.59E-14 | 2.18E-14 | 4.34E-15 | 0.9 | 4.85 | 23.0 |
| CDFN43967 | 1.84 | 3.57E-15 | 2.44E-15 | 1.02E-15 | 1.4 | 2.30 | 22.5 |
| CDFN44598 | 1.17 | 2.02E-14 | 1.28E-14 | 6.96E-15 | 1.6 | 1.76 | 21.8 |
| CDFN44836 | 8.56E-16 | 9.77E-16 | 5.71E-17 | 1.4 | 16.43 | 22.8 - 24.0 | |
| CDFN45284 | 2.18 | 2.11E-14 | 1.27E-14 | 7.82E-15 | 1.7 | 1.55 | 22.1 |
| CDFN45792 | 0.44 | 7.78E-14 | 3.83E-14 | 3.87E-14 | 2.0 | 0.94 | |
| CDFN49937 | 0.29 | 9.75E-15 | 5.69E-15 | 3.65E-15 | 1.7 | 1.49 | 21.0 |
| CDFN49940 | 0.91 | 1.52E-13 | 9.11E-14 | 5.64E-14 | 1.7 | 1.54 | 21.4 |
| CDFN50281 | 1.94 | 1.94E-15 | 9.82E-16 | 7.57E-16 | 1.8 | 1.24 | 22.0 |
| CDFN53792 | 1.63 | 3.76E-15 | 3.06E-15 | 6.42E-16 | 0.9 | 4.60 | 23.0 |
| Galaxy | UBVR | JHK | µm | 3.6, 4.5 µm | µm | Other |
|---|---|---|---|---|---|---|
| spectrum | spectrum | |||||
| Arp 220 | 1 | 4 | 5 | 7; 54.2, 46.6 mJy | 9 | 12, 13 |
| IRAS 17208-0014 | 2 | 4 | 6 | 8; 17.9, 17.3 mJy | 10 | 14 |
| Mrk 273 | 3 | 4 | 5 | 7; 27.6, 38.2 mJy | 11 | 15 |
References. — (1) Frueh et al. 1996; (2) Duc, Mirabel, & Maza 1997; (3) Surace, Sanders, & Evans 2000; (4) 2MASS via NED; (5) Imanishi, Dudley, & Maloney 2006; (6) Imanishi 2006; (7) Spitzer PID 32, extraction aperture diameter of 90” for Arp 220 and 50” for Mrk 273; (8) Spitzer PID 3672, extraction aperture 30” in diameter; (9) Armus et al. 2006; (10) Rigopoulou et al. 1999; (11) Higdon et al. 2006; (12) Klaas et al. 1997; (13) Rieke et al. 1985; (14) Scoville et al. 2000; (15) Rieke 1978
| Arp 220 | IRAS 17208-0014 | Mrk 273 | |||
|---|---|---|---|---|---|
| (µm) | (Jy) | (µm) | (Jy) | (µm) | (Jy) |
| 1.6572E-02 | 1.2100E-07 | 1.6177E-02 | 1.8200E-09 | 1.6256E-02 | 4.7100E-08 |
| 1.8124E-02 | 1.7100E-07 | 1.7693E-02 | 2.7100E-09 | 1.7778E-02 | 6.6600E-08 |
| 1.9823E-02 | 2.4300E-07 | 1.9352E-02 | 4.0800E-09 | 1.9445E-02 | 9.4900E-08 |
| 2.1690E-02 | 3.3200E-07 | 2.1174E-02 | 5.8800E-09 | 2.1276E-02 | 1.3000E-07 |
| 2.3723E-02 | 4.4200E-07 | 2.3159E-02 | 8.2500E-09 | 2.3271E-02 | 1.7200E-07 |
Note. — The complete version of this table is in the electronic edition of the Journal. The printed edition contains only a sample.