xxx–yyy
Formation History of Stars and Star Clusters in Nearby Galaxies
Abstract
We present first results from an HST/ACS imaging survey of stars and star clusters in five nearby spiral galaxies. This contribution concentrates on NGC 1313, a highly distorted late-type barred spiral. We compare the field star and cluster formation histories in our three ACS pointings for this galaxy. In one pointing, both the cluster and field star age distributions show clear evidence for a ramp-up in the star formation rate about years ago.
keywords:
galaxies: evolution, galaxies: star clusters, galaxies: stellar content1 Introduction
Star clusters offer a potentially powerful alternative to “field” stars for studies of star formation histories in external galaxies. The most massive of them are composed of or more stars, and can be observed at much greater distances than individual stars. Globular clusters have survived since very early in the history of the Universe, so clusters clearly have the potential to trace virtually the entire evolutionary histories of galaxies. Furthermore, they offer the distinct advantage that their integrated spectra are typically broadened by only a few km/s, compared to hundreds of km/s for massive galaxies, so the prospects are bright for taking full advantage of the high-resolution stellar and SSP model spectral libraries that are now becoming available. Efforts are currently under way by several groups to develop techniques for detailed abundance analysis based on high-dispersion spectroscopy of extragalactic young and old star clusters (R. Peterson, these proceedings; [Bernstein & McWilliam (2005), Larsen et al. (2006), Bernstein & McWilliam 2005; Larsen et al. 2006]).
However, star clusters come with their own set of challenges. One big challenge is to explain the large variations in globular cluster specific frequency, not just between galaxies but also for stellar populations within galaxies. This is nicely illustrated by the Fornax dwarf spheroidal, whose field star metallicity distribution peaks at [Fe/H] [Helmi et al. (2006), (Helmi et al. 2006; Tolstoy, these proceedings)] while the 5 globular clusters all are significantly more metal-poor ([Fe/H]; [Strader et al. (2003), Letarte et al. (2006), Strader et al. 2003; Letarte et al. 2006]). The picture is complicated by dynamical evolution, which tends to selectively remove low-mass clusters [Fall & Zhang (2001), Larsen (2006), (Fall & Zhang 2001; Larsen 2006)]. Unless these differences are understood, it will be difficult to infer the relative and absolute strengths of star formation episodes from studies of cluster populations, although the timing and age-metallicity relations may be constrained with greater confidence.

The identification of star clusters remains challenging in star forming galaxies, and much less is known about star cluster populations in spiral galaxies compared to the vast amount of data collected for ellipticals and S0’s over the past decade. It is not yet clear, for example, if there is a constant formation efficiency for (bound) clusters relative to “field” stars. We have undertaken a survey of star clusters in five nearby spirals, using the Advanced Camera for Surveys (ACS) on board the Hubble Space Telescope (HST). Based on our ground-based imaging [Larsen & Richtler (1999), (Larsen & Richtler 1999)] the HST sample was designed to span a range from poor to rich cluster populations, largely reflecting differences in the star formation rate. The five galaxies are (roughly in order of richness): NGC 4395, NGC 45, NGC 7793, NGC 1313 and NGC 5236. All are at distances of 4–5 Mpc, so that one ACS/WFC pixel corresponds to a linear scale of about 1 pc. With typical half-light radii of 2–4 pc, clusters are thus readily identifiable as extended objects. In addition to ACS data, we include WFPC2 -band imaging to allow reliable age-dating of the clusters. First results for clusters in NGC 45, including the surprising detection of a rich population of old GCs, have been presented in [Mora, Larsen & Kissler-Patig (2007a)], and analysis of the full sample of galaxies is currently in progress (Mora et al., in prep.).
The galaxies in our sample are close enough to also resolve significant numbers of field stars, and an important aspect of our study is to link the properties of field stars and cluster populations. In the following we describe our first steps towards achieving this goal in the galaxy NGC 1313.
2 Field Stars and Clusters in NGC 1313
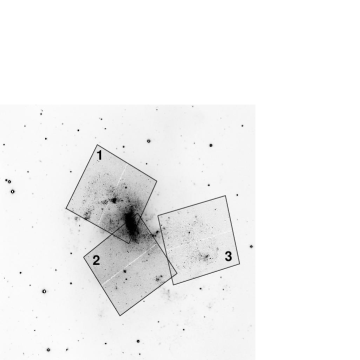
NGC 1313 is a nearby (; Méndez et al. 2002) late-type barred spiral with a disturbed optical morphology, in which our ground-based data revealed a rich population of massive young star clusters. Our three HST/ACS pointings are illustrated in Figure 1: one includes the northern spiral arm, the second includes the bar and the third pointing covers a disturbed region of the galaxy, some ( kpc projected) west of the main bar.
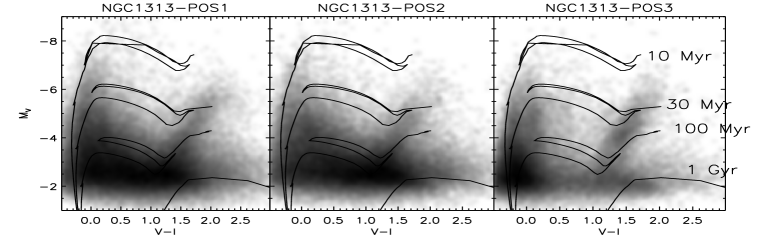
The () Hess diagrams for stars in the three fields are shown in the top panel of Figure 2. Photometry was done using the DAOPHOT package [Stetson (1987), (Stetson 1987)]; stars are detected to but the detection completeness drops rapidly below . Isochrones from the Padova group [Girardi et al. (2002), (Girardi et al. 2002)] are shown for . Already from a visual inspection of the Hess diagrams, one notes significant differences between the three fields: in particular, there is a relative lack of cool giants and/or supergiants fainter than in Field 3 and a corresponding excess of main sequence stars at , suggesting that star formation ramped up in this field some years ago.
By employing CMD modelling techniques we can obtain more detailed and quantitative information about the recent (few times years) star formation histories in these fields. We used the Padova isochrones to construct model CMDs for various star formation histories, including a realistic modelling of photometric errors and completeness and (age-dependent) reddening. It is a challenging test for the isochrones to match this region of the CMDs, which includes the most massive stars, and we do not achieve perfect fits. The best fits are obtained for – models of higher or lower metallicities do not match the location of the red and blue core He burning stars nearly as well. In spite of significant uncertainties, a general picture of differences between the three fields can be constructed (Fig. 2, centre): In Field 3, star formation indeed appears to have ramped up about years ago, quite unlike the other two fields where the star formation rate has been roughly constant or decreasing over the last several 100 Myrs. The dip to zero star formation at years in all three fields is almost certainly due to difficulties with the modelling of red supergiants - a similar problem occurs around this age when ages are derived for star clusters from their integrated colours (e.g. Mora et al. 2007a).
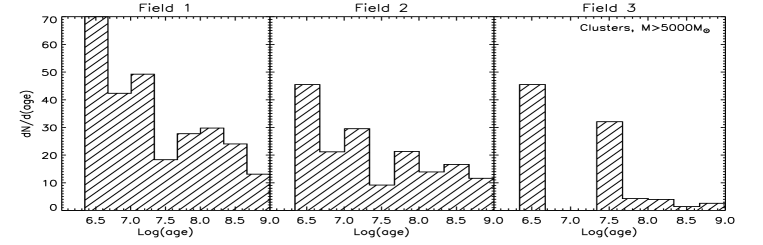
We do not necessarily expect a 1:1 correspondence between field star and cluster age distributions, since the exact relation between the two may be affected by cluster disruption, variations in the cluster formation efficiency, mass functions etc. Nevertheless, major bursts of star formation should be visible in both the cluster- and field star age distributions. The bottom panel of Fig. 2 shows the age distributions of star clusters with estimated masses M⊙, derived by comparing their integrated UBVI colours with SSP models (in this case models taken from the website of the Padova group). Note that the histograms show the number of clusters per linear age interval, even though the age axis itself is logarithmic. At least in a qualitative sense, the cluster age distributions appear consistent with the field star age distributions, with an excess of clusters around in Field 3 (the bin at only represents a single cluster). To give a more quantitative estimate of differences, we calculated the number ratio of clusters older than years () to those younger than years () for the three fields, and obtain = 4.9 (Field 1), 6.1 (Field 2) and 2.2 (Field 3). This again seems consistent with a relative increase in star formation activity in Field 3 in the last years.
3 Concluding remarks
With ACS imaging, we are now in a position to simultaneously constrain the star and cluster age distributions for galaxies outside the Local Group. Our first results provide evidence for an increase in star formation rate years ago in one of three fields in NGC 1313, which is reflected in both the field star and cluster age distributions.
Acknowledgements.
SSL is grateful to the Leids Kerkhoven-Bosscha Fonds for supporting attendance of the Symposium.References
- [Bernstein & McWilliam (2005)] Bernstein, R.A. & McWilliam, A. 2005, in “Resolved Stellar Populations”, ASP Conf. Ser., eds. D. Valls-Gabaud & M. Chavez, preprint astro-ph/0507042
- [Fall & Zhang (2001)] Fall, S.M., & Zhang, Q. 2001, ApJ 561, 751
- [Girardi et al. (2002)] Girardi, L., Bertelli, G., Bressan, A. et al. 2002, A&A 391, 195
- [Helmi et al. (2006)] Helmi, A., Irwin, M.J., Tolstoy, E., et al. 2006, ApJ 651, L121
- [Larsen (2006)] Larsen, S.S., 2006, in: “Mass loss from stars and the evolution of stellar clusters”, ASP Conf. Ser., 2006 (San Francisco: SFP) eds. A. de Koter, R. Waters, & L. Smith (astro-ph/0609062)
- [Larsen et al. (2006)] Larsen, S.S., Origlia, L., Brodie, J.P., & Gallagher, J.S. 2006, MNRAS 368, L10
- [Larsen & Richtler (1999)] Larsen, S.S. & Richtler, T. 1999, A&A 345, 59
- [Letarte et al. (2006)] Letarte, B., Hill, V., Jablonka, P., et al. 2006, A&A 453, 547
- [Méndez et al. (2002)] Méndez, B., Davis, M., Moustakas, J., et al. 2002, AJ 124, 213
- [Mora, Larsen & Kissler-Patig (2007a)] Mora, M., Larsen, S.S. & Kissler-Patig, M. 2007, A&A in press (astro-ph/0612463)
- [Stetson (1987)] Stetson, P.B. 1987, PASP 99, 191
- [Strader et al. (2003)] Strader, J., Brodie, J.P., & Forbes, D.A., et al. 2003, AJ 125, 1291
BökerIs there any evidence for multiple stellar populations in any of the (young) massive star clusters? This would argue for them being stripped nuclei.
LarsenSo far no such evidence has emerged, although it is also difficult to rule out. However, most of these clusters do seem to be part of the normal hierarchy of star formation in their parent galaxies, e.g. the youngest ones tend to be found in/near spiral arms.
MeixnerAre you planning to get near-IR photometry to complement your dataset?
LarsenYes, absolutely. In fact the Wide Field Camera 3 is likely to reinvigorate this whole field thanks to its panchromatic wavelength coverage from the UV to the near-IR.
FritzeI am not convinced that the LFs for all YSC systems are power laws as you suggested in one of your first slides. Peter Anders recently has done a very careful re-analysis of WFPC2 data for the Antennae and found clear and solid evidence for a turn-over in the YSC LF. This result casts serious doubts on the universality of the SF and SCF process. Apparently the enhanced ambient pressure in a major merger can act to preferentially produce massive clusters.
LarsenI am very curious to learn more about these results. However, I would note that new ACS data are now available for the Antennae so I suspect that the final word has not yet been said.