The AAT/WFI survey of the Monoceros Ring and Canis Major Dwarf galaxy: I. from l = (193 - 276)∘
Abstract
We present the results of an AAT wide-field camera survey of the stars in the Monoceros Ring and purported Canis Major overdensity in the Galactic longitudes of l = (193 - 276)∘. Current numerical simulations suggest that both of these structures are the result of a single on-going accretion event, although an alternative solution is that the warped and flared disc of the Galaxy can explain the origin of both of these structures. Our results show that, with regards the Monoceros Ring, the warped and flared disc is unable to reproduce the locations and strengths of the detections observed around the Galaxy. This supports a non-Galactic origin for this structure. We report 8 new detections and 2 tentative detections of the Monoceros Ring in this survey. The exact nature of the Canis Major overdensity is still unresolved although this survey provides evidence that invoking the Galactic warp is not a sufficient solution when compared with observation. Several fields in this survey are highly inconsistent with the current Galactic disc models that include a warp and flare, to such an extent that explaining their origins with these structures is problematic. We also report that the Blue Plume stars previously invoked to support the dwarf galaxy hypothesis is unfounded, and associating them with an outer spiral arm is equally problematic. Standard Galactic models are unable to accommodate all the observations of these new structures, leading away from a warped/flared disc explanation for their origins and more toward a non-Galactic source. Additionally, evidence is presented in favour of a detection of the Canis Major dwarf stream away from the Canis Major region. As the outer reaches of the Galactic disc continue to be probed, the fascinating structures that are the Monoceros Ring and Canis Major overdensity will no doubt continue to inform us of the unique structure and formation of the Milky Way.
keywords:
Galaxy: formation – Galaxy: structure – galaxies: interactions1 Introduction
Recent deep optical/IR surveys, such as the Sloan Digital Sky Survey (SDSS) (Adelman-McCarthy et al., 2006) and the Two-Micron All Sky Survey (2MASS) (Skrutskie et al., 2006) are revealing increasingly complex structures in the Halo of the Milky Way. Among these, several new dwarf galaxies and tidal streams have been uncovered, but do these results favour the current galaxy formation paradigm? Can we consider these new structures as supporting the Cold Dark Matter theories (Abadi et al., 2003a, b) of galaxy formation? Are these the low-mass satellites which will be gradually accreted over time, and do they resolve previous issues such as the missing satellite problem?
While it may be a little premature to answer these questions with the current knowledge of Local Group environment, there is still little direct evidence to support the idea of a merger history for the Milky Way. The Sagittarius dwarf galaxy (Ibata, Gilmore, & Irwin, 1994) has shown that such accretion does occur and is in fact on-going but there are still too few nearby tidal stream remnants to confirm it as the primary Galaxy formation mechanism. However, analyses of these large surveys are uncovering new dwarf galaxies and tidal streams in the inner halo of the Milky Way. For example, the discovery of tidal debris covering 60∘ of the sky only 20 kpc from the Sun, along with a new dwarf galaxy and other tidal debris is presented by Grillmair & Johnson (2006); Grillmair & Dionatos (2006a, b); Grillmair (2006a). Willman et al. (2005a, b) have uncovered a new dwarf galaxy in Ursa Major along with the tiny Willman I object, which is on the border between globular clusters and dwarf galaxies. Even closer satellite galaxies have been found with Belokurov et al. (2006c) and Zucker et al. (2006) presenting the discovery of another two dwarf galaxies using the SDSS database. These two in Boötes and Canes Venatici are located heliocentrically at 60 and 220 kpcrespectively, and are, with the Ursa Major dwarf galaxy, pointing to a possible resolution of the missing Galactic satellites problem outlined in Klypin et al. (1999). Further structure is also highlighted in the discussion by Belokurov et al. (2006a) on the presence of tidal arms in the nearby globular cluster NGC5466.
Our nearest spiral neighbour, M31, also shows a complicated formation history as Ferguson et al. (2002) have revealed in the Isaac Newton Telescope Wide Field Camera Survey (INT/WFC). M31 was long thought to have been a relatively quiet spiral galaxy with a well defined edge, but a faint diffuse outer disc, riddled with substructure, is now visible. Within this substructure, a giant stellar stream (Ibata et al., 2001c), a new class of stellar cluster (Huxor et al., 2005) and the new dwarf galaxy, Andromeda IX (Lewis et al., 2004; Zucker et al., 2004), have been discovered. As we probe our own Galaxy to similar depths, will we uncover similar structure? The results coming from the SDSS and 2MASS surveys are suggestive of this. The Milky Way however, does seem to be a less complex system. Although the Milky Way shows evidence of tidal debris in the Halo, within the Disc of the Galaxy a major change in recent years has been the discovery of the Monoceros Ring by Newberg et al. (2002) and its purported progenitor, the Canis Major dwarf galaxy (Martin et al., 2004a). The alternative source of the excess stars in Canis Major is the Argo Star System as discussed in Rocha-Pinto et al. (2006).
The focus of the survey presented here has been to extend the INT/WFC survey of the Monoceros Ring (Conn et al., 2005a) around the Galactic plane, as well as surveying around the Canis Major region to provide insight into the possibility of locating a dwarf galaxy there. The present survey has also attempted to investigate the Triangulum-Andromedae overdensity (Rocha-Pinto et al., 2004) and the Virgo overdensity (Jurić et al., 2005). These results will be presented elsewhere.
The layout of this paper is as follows: 2 summarises the discovery of the Monoceros Ring and the Canis Major dwarf galaxy; 3 describes the observational procedure and data reduction. Section 4 outlines the method employed to analyse the data, the use of a synthetic Galaxy model for comparison and the procedures for determining distances and completeness. Section 5 presents the data and the discussion and conclusions of this study are found in 6 and 7.
2 The Monoceros Ring and the Canis Major dwarf galaxy
Discovering the Monoceros Ring (MRi) via an overdensity of colour selected F-stars in the SDSS dataset, Newberg et al. (2002) described its original extent from l = (170 - 220)∘. Subsequent surveys in 2MASS (Rocha-Pinto et al., 2003; Martin et al., 2004a) and the INT/WFC (Ibata et al., 2003; Conn et al., 2005a) extended the MRi detections back towards the Galactic centre with some tentative detections in the fields (l,b) = (61,15)∘ and (75,15)∘. More recently, Belokurov et al. (2006a), while tracing the Sagittarius stream with SDSS, notes the presence of the MRi in two bands at latitudes of b = (20 - 30)∘. Additionally, Grillmair (2006b) discusses substructure in the MRi, again revealed in the SDSS catalogue. Consistently, the MRi is found on both sides of the plane of the Galaxy at galactocentric distances of 17 kpc.
Revealing an overdensity in the 2MASS data, Martin et al. (2004a) fulfilled a prediction by Newberg et al. (2002) that a potential progenitor of the MRi could lie in the nearby Canis Major constellation. Nestled under the Galactic disc, this overdensity, dubbed the Canis Major dwarf galaxy (CMa), can be found at (l,b) = (240,9)∘ and 7 kpc from the Sun. Its close proximity to the Galactic disc led Momany et al. (2004) to argue that the overdensity was simply a consequence of the Galactic warp. In response to this interpretation, Martin et al. (2005a) presented results from a 2-degree Field (2dF) spectrographic radial velocity survey taken at the Anglo-Australian Telescope. The initial results were complicated through difficulties in removing the instrumental signature from the data, but after resolving these issues Martin et al. (2005a) maintained an interesting population of stars with a velocity anomalous to the Galactic disc. Additionally, Conn et al. (2005b) showed that in the background of CMa, the MRi was present at a distance of 13.5 kpc, with a velocity of 133 and a dispersion of 23 . Finally, using radial velocity data of the Carina dwarf and Andromeda galaxies, the MRi was revealed in the foreground of these objects (Martin et al., 2006a). In front of the Carina dwarf, it has properties of Vr = 1455 with a velocity dispersion of only 175 . In front of the Andromeda galaxy, with stars taken from the “One Ring” field (l,b) = (123,19)∘, it has properties of Vr = 754 and a dispersion of 263 . Slowly, both a velocity and spatial distribution of the MRi is being revealed.
The three main sources of evidence for the CMa dwarf are (in order of significance): the overabundance of Red Clump and RGB stars in this region as seen in the 2MASS catalogue (Bellazzini et al., 2006); the additional velocity component as seen in the 2dF survey of the CMa region and the presence of a strong Blue Plume population as can be seen in Figure 1 of Martínez-Delgado et al. (2005a). Recently, the origins of the Blue Plume population has been brought into question by Carraro et al. (2005) and Moitinho et al. (2006), who do not associate these stars with the foreground overdensity, but rather part of a more distant population of stars. This distant population is claimed to be the extension of the Norma-Cygnus spiral arm into the CMa region; and so these stars now require greater scrutiny in light of this new interpretation. Momany et al. (2006) has also produced a more complete study of their warp scenario, in which they confront the first and second sources of evidence for CMa. They argue that not only can the CMa overdensity be explained by the warp, but that the velocity dispersion as presented by Martin et al. (2005a) is expected by current Galaxy models and shows nothing new. In studying the outer disc they suggest the MRi is not a tidal arm from an accretion event but rather the extension of the flare of the disc into those latitudes. In short, they claim all of the new structures in the disc of the Milky Way are simply explained in terms of known Galactic structure. López-Corredoira (2006) concludes on the “Galactic warp versus dwarf galaxy” debate with the statement that the warp can be formed by such a wide variety of causes that neither radial velocity or photographic surveys can disentangle their origins. This is maybe the case, although a systematic survey of the ages, metallicities, distances and abnormal velocity profiles in this region should provide strong indications if a dwarf galaxy resides in the plane or not. The warp is an important part of the puzzle but should not stop progress in resolving this issue.
Although the results from this paper are unable to answer questions regarding the velocity profile of these outer disc objects, it will attempt to understand those of the CMa and MRi overdensities with regard to their distance and position in the Galaxy. In our discussion, we comment on the likelihood of the proposals put forward by Momany et al. (2006) in explaining the MRi in terms of the outer disc and whether the warp satisfactorily describes the CMa overdensity.
3 Observations and Reduction
The data were obtained using the Anglo-Australian Telescope Wide Field Imager (AAT/WFI) at Siding Spring Observatory (SSO) in New South Wales, Australia. Mounted at the telescope prime focus, the camera consisting of eight 4k2k CCDs with 0.2295 arcsec per pixel, covers a field of view approximately 33’33’ per pointing.
The observations were taken over four observing runs, the first on the 22nd-25th January 2004, the second on 30th January - 1st February 2004, the third on the 14th-16th of August 2004 and the fourth on the 1st-5th February 2006. All of the fields were observed with the (WFI SDSS #90) and (WFI SDSS #91) filters. These were chosen to minimise the fringing effects that can be present when observing with other filters. Each exposure consisted of a single 600 second exposure with the filter and two 450 second exposures with the filter. Two exposures were performed in so as to avoid preserving cosmic rays and overexposing the brighter stars when using a single 900 second exposure. Each night, twilight flats were taken along with bias and dark frames for calibration and the closest Landolt Standard Star field to our target was observed every two hours. In this manner, the removal of instrumental signatures and precise photometric calibration could be achieved. The seeing at the SSO can vary from 0.9′′ to 3.0′′ thus heavily affecting the limiting magnitude of the data. Although some fields were lost due to poor weather conditions, only the fields with the best photometry have been presented here.
The present survey was designed as a continuation of the Monoceros Ring Survey observed with the Isaac Newton Telescope Wide Field Camera (Conn et al., 2005a). The fields were chosen to be roughly separated by 20 degrees in Galactic Longitude with adjustments made on the final location to ensure that the field was placed to ensure minimal dust extinction. Altogether the present survey has observed fields from l = (193 - 25)∘, across the Galactic bulge; this paper reports only on the results of those fields in the region l = (193 - 276)∘.
This part of the survey consists of 16 fields. Most fields are approximately one square degree in size (four WFI pointings). However some fields are a combination of one, two or three pointings depending on the time available and quality of data obtained. The single pointing fields make up a strip of observations linking (240,9)∘ with (240,10)∘. A summary of the field locations and area of the sky observed with the preliminary results of this survey is shown in Figure 1 and Table 1.
A specialised version of the CASU data reduction pipeline (Irwin & Lewis, 2001) was used to perform the de-biasing and trimming, vignetting correction, astrometry and photometry. The flat fielding of the science frames used a master twilight flat generated over each entire observing run. To account for the dust extinction in the fields the dust_getval.c program supplied by Schlegel111http://www.astro.princeton.edu/schlegel/dust/data/data.html was used to determine the extinction for each star. This program interpolates the extinction from the dust maps of Schlegel, Finkbeiner, & Davis (1998). Using the several standard fields observed per night provides a comparison for the calibration of the photometry to be determined. The standards are used to derive the CCD zeropoints from which all the magnitudes are determined (Irwin & Lewis, 2001). A catalogue of each colour-band is produced by the pipeline for each paired exposure of and . Non-stellar images are rejected; however, near the limiting magnitude, galaxies begin to appear stellar-like and thus become a source of contamination in the dataset.
| Fields | Regions | Average Seeing | Total Area | Monoceros Ring | Average | Date |
|---|---|---|---|---|---|---|
| (l,b)∘ | per field | (arcsec) | () | E(B-V) | ||
| (193,21)∘ | 4 | 1.3 | 1.21 | Maybe | 0.08 | 30/01/04 |
| (218,6)∘ | 3 | 1.3 | 0.8 | Yes | 0.01 | 03/02/06 |
| (220,15)∘ | 4 | 1.0 | 1.21 | Yes | 0.22 | 31/01/04 |
| (220,15)∘ | 3 | 1.3 | 0.91 | Yes | 0.04 | 25/01/04 |
| (240,9)∘ | 3 | 1.0 | 0.91 | Yes | 0.18 | 24/01/04 |
| (240,6)∘ | 1 | 1.0 | 0.3 | No | 0.40 | 31/01/04 |
| (240,4)∘ | 1 | 1.0 | 0.3 | No | 0.99 | 31/01/04 |
| (240,2)∘ | 1 | 1.0 | 0.3 | No | 1.10 | 31/01/04 |
| (240,2)∘ | 1 | 1.0 | 0.3 | No | 0.79 | 31/01/04 |
| (240,4)∘ | 1 | 1.0 | 0.3 | Yes | 0.28 | 31/01/04 |
| (240,6)∘ | 4 | 1.2 | 1.21 | Yes | 0.13 | 31/01/04 |
| (240,10)∘ | 2 | 1.3 | 0.61 | Yes | 0.10 | 01/02/04 |
| (245,9)∘ | 4 | 1.6 | 1.21 | Yes | 0.14 | 30/01/04 |
| (260,10)∘ | 3 | 1.3 | 0.91 | No | 0.21 | 01/02/04 |
| (273,9)∘ | 2 | 1.4 | 0.53 | No | 0.29 | 03/02/06 |
| (276,12)∘ | 3 | 1.1 | 0.8 | Yes | 0.09 | 01/02/06 |
4 Data Preparation
4.1 Detecting Non-Galactic Structure
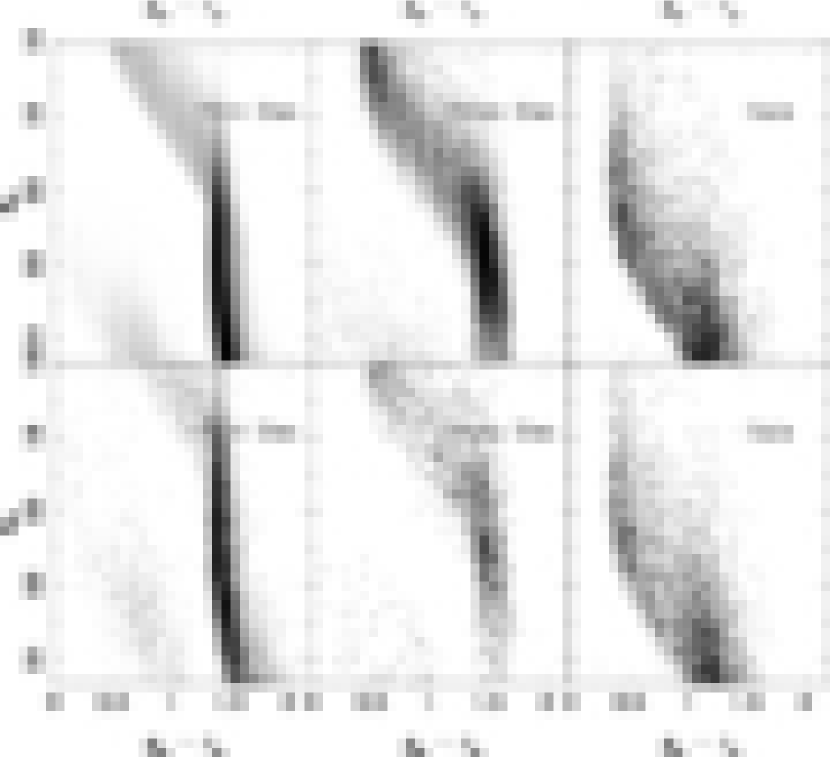
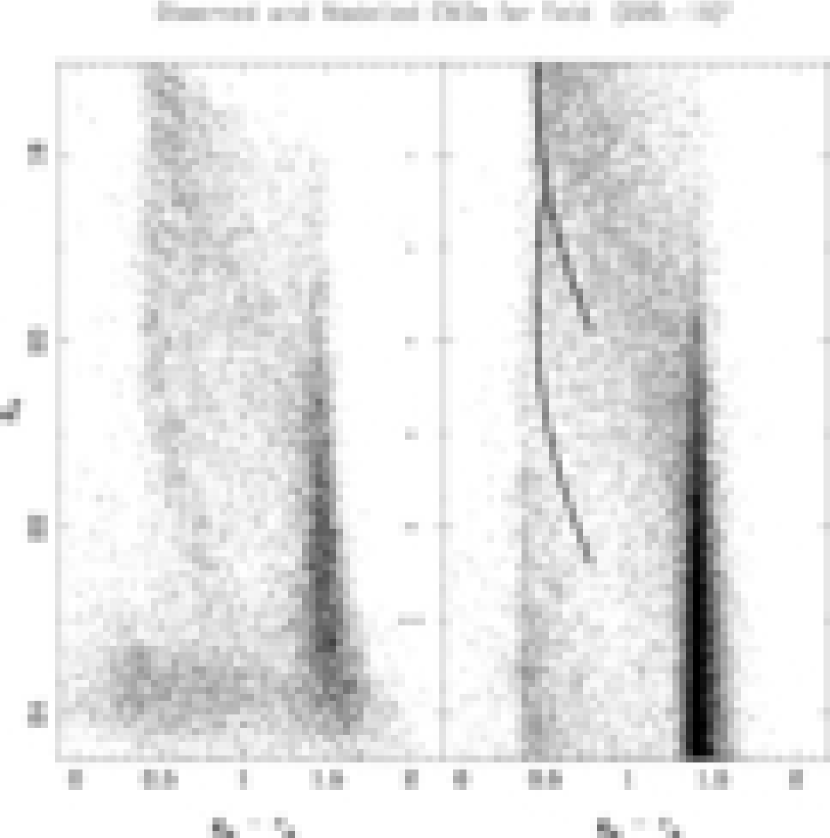
Searching for additional structure within the Colour-Magnitude diagrams (CMDs) of the AAT/WFI survey requires an understanding of the inherent structures present when observing through the Galactic disc. The Milky Way can be roughly divided into four components: Thin disc, Thick disc, Halo and Bulge. The Thin disc is essentially the plane of the Galaxy containing the majority of the stars and is where the spiral structure is also present. The Thick disc is less dense than the Thin disc and has a greater scale height out of the plane. The Halo is considered to be a smooth spherical distribution of stars around the centre of gravity of the Galaxy and extends out beyond 20 - 30 kpc. The Bulge is the central region of the Galaxy, including the Bar, and contains a very dense old stellar population. The Besançon synthetic Galaxy model222http://www.obs-besancon.fr/www/modele (Robin et al., 2003) allows for these components to be considered separately as shown in Figure 2. Each component is revealed in a distinct region of the CMD, allowing for at least a preliminary estimate of its origins when interpreting the CMDs from the observational data. It should be noted that the Besançon model employs a Thin disc cut-off at 14 kpc from the Galactic centre. The validity of such a cut-off is disputed in López-Corredoira (2006).
As an example, Figure 2 shows the breakdown of the Galactic components as seen in two one square degree fields at (240,2)∘ and (193,21)∘. Analysing Figure 2 reveals that, as expected, fields closer to the plane have more stars than those away from the plane. This manifests in the smoother CMDs in the top panels, with the bottom panels containing fewer Thin and Thick disc stars. The structure of each component is due to the homogeneity of the Galaxy and as a result a Main Sequence forms at every distance increment along that line of sight. So as the Milky Way is probed deeper, the collective weight of the Main Sequences sum to form the CMDs that are observed. The closest Main Sequences, being brighter in apparent magnitude, form at the top of the CMDs with the subsequent Main Sequences, being fainter, forming lower down on the CMDs. The different stellar components of the Thin and Thick disc shows the significant change in density between the two, giving them different characteristics in the CMDs. The Thin disc being narrow and dense has a smaller scale height (typically estimated at several hundred parsecs thick) which forms a much tighter sequence in the CMD. The more diffuse Thick disc being more extended out of the plane (several kiloparsecs, thick) forms a broader sequence. Comparing the top and bottom panels in Figure 2 also shows the importance of the angle of the observations with regard the Galactic Plane.
Detecting non-Galactic components then involves visually comparing the strong sequences detected in the observations with what is expected from the models. The Monoceros Ring is located beyond the edge of the Thick disc, and thus should be seen as a coherent sequence below the last sequence of the Thick disc, as can be seen in Figure 12 of Newberg et al. (2002). Differentiating it from the Halo component is simpler due to the Halo not having any strong Main Sequences present below the Thick disc in the range of our CMDs. So, any strong sequence below the Thick disc will most likely be of non-Galactic origins. Although given the recent hypothesis on the MRi being attributed to the flare of the disc, this will also need to be considered. Another possibility is that a non-spherical halo could be misinterpreted as a “non-Galactic” feature in the outer Thick disc. Comparisons with the Besançon synthetic galaxy model reveals that their spheroid density distribution has a flattening of 0.76 and a power index of 2.44 (Robin, Reylé, & Crézé, 2000) which is moderately non-spherical. They note a significant degeneracy between these parameters which could allow for spheroids with a (c/a) of 0.85 (close to spherical) or 0.6 (quite oblate). As discussed in the following sections, the synthetic galaxy model does not introduce structures into the outer Thick disc and so the influence of a non-spherical halo can be assumed to be minimal. The existence of the Canis Major dwarf galaxy is currently being scrutinised and so the CMDs of the CMa region will be used to investigate the influence of the Galactic warp on the stellar populations present there and whether it is a viable solution to resolving the dwarf galaxy debate.
The synthetic CMDs from the Besançon model data are considered out to 100 kpc (heliocentric distance, RHC) which ensures that the Halo population extends below the magnitude cut-off of the data and hence does not introduce additional structure. The synthetic fields contain a broad magnitude range (99,99) for each passband with zero extinction and the inclusion of all ages/populations and luminosity classes. This then provides as complete a picture of the region of interest as the model can supply. It also allows us to apply colour and distance cuts at our discretion. The model can output directly to the bands & in the CFHTLS-Megacam (AB)333http://www.cfht.hawaii.edu/Instruments/Imaging/MegaPrime/ photometric system which need to be converted to the SDSS (,) system via Equation 1.
| (1) | ||||
Frei & Gunn (1994) report that no conversion is needed between SDSS passbands (,) in the AB system to SDSS (,) in the Vega system. However, Figure 3 shows that when using only AB magnitudes, the AAT/WFI data in the Vega system does not match the model in the AB system. A fiducial of the ridgeline from the original SDSS detection of the Monoceros Ring by Newberg et al. (2002) can be seen to lie blueward of the bluest edge of the data (See 4.1.2). So, using the results of Ibata et al. (2003), who compared overlapping INT and SDSS fields to determine a colour conversion between the two systems, the model is now shifted to the Vega system in this way. This is applicable to our data as both the INT dataset and our AAT dataset have been reduced using the same pipeline (with small modifications to allow for differences between the telescopes) and no such study has been undertaken with the AAT/WFI instrument. The resultant colour transformation to the INT (,) is:
| (2) | ||||
The effect of this transformation can be seen in Figure 4. The converted SDSS fiducial, corrected via Equation 2, is now an excellent fit to the strong sequence in these data. The photometric system of the model CMD is now the same as the AAT/WFI CMD and no further changes have been applied to the model or data. All figures in this paper will be shown in the same format as Figure 4, utilising Equations 1 and 2, with the resultant () from the synthetic Galaxy model considered the same as the extinction corrected observational dataset (,). The Besançon synthetic Galaxy model employs different density profiles for each component of the Galaxy. These have been outlined in Conn et al. (2005a) and in more detail in Robin & Creze (1986); Robin et al. (1996); Robin, Reylé, & Crézé (2000) and Reylé & Robin (2001).
4.1.1 Magnitude Completeness
Most of the fields presented here, consist of several overlapping subfields, see column 2, Table 1. The completeness of this sample is determined in a similar manner to that of the 2MASS All-Sky Point Source Catalogue (Skrutskie et al., 2006). This approach determines the fraction of stars that are detected in both overlapping images as a function of magnitude. So by matching the stars within those overlapping regions and calculating the proportion of matched stars in each magnitude bin with respect to the total number of stars observed, an estimate of the completeness is made. This produces a photometric completeness curve which can fit approximately by the equation:
| (3) |
where m is the magnitude of the star, mc is the magnitude at 50% completeness and is the width of the rollover from 100% to 0% completeness. The values used to model each field can be found in Table 2.
| Fields (l,b) | () | () | |
|---|---|---|---|
| (193,21)∘ | 22.40 | 21.80 | 0.40 |
| (218,6)∘ | 23.40 | 22.40 | 0.50 |
| (220,15)∘ | 22.90 | 21.90 | 0.30 |
| (220,15)∘ | 23.60 | 22.60 | 0.30 |
| (240,9)∘ | 23.60 | 22.50 | 0.40 |
| (240,6)∘ | 24.00 | 22.70 | 0.40 |
| (240,10)∘ | 22.65 | 21.70 | 0.25 |
| (245,9)∘ | 23.30 | 22.20 | 0.60 |
| (260,10)∘ | 22.80 | 21.80 | 0.40 |
| (273,9)∘ | 23.40 | 22.20 | 0.50 |
| (276,12)∘ | 23.70 | 22.50 | 0.40 |
Although the completeness of our survey is not a key problem, attempting to characterise it does provide a manner in which we can compare the data quality of the various fields. In general, this allows an estimate of the magnitude at which the data becomes untrustworthy. Additionally, since the model is mostly used to help identify the major structures in the CMDs, it is unnecessary to apply the completeness function to the model. This is because those structures are typically well away from the 50 completeness limit. It is also important to note that while this method does not account for stars in crowded fields, none of our survey fields can be considered crowded and so this approach is valid for the entire dataset.
4.1.2 Estimating the Distance and Additional Calibration
Determining the distance to the Canis Major and Monoceros Ring sequences is achieved by taking the ridge-line of the detection in the SDSS S22320 field [Newberg et al. (2002), Figure 12] and creating a fiducial sequence. The AAT/WFI uses SDSS filters and so the fiducial sequence can be directly used on the data with the colour transformations described in Equation 2.
The heliocentric distance estimate of the SDSS S22320 detection is assumed to be 11.0 kpc (Newberg et al., 2002), this then is the zero offset distance. Since the fields have been extinction corrected it is assumed that only distance variations are the cause for any deviation in magnitude from this location. This method does not account for possible differences in age or metallicity between Main Sequences. The heliocentric distance is calculated using Equation 4 and assuming the Sun is 8.0 kpc from the Galactic centre, the galactocentric distance is found from simple trigonometry.
| (4) |
Determining a value for the error associated with such a measurement is dependent on several factors. Most predominant of these is whether the fields have been correctly calibrated with regard to their photometry and taking into account the dust extinction present within the fields. The dust correction for this data will always over-correct for stars within the Galaxy, because the dust value is based on the entire cumulative impact of the dust along that line-of-sight (Schlegel, Finkbeiner, & Davis, 1998). The stars in this survey do not reside at the end of that line-of-sight and so will be over-corrected in the dust extinction process. In most of the fields, the levels of dust are sufficiently low that the difference between the dust value used and the “correct” value should be small, see Table 1.
To determine whether the colour transformations applied to the data set correspond to reliable distance estimates, three fields to which there are distance estimates to these structures from other surveys have been analysed. Those are (l,b) = (220,15)∘, (240,9)∘ and (245,9)∘. The first field is very close to the original Monoceros Ring detection of Newberg et al. (2002) and the second and third are part of the Canis Major detection fields of Martin et al. (2005a). The MRi is known to have a distance of 11.0 kpc in the Newberg et al. (2002) field, at (220,15)∘ it is also located at 11.0 kpc. For the CMa fields, the distance determined by Martin et al. (2005a) is about 7.2 kpc. The present survey locates the centre of the strong sequence at 7.3 kpc or 0.9 magnitudes of offset. Importantly then, each distance estimate here is consistent with independent measurements of those structures.
Having understood the errors involved in both the determination of the photometry, extinction correction and the fiducial sequence, manually placing this fiducial at the centre and two extremes of an acceptable fit “by-eye” provides a range of distances over which this structure resides. Given the large errors involved, these distances can only be considered indicative of the true distance. However, the range of magnitude offsets defining the extremes do give a sense of the width of the structure. Several fields have only one distance estimate, as locating the extremes is not possible due to the data quality or the narrowness of the sequence. The dominant strong sequence in each field, which could be attributed to either the Thin/Thick disc or CMa overdensity has only a single distance estimate, corresponding to the faintest edge of that feature. This is due, in general, to the lack of a definite upper edge, see Table 3.
4.1.3 Signal to Noise Estimation Technique
Estimating the signal to noise ratio (S/N) of the Monoceros Ring Main Sequence found in the data has been attempted for several fields. The criteria for S/N determination is that the MRi Main Sequence is sufficiently distinct from the CMa/Disc sequence to avoid potential contamination. The model field is assumed to represent the properties of the background Galactic stars which should be removed to highlight the additional MRi Main Sequence. The model needs to be adjusted first to more accurately reflect the properties of the data and then subtracted to reveal the excess MRi stars. Before subtraction the model is degraded to match both the completeness profile of the data as shown in Table 2 and the relevant magnitude error properties. To ensure that similar numbers of stars are present in both the data and model prior to subtraction an additional scaling factor is applied. These processes result in the data and the model being essentially identical with the exclusion of the additional MRi Main Sequence. The S/N is estimated by dividing the number of stars in the feature by the Poisson noise due to the modelled number of stars in the region444Parameters available on request: bconn@eso.org. Only five fields have been suitable for this estimate namely (l,b)∘ = (218,6)∘, (220,15)∘, (220,15)∘, (240,10)∘ and (276,12)∘, see Table 3. These fields have MRi detections which are easily distinguished from the dominant Main Sequences in the CMD and thus are suitable for this technique. The remaining detections are too close to the CMa/Disc population to easily measure their S/N ratio with this method.
5 Survey Fields
| Fields (l,b)∘ | MRi offset | MRi dist | MRi S/N | MW/CMa offset | MW/CMa dist |
|---|---|---|---|---|---|
| & width (mag) | & width (kpc) | estimate | Lower edge (mag) | (kpc) | |
| (193,21)∘ | 0.5 | 13.8 | - | 1.2 | 6.3 |
| (218,6)∘ | 0.0 | 11.0 | 34 | 1.5 | 5.5 |
| (220,15)∘ | 0.2 | 12.1 | 32 | 1.4 | 5.8 |
| (220,15)∘ | 0.0 | 11.0 | 14 | 2.5 | 3.5 |
| (240,9)∘ | 0.4 | 13.2 | - | 0.6 | 8.3 |
| (240,6)∘ | - | - | - | - | - |
| (240,4)∘ | - | - | - | - | - |
| (240,2)∘ | - | - | - | - | - |
| (240,2)∘ | - | - | - | - | - |
| (240,4)∘ | 0.1 | 11.5 | - | 1.4 | 5.8 |
| (240,6)∘ | 0.3 | 12.6 | - | 1.2 | 6.3 |
| (240,10)∘ | 0.5 | 13.8 | 22 | 2.2 | 4.0 |
| (245,9)∘ | 0.5 | 13.8 | - | 0.6 | 8.3 |
| (260,10)∘ | - | - | - | 0.3 | 9.6 |
| (273,9)∘ | - | - | - | 0.3 | 9.6 |
| (276,12)∘ | 0.3 | 12.6 | 26 | 2.0 | 4.4 |
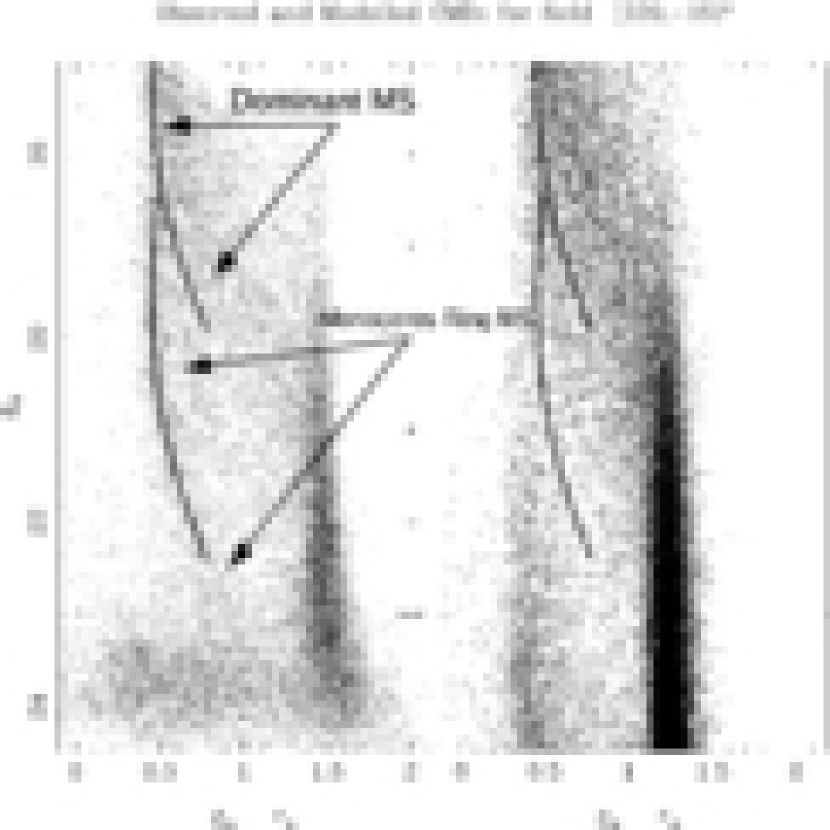
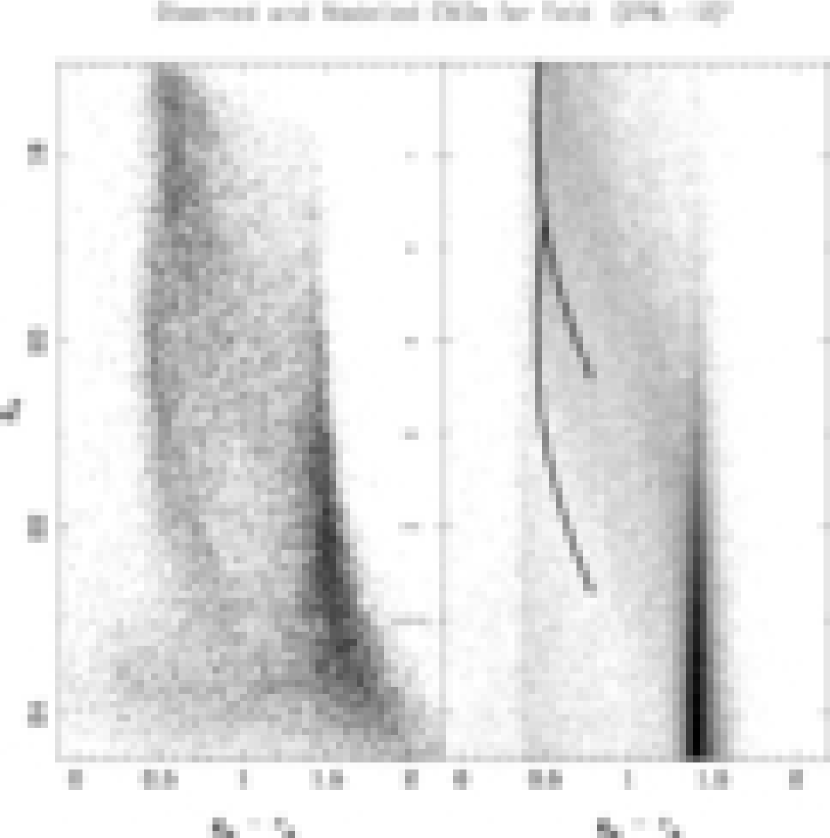
The location of each field is shown graphically in Figure 1. Each field presented in this section shows the CMDs with the appropriate fiducial sequence taken from the original Newberg et al. (2002) detection as described in the previous section. The CMDs that we have used are density maps of the underlying distribution with the square root of the number of stars per pixel being presented in all of the CMDs in this paper, called a Hess diagram. This method provides better contrast of the structures especially in high star density regions. In the following sections, the distance estimates to the major features present in each CMD are provided with an analysis of these results in the Discussion section. The principal features of the CMD have been identified by visual comparison with the Besançon model. The MRi Main Sequence is evident by its absence in the model and the CMa Main Sequence is inferred to be associated with the strongest Main Sequence in the CMD. The fiducial is then placed on the CMD and shifted in magnitude to be aligned “by-eye” with the respective features. A more accurate technique is unneccessary given the inherent uncertainties already present in a distance estimate of this kind. It is important to note that the fiducials placed on the dominant features of the CMD are not necessarily considered detections, but rather placed to provide insight into all the features present in the CMDs. For the dominant and strongest sequence in each CMD, only the fainter edge has been fit with the fiducial sequence providing a single distance estimate. For the fainter coherent sequences, both the upper and lower extremes have been fitted giving a range of distances to that structure, see Figure 5. The complete list of the magnitude offsets and distance estimates is contained in Table 3. The brighter, nearer or more dominant sequence has been listed under the heading MW/CMa (Milky Way/Canis Major) to illustrate that differentiating between the two is not straightforward when using CMDs. Although some fields are most likely to contain only Milky Way stars, there are several that are possibly a mix, or completely dominated by CMa stars. For this reason, this structure is left ambiguously identified in Table 3. The fainter, more distant or less dominant sequence is listed under the heading MRi. To understand the widths of the structures and hence an estimation of the errors for each field, this table should be referenced. The final structure of interest are the Blue Plume stars which are located around 18th magnitude and in the colour range () = 0.0 - 0.3. These stars can be seen clearly in Figure 10 and are discussed further in 6.2.2.
5.1 Monoceros Region
The four fields presented here are in close proximity to the original detections of the Monoceros Ring as presented in Newberg et al. (2002). Importantly, the present survey has sampled both sides of the plane, finding the MRi to be present across the Galactic plane. This has implications regarding whether the MRi could be a phenomena related to the Galactic warp and flare.
5.1.1 Fields at
This is the furthest field West from Canis Major (towards the anti-centre direction) that is included in this survey (Figure 6). Despite the good seeing and area covered in this field, many of the fainter stars have been lost due to the relative proximity of the Moon. This has removed a lot of the detail present in other fields of similar size. Using the fiducial sequence on the two main features in this CMD, we obtain two distance estimates. The first using an offset of 1.2 mag corresponding to a heliocentric distance of 6.3 kpc. The second more distant feature, somewhat more tentative, is found at an offset of 0.5 mag, or RHC 13.8 kpc. Given the lack of clarity regarding the potential Monoceros Ring feature in the data, no attempt has been made to measure the spread of distances over which it is visible. Indeed, it is uncertain whether this is simply the strong overdensity of stars seen at the faint blue end of the model CMD. The stars located at the faint blue end of the CMD are most likely misclassified galaxies and are unlikely to represent any real Galactic structure, they have a considerable error in colour as can be seen by the error bars on the right hand side of the panel. The 50% completeness in for this CMD is 22.4 mag.
5.1.2 Fields at
At the same Galactic longitude as the original Monoceros Ring detection made by Newberg et al. (2002), the CMD is presented in Figure 7. The two fiducials are offset by 1.5 mag for the brighter sequence and 0.0 mag for the fainter coherent sequence. These result in distance estimates of 5.5 kpc and 11.0 kpc respectively. The CMD is 50% complete at = 23.4 mag. Given the broad nature of the Milky Way sequence, only the distance to the lower boundary is stated. The S/N estimate for the MRi in this field is 34. This value is higher than expected, probably due to the close proximity of the dominant Main Sequence. The model does not cleanly subtract this feature and so some counts remain to boost the signal to noise estimate.
5.1.3 Fields at
As the Southern counterpart for the original Monoceros Ring detection made by Newberg et al. (2002), the CMD for (220,15)∘ is presented in Figure 8. The two fiducials are offset by 1.4 mag for the brighter stronger sequence and 0.2 mag for the fainter coherent sequence. These result in distance estimates of 5.8 kpc and 12.1 kpc respectively. At = 22.9 magnitudes, the CMD is 50% complete. The fainter sequence is found to have a S/N 32, although this estimate is probably contaminated by the nearby brighter Main Sequence.
5.1.4 Fields at
This field, Figure 9, is the closest to the original Monoceros Ring detection made by Newberg et al. (2002) taken during the present survey. The two fiducials are offset by 2.5 mag for the brighter stronger sequence and 0.0 mag for the fainter sequence. These result in distance estimates of 3.5 kpc and 11.0 kpc respectively. Being only five degrees from the fields presented in Newberg et al. (2002), the distance to the MRi here is the same as their distance estimate of 11 kpc. The 50% completeness in for this CMD is 23.6 mag. A S/N 14 is found for the fainter sequence.
5.2 Canis Major Region
The following fields are part of a strip of observations linking to . The fields from b = 6∘ to b = 4∘ are single pointings, while has four pointings filling out a 11∘ field and has two pointings. These observations provide a glimpse as to how the Galaxy profile changes across the Galactic plane. The high dust extinction of the lower Galactic latitudes has distorted the CMDs; however, there is still information in these fields and for this reason they have been left in. The dust is more prominent in the Southern fields as characterised by the lesser distortion of the CMDs in the Northern fields. All of the fields from b = 6∘ to b = 6∘ were observed under the same conditions with the field observed the following night.
5.2.1 Fields at
This field is centred on the location of the putative core of the Canis Major dwarf galaxy (Figure 10). The very strong sequence running the length of the CMD can be fit along the faint edge with a fiducial offset by 0.6 mag which corresponds to 8.3 kpc. Placing it roughly along the centre of the feature requires an offset of 0.9 mag or 7.6 kpc. In Conn et al. (2005b), the presence of the MRi in the background of the CMa overdensity was revealed. This was determined to be at a distance of 13.50.3 kpc. Indeed, just below the sequence dominating the CMD there does seem to be an excess of stars which may be another coherent sequence, its contrast is low due to the dominating effect of the CMa sequence. An offset of 0.4 mag is needed to align the fiducial with this feature, corresponding to a heliocentric distance of 13.2 kpc. Given the match this makes with the AAT/2dF detection this is considered a tentative detection. The CMD is 50% complete at = 23.6 mag.
5.2.2 Fields at
In Figure 11, the strong sequence is still present in this field although distorted by the increased level of dust and possible non-photometric conditions. The Blue-Plume stars (see 6.2.2) are still easily visible and while there is contention over their origins, they are still indicative that the general structures present here are unchanged from the previous field. Consisting of only one exposure, the 50% completeness level has not been calculated.
5.2.3 Fields at
This field (Figure 12), as with those closest to plane, is heavily affected by dust extinction. In particular, it has the second highest dust levels in our survey, where E(B-V) is typically around 0.99. Again, despite the loss of structure in this field, the CMD still shows evidence for a Blue Plume population although it appears a little weaker than the preceding (240,6)∘ field. The CMD has been left in the location as determined by the calibration process of the CASU pipeline. The high dust levels are the most likely cause for the distortion on the Main Sequences present in the CMD. No completeness estimate has been made for this field.
5.2.4 Fields at
The dust extinction in this field, Figure 13, is extremely high, typically around an E(B-V)1.1. There is a faint suggestion of the presence of Blue Plume stars, although less so than in the previous field. The strong sequence visible in this region of sky is still apparent. However, it is impossible to provide a distance estimate to this structure. The limiting magnitude of this field is most likely heavily affected by the dust accounting for its position with regard the CMDs in the remaining survey locations. As for the two previous fields, there is only one pointing in this direction and so no completeness estimate has been made.
5.2.5 Fields at
This field, Figure 14, begins to re-emerge from the dust problems below the plane, showing a strong sequence across the CMD. Unfortunately, due to the distortion effects of the dust, an estimate of the distance to this structure is still not possible. It is difficult to judge whether the sequence feature seen here is created by the same structure detected below the plane. The Blue Plume population is no longer present, which may indicate these are purely Galactic stars or that it has shifted to brighter magnitudes which are saturated in this survey. Continuing the strip of single pointings above the plane, this field also has no completeness estimate.
5.2.6 Fields at
Here the main components present in the CMD, Figure 15, can be fit with fiducials at magnitude offsets of 1.4 mag and 0.1 mag. The distances then to these features are 5.8 kpc and 11.5 kpc, heliocentric. This field with a single pointing has no completeness estimate.
5.2.7 Fields at
Consisting of four pointings, this field is the largest of the Canis Major region targets above the plane (Figure 16). The strong sequence here corresponds to a magnitude offset of 1.2 mag, or 6.3 kpc. With the lower sequence residing at 12.6 kpc or 0.3 mag of offset. A 50% completness in this CMD is found at = 24.0.
5.2.8 Fields at
Two pointings make up this field (Figure 17), and again two sequences are clearly visible in the CMD. The closer of the two is at 2.2 mag of offset, or 4.0 kpc. The more distant sequence is offset at 0.5 mag, or 13.8 kpc heliocentric. This field has a 50% completeness in at 22.65. The S/N of the fainter feature is estimated to be 22.
5.2.9 Fields at
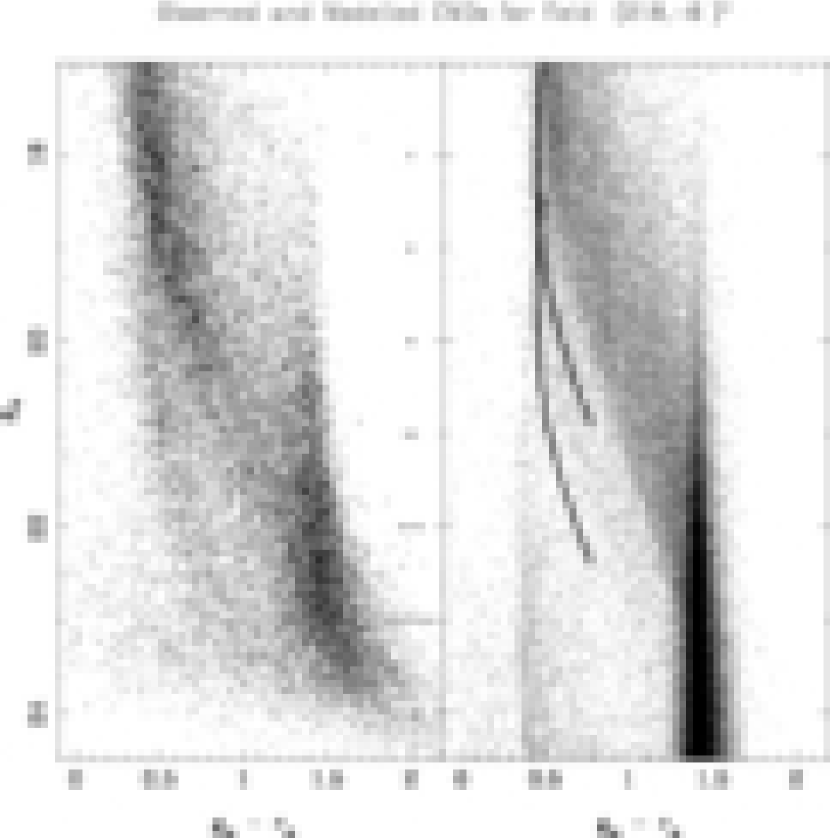
This field, presented in Figure 18, was chosen to probe the lateral extent of the Canis Major dwarf/overdensity. Being 5∘ East in Longitude, the dominant sequence in this region of sky is still very strong. The fiducial sequence has been fitted with an offset of 0.6 mag. This offset corresponds to a distance of 8.3 kpc. As with the field (240,9)∘, a fiducial closer to the centre of this feature is offset by 0.9 mag or 7.3 kpc. This value matches the distance to dwarf galaxy as reported by Martin et al. (2004b). A fiducial has been fitted to the faint MRi population just below the strong sequence. The offset of 0.5 mag corresponds to 13.8 kpc heliocentrically. At 23.3 magnitudes in , the CMD is 50% complete.
5.3 Maximum Warp region
The remaining fields in this part of the survey occupy the part of the Galaxy which is most affected by the Galactic warp. Due to predominantly poor weather, only three fields of this regions are presented. However, they do contain information regarding the Monoceros Ring and the Canis Major dwarf and also continue the Galactic plane survey into the fourth quadrant.
5.3.1 Fields at
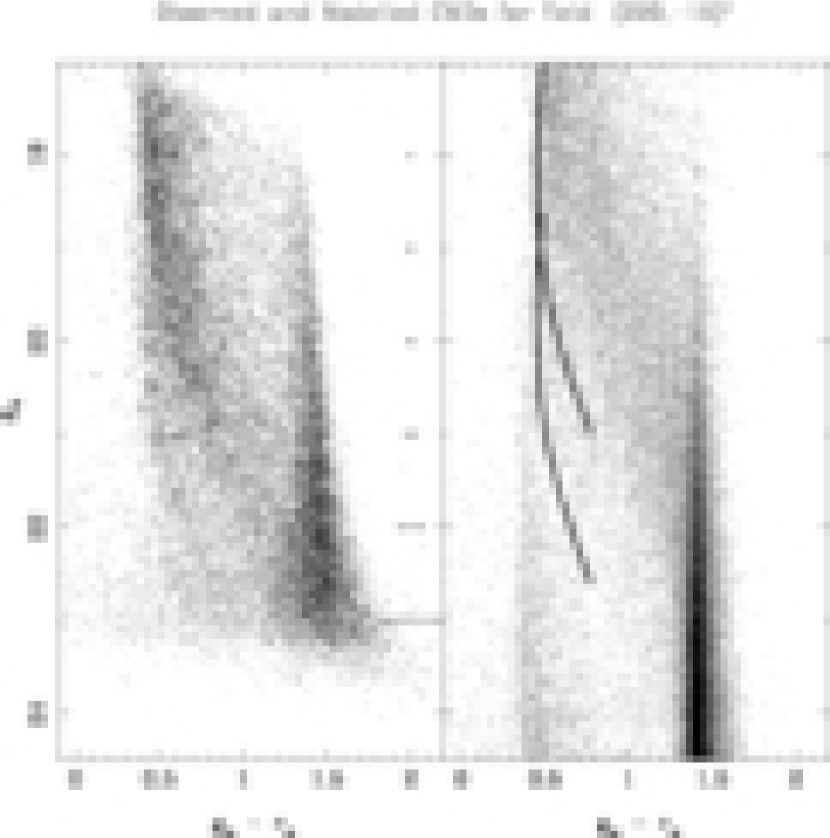
This field is located 20∘ from the Canis Major dwarf/overdensity and although the Blue Plume stars have maintained their location on the CMD, the strong sequence has shifted to fainter magnitudes (Figure 19). The fiducial sequence has been fitted with an offset of 0.3 mag. This offset corresponds to a distance of 9.6 kpc. There is no clear evidence of the MRi in this field, which would reside below the strong sequence close to the limiting magnitude of this data. The 50% completeness level in is found at 22.8 magnitudes for this field. Martin et al. (2006a) report on the detection of the MRi 12 degrees further in latitude from this field, in front of the Carina dwarf galaxy. This detection was made in velocity space and currently there is no firm estimate of the distance to the MRi at this longitude. Until observations in this region are extended to fainter magnitudes no detection of the MRi can be reported in this field.
5.3.2 Fields at
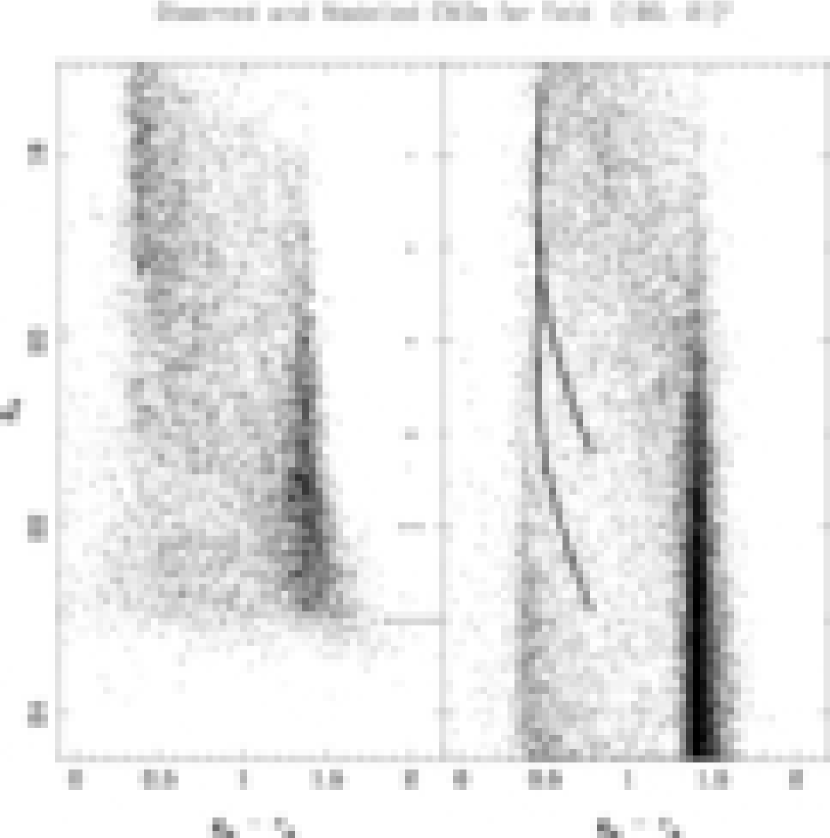
This field is at the same latitude as the Canis Major dwarf/overdensity and, as seen in the previous field, the strong sequence in this field has shifted to fainter magnitudes (Figure 20). The dominant sequence remains very strong and is fitted with a fiducial with an offset of 0.3 mag. This offset corresponds to a distance of 9.6 kpc. The CMD is 50% complete at = 23.4 mag. This field shows some distortion at its faintest extremes, most likely due to a combination of the levels of dust in the region and/or changing conditions during the observations. While the fiducial has been fitted to the data, it is clear that the distortion inhibits the ability to accurately locate the distance. Of most importance is the presence of the strong sequence in this field and the Blue Plume stars which reside in the same location as the fields at different longitudes.
5.3.3 Fields at
In Figure 21, the field shows clear evidence for the MRi. The fiducial sequence has been fitted to the MRi with an offset of 0.3 mag. This offset corresponds to a distance of 12.6 kpc. The Milky Way/Dominant sequence is found with a fiducials corresponding to 2.0 mag or 4.4 kpc heliocentric. This CMD is 50% complete at = 23.7 mag. The fainter sequence is estimated to have S/N 26.
6 Analysis & Discussion
This section discusses the detections of the Monoceros Ring and those in the Canis Major region. This is done separately as there is no consensus on either the origin of these structures or their connectedness.
6.1 The Monoceros Ring
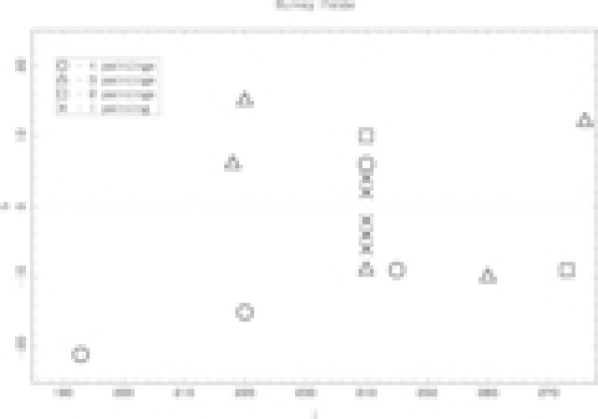
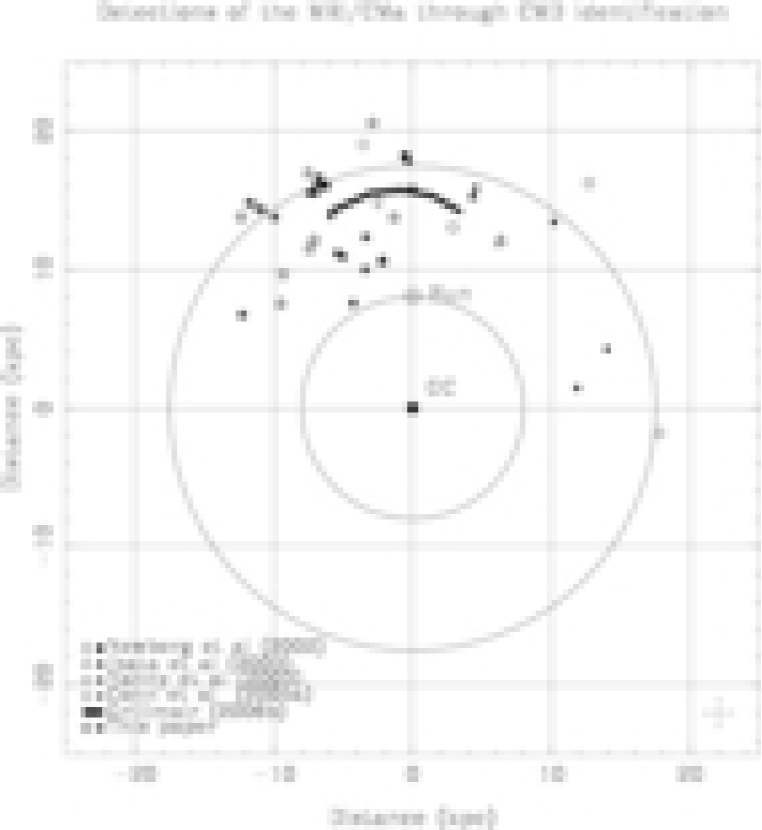
From this survey, we interpret the presence of apparent coherent sequences beyond the edge of the Thin/Thick disc as the Monoceros Ring. This results in 10 detections across the entire longitude range of this survey and on both sides of the Galactic plane. Importantly, these results show that the Monoceros Ring cannot be reproduced by a warped disc scenario leaving only the Galactic flare or a non-Galactic origin for these stars. Figure 22 shows all the previous MRi detections as projected onto the Galactic plane. The star symbols are the detections outlined in Table 3 and so those star symbols close to the Sun are MW/CMa sequence distances, while those further away are the MRi. Fields above the plane are filled symbols and those below the plane are empty symbols.
The circles at (61,15)∘ and (75,15)∘ from Conn et al. (2005a) are included here as detections. A review of these fields during the preparation of this paper has found them to be detections of the MRi. The previous use of the Besançon synthetic Galaxy model out to only 50 kpc introduced a turn-off in the Halo population near these MRi sequences. This added confusion to the identification of the MRi in these fields but increasing the model distance limits to 100 kpc removed this turn-off and showed these features to be truly MRi detections.
The previous detections of the Monoceros Ring from CMDs, seen in Figure 22, show the distance estimates do not form a neat coherent picture of the structure. Rather, there are many gaps between detections which limit our understanding of the overall shape of this feature. Our results seem to show a slight systematic preference for fields below the plane being further away than those above the plane. The fields above the plane from about l = (118 - 240)∘ do seem to maintain a consistent galactocentric distance of about 16 - 17 kpc. There are also a few detections below the plane which consistently fall outside of the 16 kpc circle.
The difficulty with Figure 22 is that while it distinguishes between those fields above and below the plane, it does not fully convey how far apart those fields truly are. For instance, in the l = 220∘ direction, the original detection by Newberg et al. (2002), the (218,6)∘ field and the (220,15)∘ reside at the same distance. The (220,15)∘ field with 30∘ of latitude between it and the Newberg et al. (2002) detection is found slightly further away at 12.1 kpc. This is same structure present on both sides of the plane and with no young stars forming part of the MRi it is unlikely to have been caused by perturbations within the Disc.
6.1.1 Can the Flare explain the Ring?
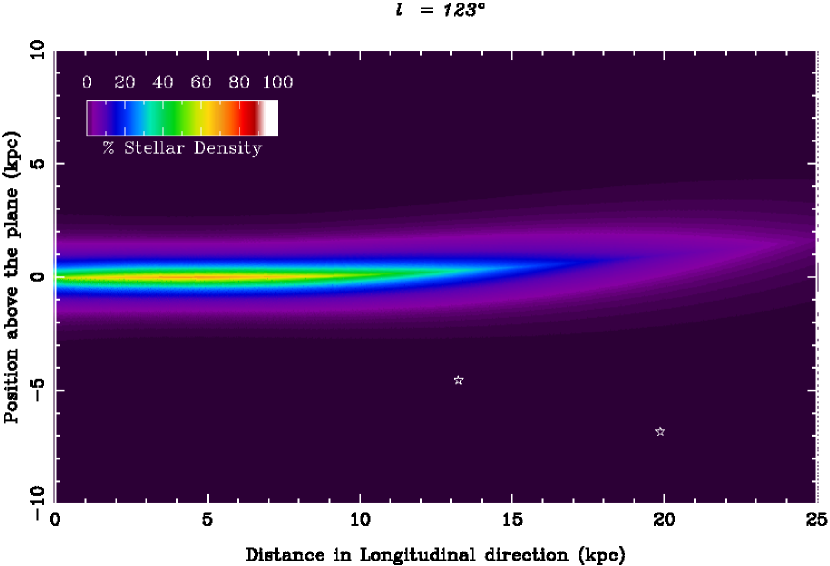
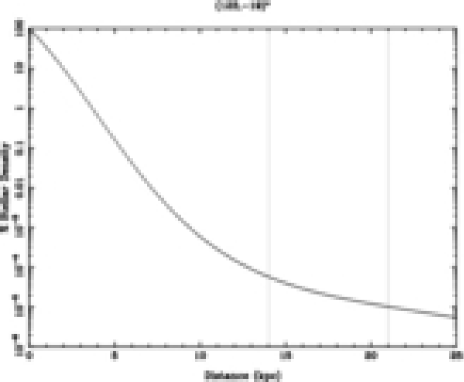
Momany et al. (2006) present a possible explanation for the existence of the Monoceros Ring in terms of the flaring of the Galactic disc. The Flare in the Disc is in addition to the Warp and represents a gradual widening of the Disc with increasing Galactic radii. They present several figures showing the location of the previous MRi detections, from both the Newberg et al. (2002) and Conn et al. (2005a), as intersecting the Flare in the Yusifov (2004) model. Figure 23 shows the Yusifov models’ prediction for the stellar density profile of the Galaxy in direction of l = 123∘, a field which contains two detections of the MRi in the same direction, namely b = 19∘. The Warp in this part of the Galaxy extends North as seen here and because of the Flare, the width of the Galaxy grows with increasing distance. The Sun is located at the origin. The stellar density can be seen to decrease in both the radial and the perpendicular directions. The distance estimates to the detections found in this field, from Conn et al. (2005a), are shown as stars. There is an error of at least 10% on their location, as explained in that paper, and in Figure 23, this error aligns itself with the line joining the location of the symbol and the origin. This figure clearly shows that density in the region of the detections is below 0.5% of the maximum stellar density in this direction. Attributing this feature to the Warp is not feasible since a warp would only produce a single smooth Main Sequence. The Flare also does not introduce any structures or boundaries of significance in the entire region and does not seem suitable for explaining the MRi in this direction. To investigate this further, Figure 24 shows the line of sight density profile for the (123,19)∘ field from the model. The two vertical lines are placed at the distances of the two detections. It is evident that the model does not show any increase in density with increasing distance from the Sun and that the Flare cannot explain the presence of the Monoceros Ring here.
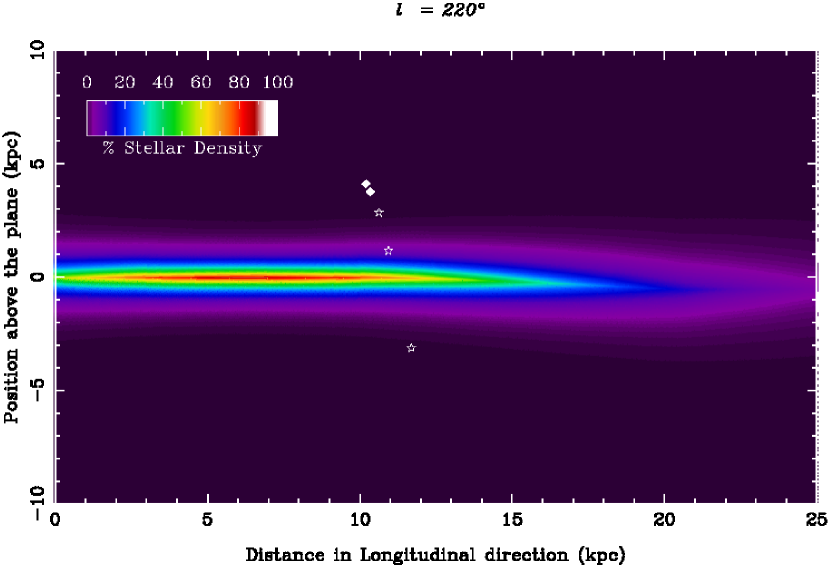
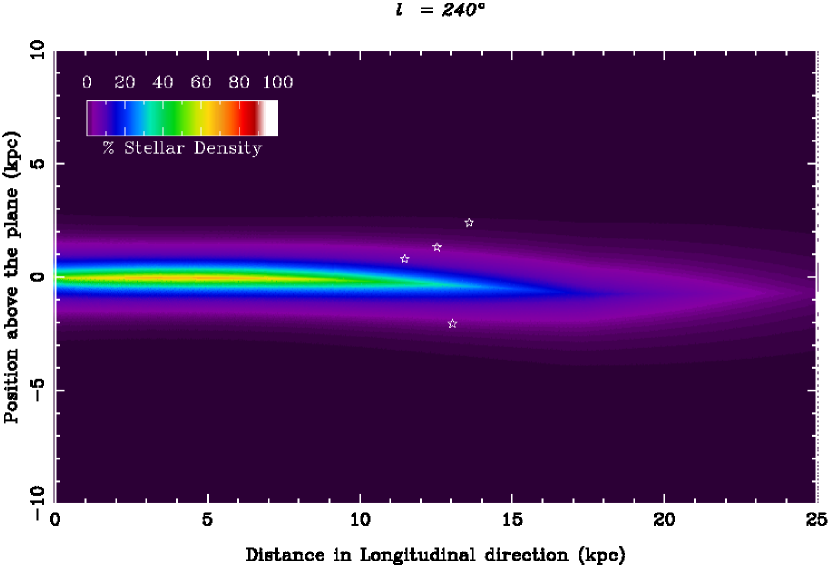
Two other regions of interest when interpreting the Monoceros Ring are at l = 220∘ and l = 240∘. In both cases, the MRi has been detected above and below the plane at the same longitude. The stellar density predictions from the Yusifov model are shown in Figures 25 & 26. In Figure 25, the diamond symbols are from Newberg et al. (2002), while the star symbols are from this paper and altogether they show that the MRi in this region is an extended vertical structure in the disc. Although it is unsure whether the detections on either side of the plane are of the same origin, the coincidence in their distances should be noted. It is also apparent that known Galactic structure is unable to account for an overdensity at this distance. Could the density profile seen in Figure 24 be peculiar to that direction? Figure 27 presents the line of sight density for all the detections seen in Figure 25. The two vertical lines delimit the minimum and maximum MRi distance estimates for these fields. Again, it can be seen that the stellar density profile is unable to reproduce an increase in stellar density which could explain the MRi. The MRi detections here are found within a variety of stellar densities and so neither the Warp or the Flare can be invoked to justify their presence. At l = 240∘, the Northern detections range from 11.5 kpc at (240,4)∘ to 13.8 kpc at (240,10)∘. Below the plane, the field (240,9)∘ is also found at 13.8 kpc which is consistent with the results of Conn et al. (2005b). While there is not the neat correlation between the Northern and Southern detections in this region, as with the l = 220∘ fields, it does confirm again that the smooth stellar density distributions are unable to account for the overdensity of stars contained in the MRi. The warped flared Milky Way does not contribute significantly at the locations of the MRi, as claimed by Momany et al. (2006).
There is no neat coherent picture of the MRi structure even considering the many detections of it, primarily due to relatively small areas of sky surveyed, combined with rough distance estimates. However, regardless of this, the Galactic flare is not a likely source for this overdensity of stars. And while this has only been tested on the Yusifov model, the similarities between the various models make it unlikely that any of them will be able to generate a significant overdensity of stars at the distances found in the data. Additionally, even the possibility of it being a distant spiral arm, is countered by the vertical extent of the MRi out of the plane. For those dissatisfied with a tidal stream origin for the MRi, other mechanisms will have to be invoked. In the meantime, the best explanation is a tidal stream scenario and so given that, where then is the progenitor?
6.2 The Canis Major Dwarf
The existence of the Canis Major Dwarf is debated by Carraro et al. (2005), Moitinho et al. (2006), Momany et al. (2006) and López-Corredoira (2006), who propose either a new warp or spiral arm scenario to explain the presence of the overdensity in this region. While all the issues raised in these papers cannot be addressed here, some qualitative comparisons can provide further insight into this debate.
6.2.1 Warp or Dwarf?
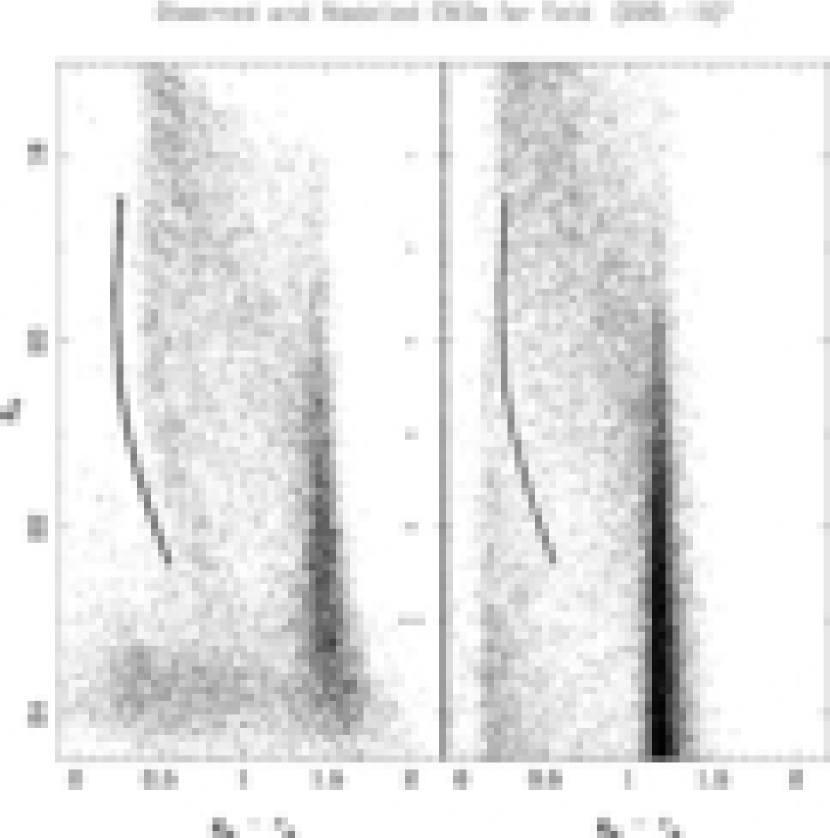
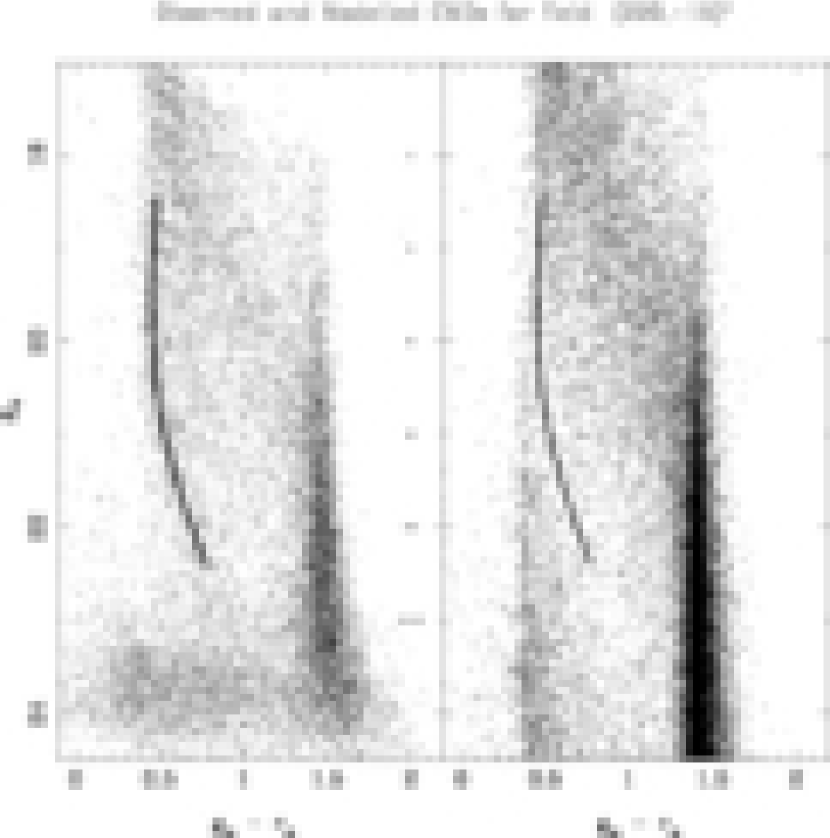
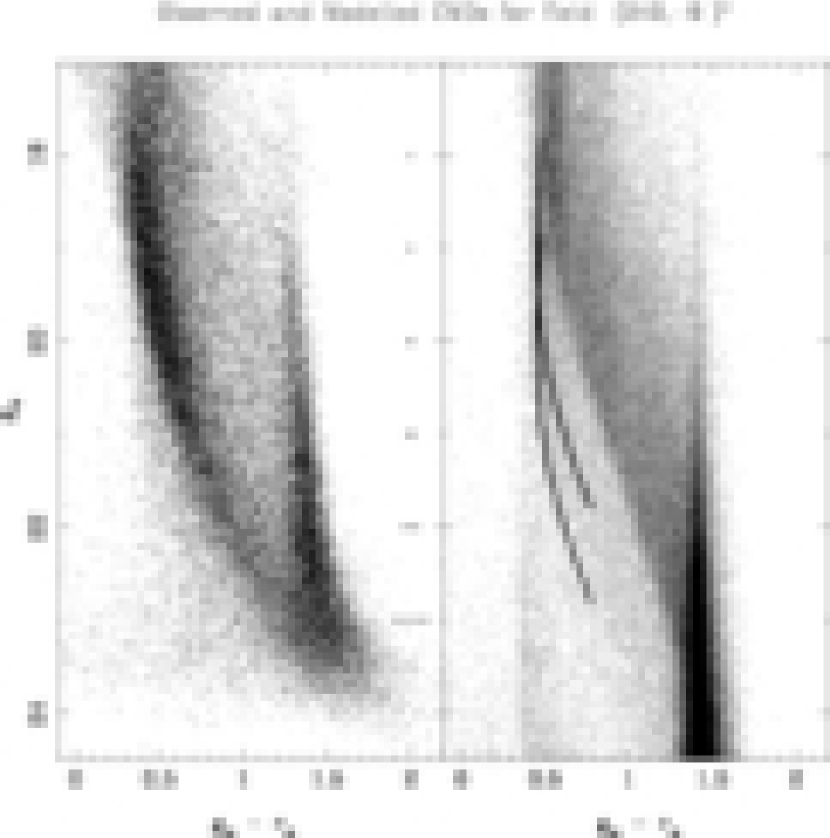
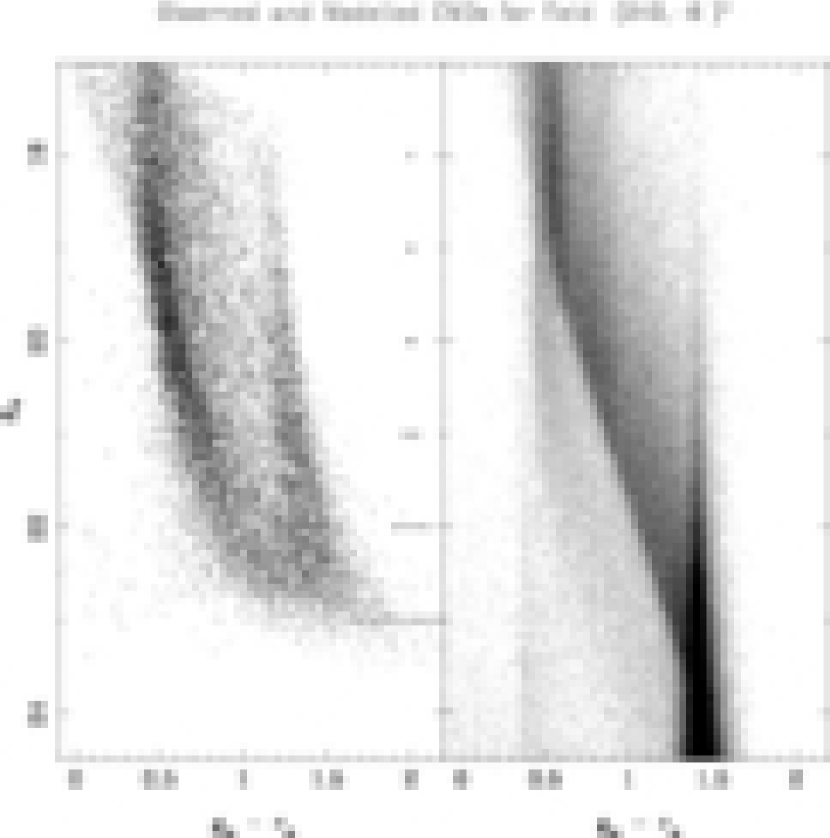
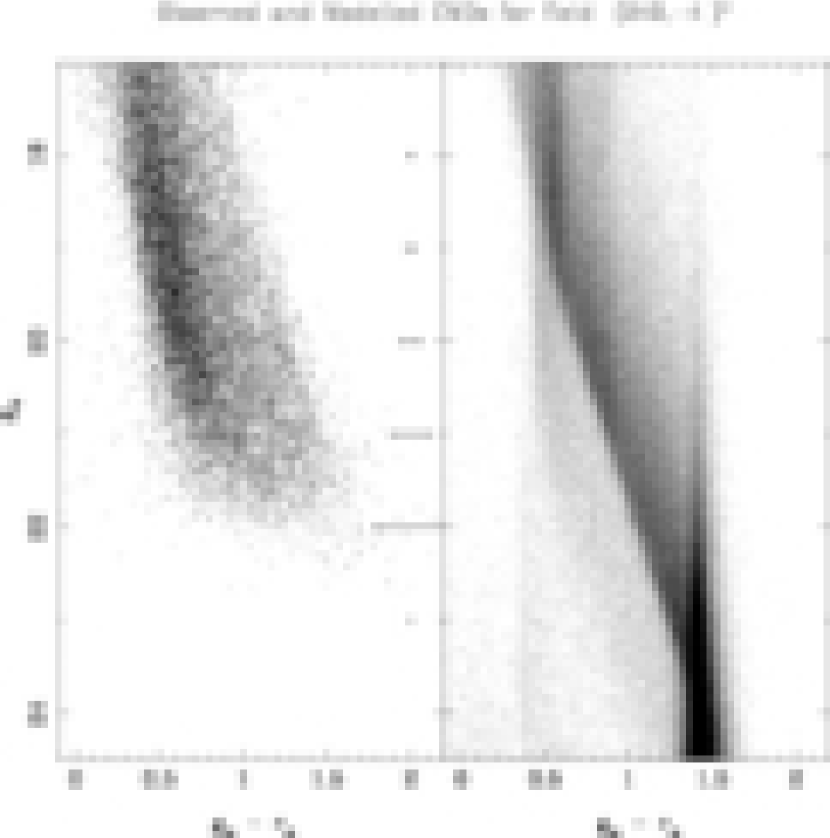
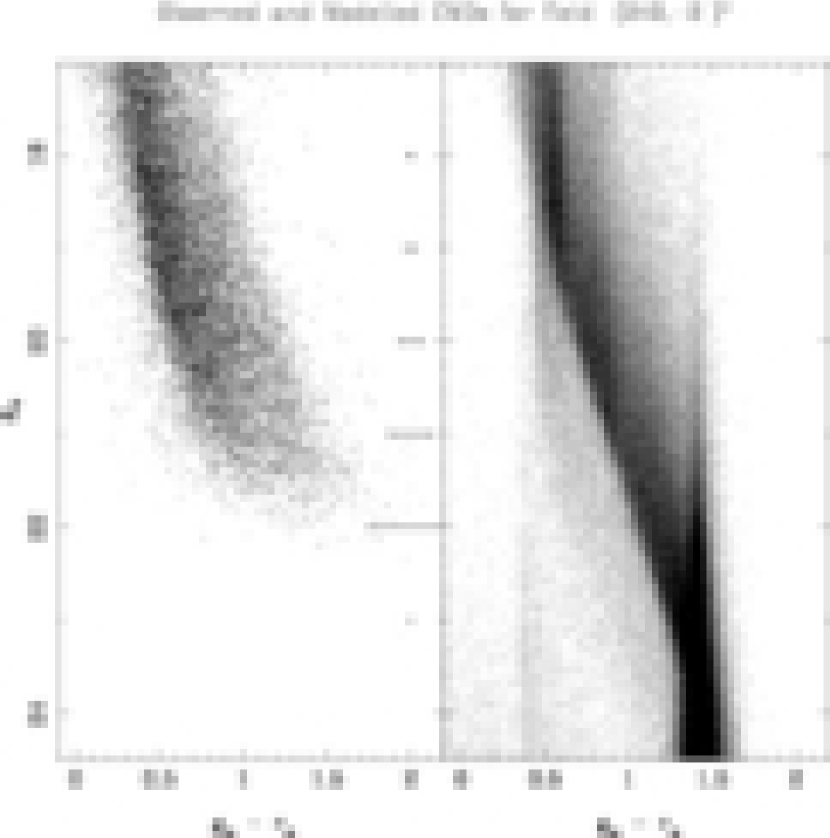
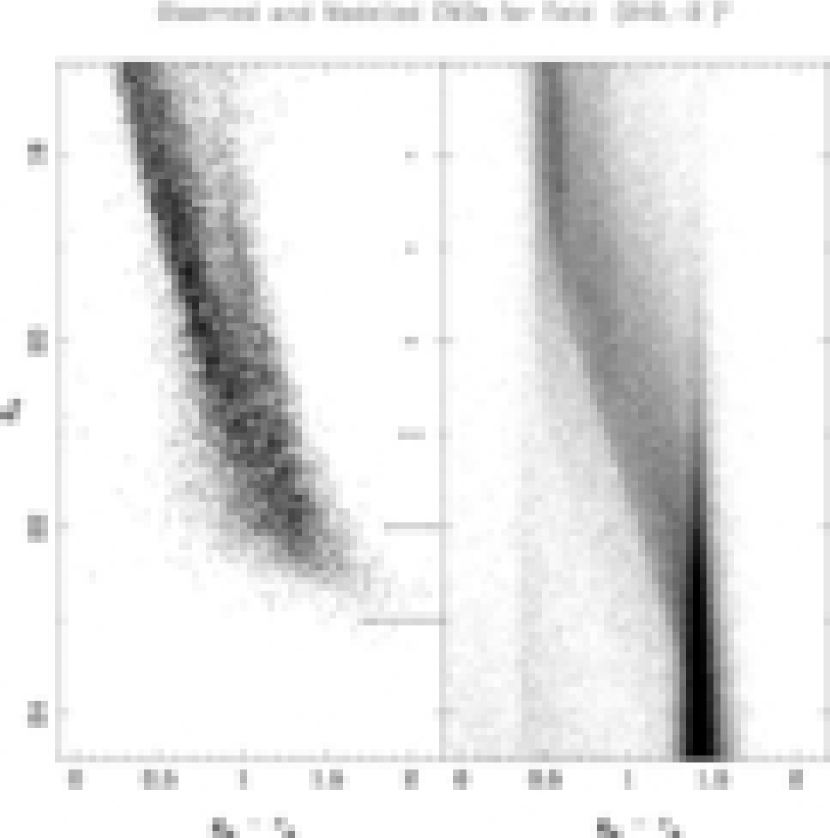
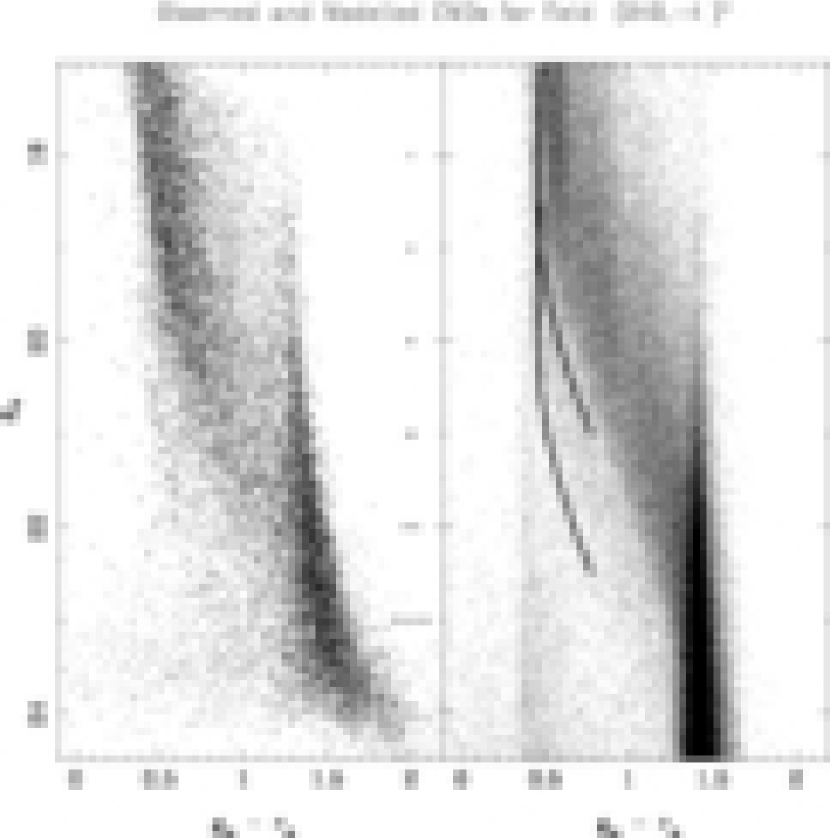
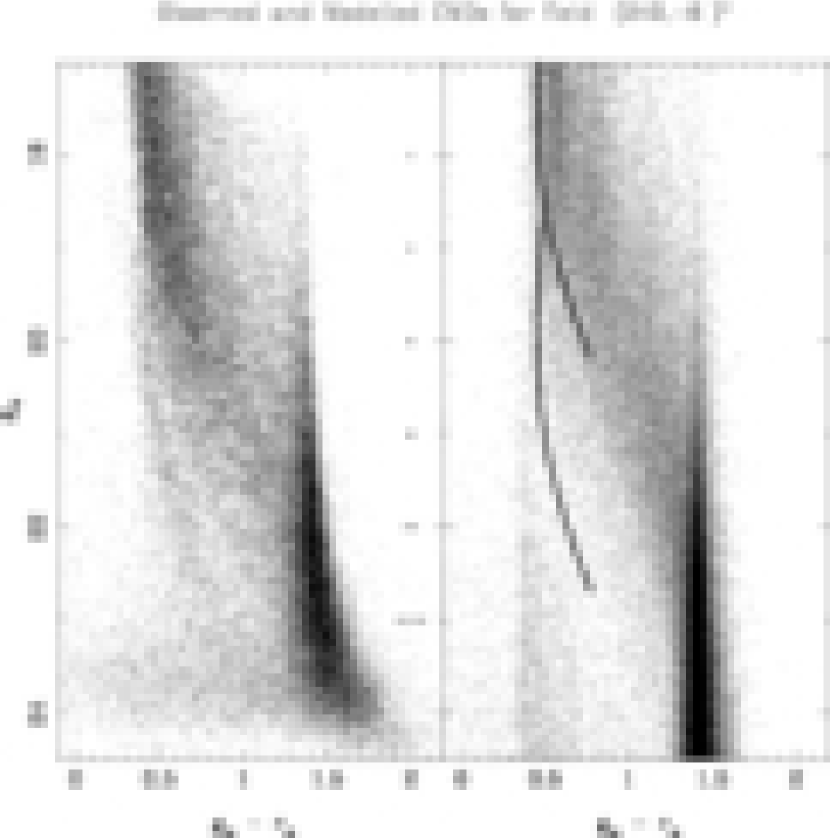
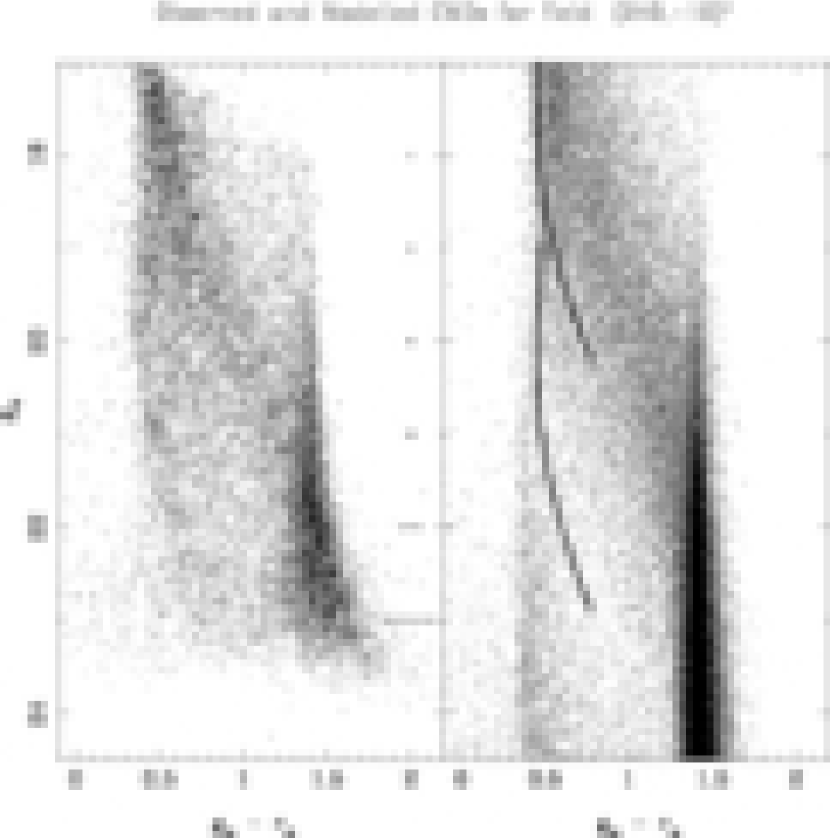
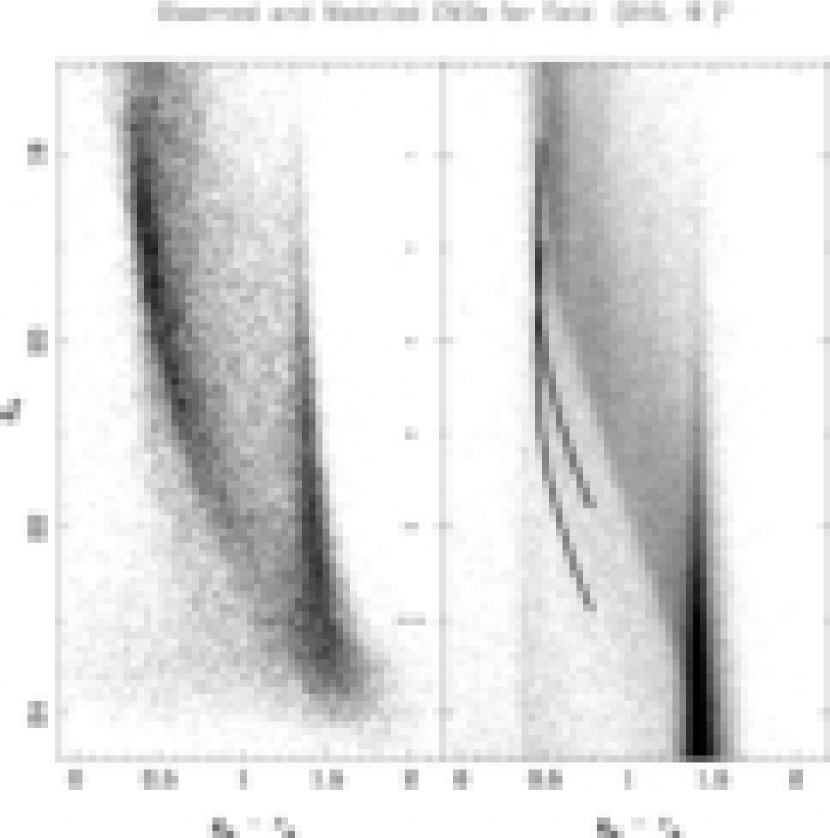
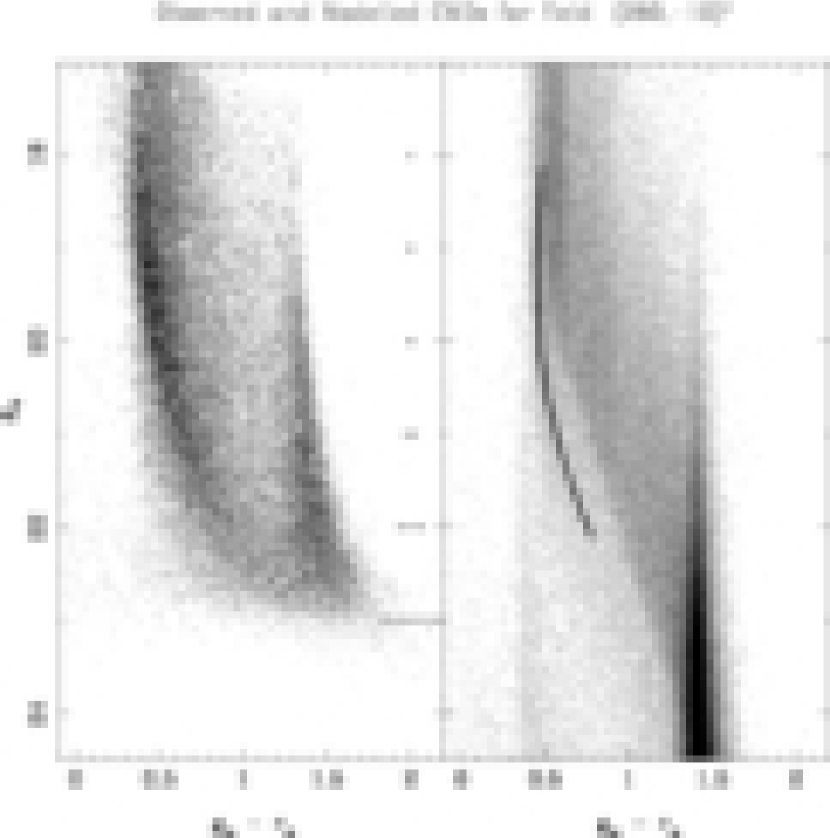
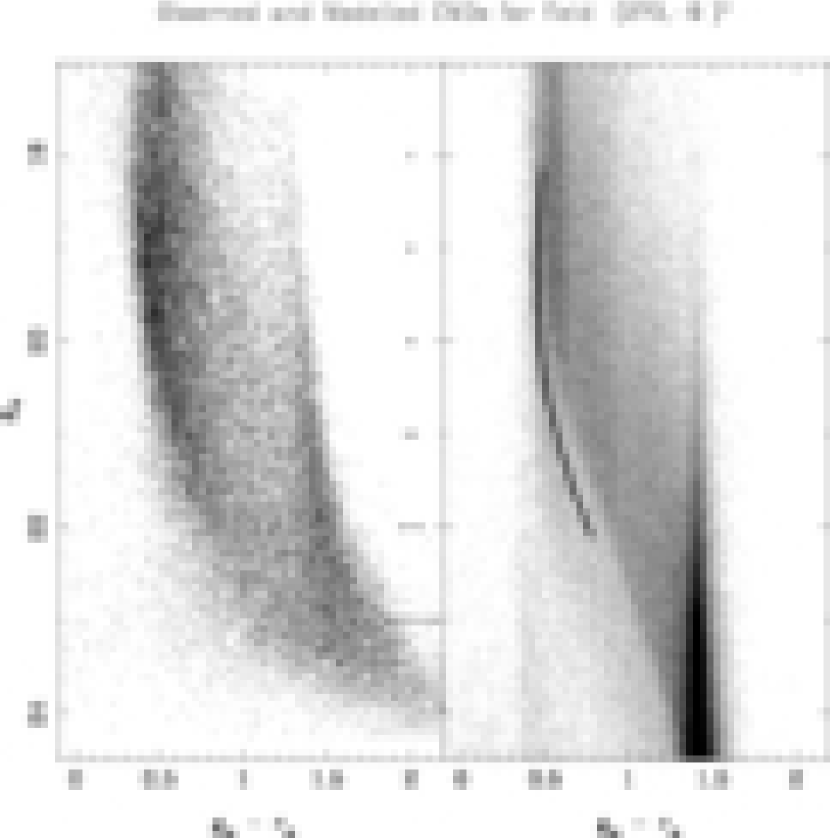
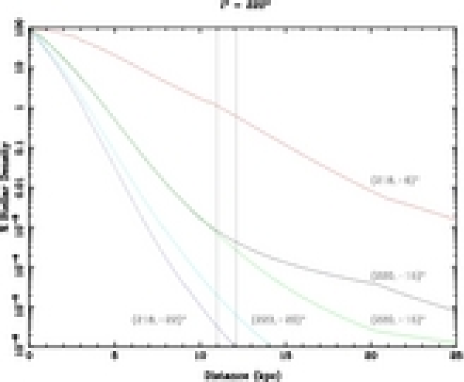
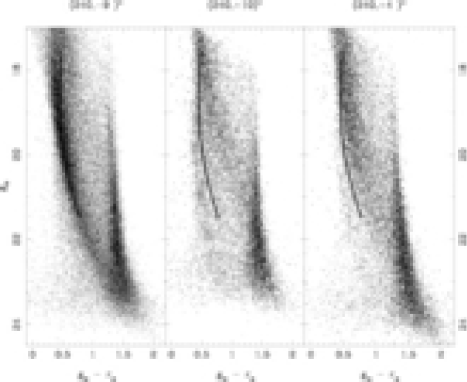
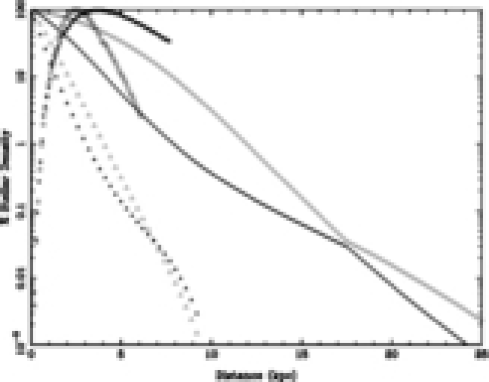
The primary source of doubt over the presence of the dwarf galaxy is whether a warp in the disc of the Galaxy is sufficient to explain the overdensity of M giant stars as reported in Martin et al. (2004a). The warp in the Galaxy has been known for a long time and was primarily described through observations of the gas disc, as presented in Burton (1988). Tracing the warp through the stellar populations is more difficult, as only certain types of stars have reliable distance estimate techniques. Yusifov (2004) exploits the pulsar distribution around the Galaxy, while López-Corredoira et al. (2002) uses the 2MASS catalogue to trace the warp with the old stellar population (giant stars & Red clump stars). The basis of these studies is the assumption that the Galaxy is essentially symmetric above and below the plane. Following the path of the symmetry reveals the warp in the disc and its deviation from the b = 0∘ plane. Momany et al. (2006) also employs the 2MASS catalogue using the raw counts of Red Giant Branch and Red clump stars above and below the plane to trace the warp. They argue their result shows the mid-plane of the disc is shifted by 3∘ below the plane in the direction of the Canis Major overdensity at l240∘. This result does not elucidate how they account for the presence of dust around the Galaxy and stars at all latitudes and reddening are included. Although this presents a potential flaw in their argument, we can nonetheless proceed to examine the data in light of their claims. The survey presented here contains a strip of observations at l240∘, which provide an excellent opportunity to try to understand the stellar populations of this region. Given that all of the warp models rely solely on symmetric stellar populations around the plane to derive the warp, this can be used to interpret the CMDs presented here. If we consider the field at (l,b) = (240,9)∘ as our basis for the warp/dwarf problem, then, by symmetry, there should be a field which is similar on the Northern side of the plane. Figure 28 shows three CMDs from the strip of observations at l240∘ chosen to aid our understanding. The field on the left is the observation at (l,b) = (240,9)∘, the centre is (240,10)∘ and the right CMD is (240,4)∘. Overlaid on each of the CMDs is the fiducial sequence from Newberg et al. (2002) used in the previous sections. It is placed at a magnitude offset corresponding to 7.3 kpc and serves as a reference point for all the stars at that distance. If the Galaxy had no warp, then the b = 9∘ and b = 10∘ fields should be, by symmetry, almost identical. Clearly, both the strength and location of the dominant Main Sequence feature in the South is unmatched in the North. This supports the presence of the warp in this part of the Galaxy. Momany et al. (2006) find the mid-plane of the Galaxy to be offset by 3∘ below the plane at l240∘. This implies that the proper corresponding field to compare the (240,9)∘ field is not (240,10)∘, but rather (240,3)∘. Unfortunately, this survey does not include a field in this location and so the (240,4)∘ is shown instead. The (240,2)∘ could also be considered but is affected by too much extinction to be useful in this comparison. Again, the Southern field contains many more stars along the entire length of the dominant sequence than its Northern counterpart, showing that the symmetry argument is unsuitable for this field. Therefore, the warp is not an adequate explanation for the CMa overdensity. This simple test reveals that these fields are not symmetric around the warped plane. The reasons for supporting the presence of the dwarf galaxy is not to merely substitute it for the warp, but rather to show that there are more stars in this location than can simply be explained by adjusting the warp in the Galactic disc. Comparing the predictions of each model for the fields (l,b) = (240,9)∘ and (240,4)∘, Figure 29 shows the stellar density profiles as predicted by the Yusifov (2004) model, the López-Corredoira et al. (2002) model and the Besançon model. The Besançon model’s prediction is generated via the histogram of star counts taken from the same data source as the comparison fields generated in Figures 10 and 15. The abrupt cut-off in the Besançon model is from only selecting the thin disc stars in this analysis. The other two models are generated via the density equations presented in their respective papers (López-Corredoira et al., 2002; Yusifov, 2004). Figure 29 clearly shows that none of the models predict any rise in stellar density at the 7.3 kpc distance of the CMa overdensity. Only the Besançon model shows a rolling over of the stellar density at 5 kpc for the Southern field and 3 kpc for the Northern field. This does favour higher stellar densities in the South but comparisons with the model, as in Figure 10, show that there is a clear discrepancy between the model and the data. Although the López-Corredoira et al. (2002) model maintains roughly the same stellar density profile in both hemispheres, at only 5 % of the maximum stellar density in that direction the density is far too low at the distance of the dwarf to account for the number of stars seen there. The Yusifov (2004) model with different warp parameters predicts more stars in the North than in the South as seen in Figure 29 at b = +4∘ and -9∘.
The AAT/WFI data presented here does suggest that there is an overdensity of stars below the plane at l = 240∘, which is still unexplained by the latest warp models. Although the Besançon model can be criticised for introducing a thin disc cut-off and not having the latest estimations of the warp and flare, it does attempt to model the entire set of properties considered to be part of the Galaxy. New parameters of the warp and flare need to be incorporated into the entire picture of the Galaxy to be truly useful when presented with actual data. These additional stars are unexpected in a mostly symmetric Galaxy, but whether they belong to a dwarf galaxy or not is difficult to tell. It is certain though that the standard Galaxy model is inadequate and that a dwarf galaxy could introduce a strong sequence as seen in the CMa region.
6.2.2 The Blue Plume Star Problem
Investigating the presence of the Blue Plume (BP) stars in the region of the CMa overdensity has unveiled an interesting problem. The BP stars can be seen in Figure 10 around 18th magnitude and in the colour range () = 0.0 - 0.3, however around 0.3 there will be some contamination from Main Sequence stars. Recently these stars have been connected with the Disc, the CMa dwarf galaxy and a distant spiral arm. So to which structure do the BP stars belong? The following section will present the arguments for both sides and conclude with a possible course of action to resolve this problem.
The evidence in favour of the dwarf galaxy has relied on the presence of BP stars in the CMa CMDs. Figure 1 from Martínez-Delgado et al. (2005a) has illustrated that a model dwarf galaxy CMD could be consistent with these stars being part of the dwarf galaxy. More recently Butler et al. (2006) has shown that the BP stars follow a different distribution, more confined to the Galactic Plane, than the Red Clump stars which were used to identify the CMa overdensity. However, as proposed by Carraro et al. (2005) and Moitinho et al. (2006), these stars might be associated with a much more distant structure, an outer spiral arm. The present survey, consisting of only two filters, is unable to confirm the distance estimates of these previous studies, but using the large range of longitudes available it can highlight where the BP stars are visible.
Examination of the data reveals one possible solution to the BP star problem. The BP stars are clearly visible in the two most important fields of the CMa overdensity: (240,9)∘ as shown in Figure 10 and (245,9)∘ in Figure 18. Close inspection of the other fields show that in fact all the fields at l 240∘ below the plane have a BP population. Interestingly, none of the fields above the plane show any evidence of BP stars and those fields below the plane at l = (193 - 220)∘ also have no BP stars. So the BP stars in the present survey are visible solely below the plane and at l 220∘. Although, the fields l = (193 - 220)∘ may be too far out of the plane for the BP stars to be seen. This is not an issue for the Northern fields, as the Disc is sampled at several latitudes and the BP stars are not present. The only information provided by the present survey on the BP stars is the magnitude at which they are located on the CMD and the direction in which they were observed. A direct measurement of their distance is not possible, but since the distance to the sequences in the CMD can be estimated via fitting of the fiducial, a qualitative approach to the BP distance can be made. The first problem with the BP stars arises here. In each of the AAT/WFI fields containing BP stars, the magnitude at which they are seen is almost constant. Indeed, while the main components of the CMD become fainter with increasing longitude, these stars maintain the same brightness levels. It can be concluded then that these stars are not associated with the strong sequences seen in the CMDs and in turn are not associated with the dwarf galaxy.
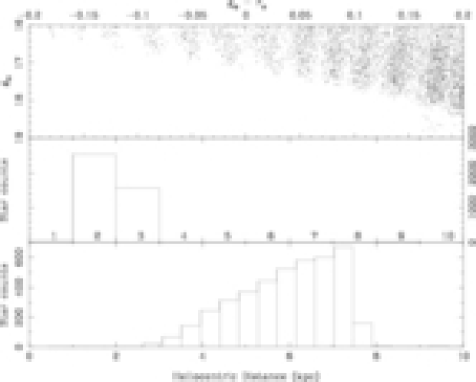
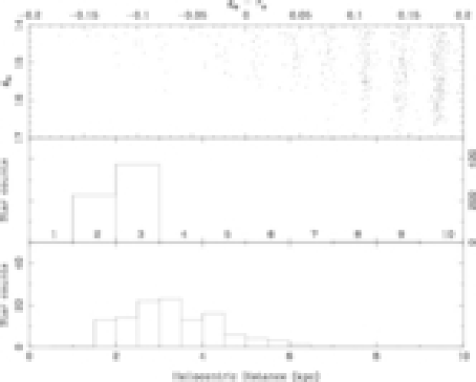
The Besançon comparison fields of (240,6)∘, (240,4)∘ and (240,2)∘ (Figures 11, 12 and 13) also contain a BP population at a magnitude comparable with those seen in the data; perhaps then this is not the detection of a new structure, but rather an accepted component of the Galaxy. A breakdown of the BP stars in the Besançon model provides some insight into their origins (see the analysis of the field at ()()∘ in Figure 30). The “Age” of the star in Figure 30 indicates whether it belongs to the Thin disc, Thick disc, Bulge or Halo. An Age of 1 - 7 corresponds to Thin disc stars, Age 8 - Thick disc, Age 9 - Halo and Age 10 - Bulge. The majority of the stars seen in the BP region are of Ages 2 or 3, which is comparable to a population 0.15 - 1 Gyr old for Age 2 and 1 - 2 Gyr old for Age 3. While many BP stars are local, out of the 4100 stars plotted here in this colour-magnitude range, the distribution peaks at 7 kpc and drops rapidly to zero by 8 kpc. This is due to cutting through the Thin disc in this direction. The missing BP stars in the Northern fields of the survey can be explained by the Besançon model shown in Figure 31. Here, at (l,b) = (240,4)∘, the BP stars are found in a magnitude range too bright to be observed at this location, as seen in the data from the present survey. The number of BP stars in this field is approximately a factor of 10 times fewer than those of its Southern counterpart. The modelled Northern BP stars are also significantly closer at only 3 kpc. Both the paucity of BP stars and their proximity lead to the conclusion that these stars belong to the local Disc. With the Disc being warped, the line-of-sight for the Northern field exits the Disc earlier, reducing the numbers of BP stars visible. It also ensures the population appears closer; the reverse is true for the South. So when taking into account the predictions of the model, a plausible explanation for the BP stars being part of the Disc is found.
6.2.3 Spiral Arms
It has been conjectured that both the MRi and CMa overdensities can be regarded as part of normal Galactic structure [see Carraro et al. (2005) and Moitinho et al. (2006)]. The MRi is considered to be an extension of the flare into higher latitudes (Momany et al., 2006) and the CMa overdensity a line-of-sight effect close to the maximum Galactic warp (López-Corredoira, 2006). To investigate how well the detections of both these structures align with the spiral arms, we have overlaid their locations on Figure 3 of McClure-Griffiths et al. (2004) as shown in Figure 32. The results of that paper have now been extended in Levine et al. (2006) revealing the presence of distant gaseous spiral arms out to 25 kpc. Figure 32 consists of a modelled grayscale density map of the differential HI distribution with the spiral arm models of Cordes & Lazio (2002), over-plotted as solid red (gray) lines. On this, the locations of the MRi and putative CMa detections have been included in the same manner as Figure 22.
Do the locations of the MRi detections suggest that it is part of a distant spiral arm? Most of the MRi detections do not seem to correlate with any of the nearby spiral arm locations, with the exception of the Grillmair (2006b) which is the result of the distance estimate of 8.90.2 kpc, however, the Grillmair (2006b) portion of the stream outlined here is found between b = (17 - 38)∘, well above the plane. The remaining points almost seem to align with the gaps between spiral arms more strongly than with the spiral arms themselves. The fields in the first quadrant at l = 61∘ and 75∘ are both close to spiral arm overdensities. The difficulty with connecting them to spiral arms is that the Northern fields reside at b = 15∘, and both are at about 15 kpc from the Sun. This places them around 3.7 kpc out of the plane, well outside the warped flared regions in this direction. The field below the plane at (l,b) = (61,15)∘ is at 5.4 kpc out of the non-warped plane and so is further from the plane when considering the effect of the Northern warp. The detection at (l,b) = (118,16)∘ is 3.3 kpc out of the non-warped plane and is again beyond the warped flared disc of the Galaxy. Continuing on around the Galactic plane, the fields at l = 123∘ have been discussed in 6.1.1 and the remaining MRi detections from the various other authors all typically lie between b = (20 - 30)∘ and cannot be associated with a warped and flared Disc. For the MRi at least, any alignment with the spiral arms appears purely coincidental, as the density profiles of the Disc do not allow for such overdensities to reside well above the Plane.
Do the CMa locations follow the spiral arm? The CMa overdensity fields can be seen as the nearby open star symbols from l = (220 - 273)∘ in Figure 32. The CMa fields are certainly close to the spiral arm, but are the progressively shorter distance estimates to these detections a statistical effect related to the distance estimation technique or does it represent a real change in direction for the overdensity? If the field at (l,b) = (193,21)∘ is part of the overdensity, then CMa would be seen as an addition to the Disc component. This is because the location of the dominant sequence in that field is further below the plane than is expected. At 5.8 kpc from the Sun, it is 2.1 kpc below the plane, much further than the 1.0 kpc predicted by the Besançon synthetic Galaxy model. If this is not an isolated overdensity of stars, then perhaps it is the CMa overdensity extended to these longitudes. Disentangling the CMa overdensity from the Disc is not simple, but fields contained in the present survey suggest that a pure warp scenario and hence a spiral arm theory cannot explain all of the observations. Indeed spiral arms seem not to be an identifiable feature within the CMDs. The INT/WFC fields at (l,b) = (61,15)∘ cross 2 - 3 spiral arms and there is no distinguishable sign of these features in the CMDs. The spiral arms are not visible in the old Main Sequence stellar populations which are used to characterise both the MRi and CMa detections. The overdensity in CMa therefore cannot be considered a “normal” or additional spiral arm. A more detailed study of this region is imperative to resolve all these issues.
6.2.4 The Canis Major Stream
Given the interest in the Monoceros Stream and the subsequent proposal of a dwarf galaxy in Canis Major, it seems obvious to ask where the immediate tidal tails of the dwarf are to be found. The presence of an obvious tidal feature associated with the overdensity would strengthen the idea that it is a dwarf galaxy. To date, there have only been two simulations of the MRi/CMa system. The simulation from Martin et al. (2005a) uses kinematics of the CMa overdensity as constraints on the model, while Peñarrubia et al. (2005) constructs their simulation with data from the MRi. Although both simulations predict the progenitor to be in the Canis Major region, only the Martin et al. (2005a) simulation places it in its currently accepted location. Given that this was the criteria for the Martin et al. (2005a) model this result is unsurprising but searching for the CMa stream with the Peñarrubia et al. (2005) model is not feasible given it does not coincide with current observations. The following discussion will focus on the distance estimates to both the MRi sequence in the various fields and also to the distance of the dominant Main Sequence in the CMDs. It is important to understand though that the dominant sequence could be either a pure Disc population, a pure CMa population or a mixture of both and although distinguishing between them is not possible the result is compared with the Martin et al. (2005a) model.
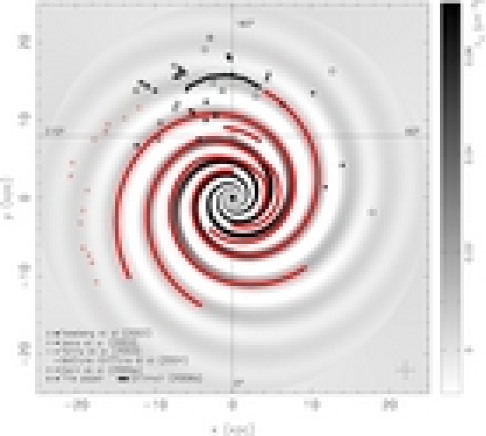
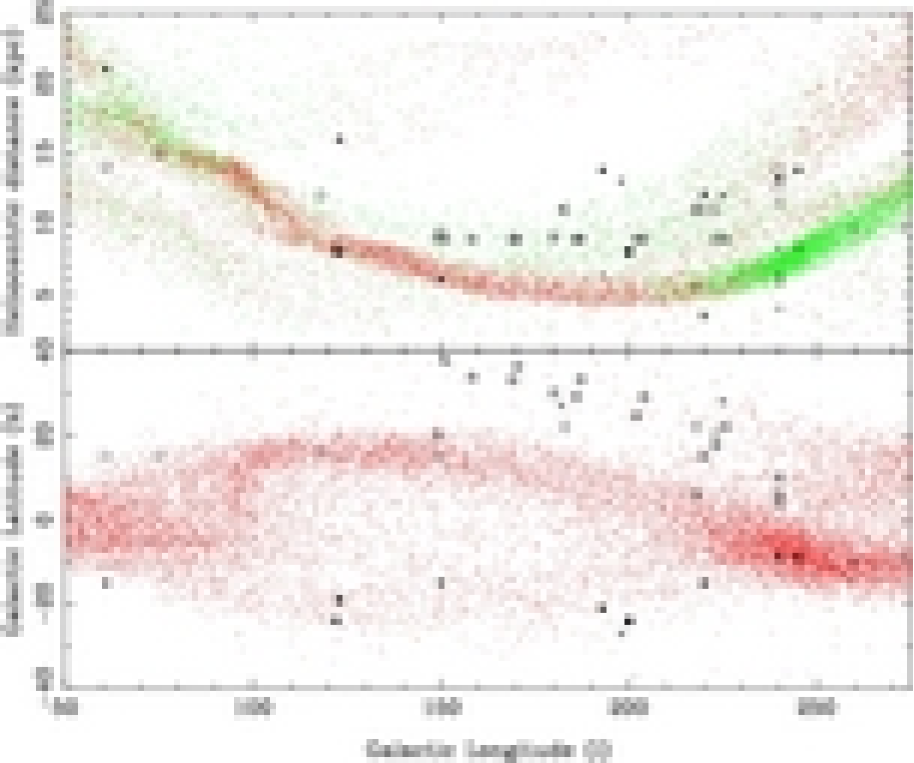
Figure 33 shows the results of the numerical simulation of Martin et al. (2005a) with the locations of the currently known detections of both the MRi and CMa. This is an extension of Figure 20 as seen in Bellazzini et al. (2007). Firstly, it should be noted that the CMa dwarf galaxy is located at (l,b) (240,-9)∘, as can be seen in the overdensity of points in that location (lower panel) with the CMa stream arcing into the northern hemisphere around l = 200∘. The top panel shows the heliocentric distance to the points, with those below the plane in red and those above in green. CMa is located at its accepted distance of 7 kpc. The other symbols are described in the Figure caption. A key feature of the Martin et al. (2005a) and Peñarrubia et al. (2005) models is that the MRi is simply a wrapped tidal arm of the CMa accretion event. In this manner, the structures described within Newberg et al. (2002), Yanny et al. (2003), Ibata et al. (2003) and Grillmair (2006b) conform to this idea of sampling a wrapped tidal arm. Their detections are in general more distant and less dense than the immediate CMa stream as predicted by the Martin et al. (2005a) model. Some observations in both the present paper and Conn et al. (2005a) do seem to coincide with the predicted spatial location of the CMa stream on the sky.555Bellazzini et al. (2007) contains additional observations, not included here, which also intersect with the predicted location of the CMa stream. In particular, the fields at () = (118,+16)∘, (150,+15)∘, (218,+6)∘, (260,-10)∘ and (273,-9)∘ are located within the modelled CMa stream as it is seen on the sky (lower panel). Indeed, when considering the distance estimates to the features in those fields there is a good correspondence with the predictions of the model. In the fields at () = (118,+16)∘ and (150,+15)∘, the features are only a few kpc more distant than the model but it is only constrained in the CMa region, so this difference is not unexpected. At () = (218,+6)∘, the distance estimate to the CMa/Disc feature is consistent with the model predictions, as is also the case for the () = (260,-10)∘ field; the () = (273,-9)∘ detection is found on the edge of the predicted distance estimate of the stream. For those fields in the CMa region, an interesting interpretation can be made. The detections below the plane (crosses) seem to demarcate the far edge of the dwarf, while the detections above the plane (plus signs) demarcate the near side. This can be seen in the location of these detections in the top panel. Could this be inferring the orientation of the dwarf?
Although this rudimentary coincidence of the observations of the MRi/CMa fields with the Martin et al. (2005a) model does not validate this model. It does suggest that previous observations termed MRi detections could be reinterpreted as CMa stream detections. In particular, both the () = (118,+16)∘ and (150,+15)∘ fields from Conn et al. (2005a) would fit this new scenario. The fields from the present paper which align with the CMa stream also support this conclusion. Unfortunately, there are too few observations between l = (100 - 180)∘ to further test the model in these regions. With the CMa stream predicted to be relatively nearby, testing these predictions at latitudes around b = 20∘ should be fairly straightforward.
7 Conclusion
The survey presented here consists of 16 fields from l = (193 - 276)∘, all observed with the AAT/WFI between 2004 and 2006, providing strong evidence that the Monoceros Ring cannot be considered part of the normal warp/flare profile of the Galactic disc. Of the 16 fields, 8 have a strong sequence beyond the normal Disc component which have been interpreted as the Monoceros Ring; two others are presented as tentative discoveries. Resolving the origins of the putative Canis Major dwarf galaxy is extremely difficult with a survey of this kind, but the conclusions reached are that by symmetry around the warped Galactic plane, there is no field above the plane which matches the properties of those in the overdensity. Also, there is no appreciable change in the density profiles of the various Galactic disc models to explain an overdensity of stars at that distance in Canis Major. The origins of the Blue Plume stars reveal two contradictory scenarios. From one view they are part of the Galactic disc and from another they are not. Although a more detailed survey is needed to resolve this issue, they can no longer be associated with Canis Major overdensity stars. Searching for a spiral arm explanation to the Monoceros Ring and Canis Major detections are mostly excluded on the basis of their distance out of the plane. The Canis Major detections are close to the plane and partially mixed in with known Galactic components. This makes disentangling them very difficult. However, since spiral arms are not visible in the basic structure of CMDs, which are comprised mainly of old Main Sequence stars, attributing the putative dwarf to an outer spiral arm is not possible with the data in hand. Importantly, the location of the dominant sequence in the (l,b) = (193,21)∘ field is highly inconsistent with current Galaxy models and may represent and extension of the CMa overdensity into this field. This field differs the most from the Besançon synthetic Galaxy model and may indicate a location where the CMa dwarf can be analysed away from the Disc. A study to fill the gaps in the entire CMa region is required to determine the origins of these disputed structures. Furthermore, the existence of a CMa stream can now be considered a possibility with previous detections labelled as MRi detections now potentially associated with the CMa stream. Further sampling of the predicted locations of the CMa stream is necessary to resolve the uncertainties presented here. Although many properties of the MRi and the CMa/Disc features are unknown, there is now a growing pool of evidence supporting a merger event in the Galaxy. Continued study will undoubtedly reveal their true impact on the formation and evolutionary scenarios of the Milky Way.
8 Acknowledgements
Many thanks to the referee for their thorough review which has improved the quality of this paper. We would also like to thank Naomi McClure-Griffiths for her assistance with the spiral arm comparisons. BCC would like to thank the University of Sydney for its UPA Scholarship and ESO for their Postdoctoral Fellowship for without them he would not be able to listen to the cricket from a telescope on the other side of the world. RRL thanks both LKN and MK for their financial and on-going support. GFL acknowledges the support of the Discovery Project grant DP0343508. The research of AMNF has been supported by a Marie Curie Fellowship of the European Community under contract number HPMF-CT-2002-01758.
References
- Abadi et al. (2003a) Abadi M. G., Navarro J. F., Steinmetz M., Eke V. R., 2003a, ApJ, 591, 499
- Abadi et al. (2003b) Abadi M. G., Navarro J. F., Steinmetz M., Eke V. R., 2003b, ApJ, 597, 21
- Adelman-McCarthy et al. (2006) Adelman-McCarthy, J. K., et al. 2006, ApJ, 162, 38
- Bellazzini et al. (2006) Bellazzini, M., Ibata, R., Martin, N., Lewis, G. F., Conn, B.[C.], & Irwin, M. J. 2006, MNRAS, 366, 865
- Belokurov et al. (2006a) Belokurov V., Evans N. W., Irwin M. J., Hewett P. C., Wilkinson M. I., 2006a, ApJ, 637, L29
- Bellazzini et al. (2007) Bellazzini, M., Kalirai, J., Ibata, R. A., Martin, N. F., Lewis, G. F., Conn, B. C., Irwin, M. J., 2007, MNRAS, submitted
- Belokurov et al. (2006c) Belokurov, V., et al. 2006c, astro-ph/0604355
- Burton (1988) Burton W. B., 1988, gera.book, 295
- Butler et al. (2006) Butler, D. J., Martinez-Delgado, D., Rix, H., Penarrubia, J., & de Jong, J. T. A. 2006, astro-ph/0609316
- Carraro et al. (2005) Carraro G., Vázquez R. A., Moitinho A., Baume G., 2005, ApJ, 630, L153
- Conn et al. (2005a) Conn B. C., Lewis G. F., Irwin M. J., Ibata R. A., Ferguson A. M. N., Tanvir N., Irwin J. M., 2005a, MNRAS, 362, 475
- Conn et al. (2005b) Conn B. C., Martin N. F., Lewis G. F., Ibata R. A., Bellazzini M., Irwin M. J., 2005b, MNRAS, 364, L13
- Cordes & Lazio (2002) Cordes, J. M. & Lazio, T. J. W. 2006, astro-ph/0207156
- Ferguson et al. (2002) Ferguson A. M. N., Irwin M. J., Ibata R. A., Lewis G. F., Tanvir N. R., 2002, AJ, 124, 1452
- Frei & Gunn (1994) Frei Z., Gunn J. E., 1994, AJ, 108, 1476
- Grillmair & Johnson (2006) Grillmair C. J., Johnson R., 2006, ApJ, 639, L17
- Grillmair & Dionatos (2006a) Grillmair C. J., Dionatos O., 2006a, ApJ, 641, L37
- Grillmair & Dionatos (2006b) Grillmair C. J., Dionatos O., 2006b, ApJ, 643, L17
- Grillmair (2006a) Grillmair C. J., 2006a, ApJ, 645, L37
- Grillmair (2006b) Grillmair, C. J. 2006b, ApJ, 651, L29
- Huxor et al. (2005) Huxor A. P., Tanvir N. R., Irwin M. J., Ibata R., Collett J. L., Ferguson A. M. N., Bridges T., Lewis G. F., 2005, MNRAS, 360, 1007
- Ibata, Gilmore, & Irwin (1994) Ibata R. A., Gilmore G., Irwin M. J., 1994, Natur, 370, 194
- Ibata et al. (2001c) Ibata R., Irwin M., Lewis G., Ferguson A. M. N., Tanvir N., 2001c, Natur, 412, 49
- Ibata et al. (2003) Ibata R. A., Irwin M. J., Lewis G. F., Ferguson A. M. N., Tanvir N., 2003, MNRAS, 340, L21
- Irwin & Lewis (2001) Irwin M., Lewis J., 2001, NewAR, 45, 105
- Jurić et al. (2005) Jurić, M., et al. 2005, astro-ph/0510520
- Klypin et al. (1999) Klypin A., Kravtsov A. V., Valenzuela O., Prada F., 1999, ApJ, 522, 82
- Levine et al. (2006) Levine, E. S., Blitz, L. & Heiles, C. 2006, astro-ph/0605728
- Lewis et al. (2004) Lewis, G. F., Ibata, R. A., Chapman, S. C., Ferguson, A. M. N., McConnachie, A. W., Irwin, M. J., & Tanvir, N. 2004, Publications of the Astronomical Society of Australia, 21, 203
- López-Corredoira et al. (2002) López-Corredoira M., Cabrera-Lavers A., Garzón F., Hammersley P. L., 2002, A&A, 394, 883
- López-Corredoira (2006) López-Corredoira M., 2006, MNRAS, 369, 1911
- Martin et al. (2004a) Martin N. F., Ibata R. A., Bellazzini M., Irwin M. J., Lewis G. F., Dehnen W., 2004a, MNRAS, 348, 12
- Martin et al. (2004b) Martin N. F., Ibata R. A., Conn B. C., Lewis G. F., Bellazzini M., Irwin M. J., McConnachie A. W., 2004b, MNRAS, 355, L33
- Martin et al. (2005a) Martin N. F., Ibata R. A., Conn B. C., Lewis G. F., Bellazzini M., Irwin M. J., 2005a, MNRAS, 362, 906
- Martin et al. (2006a) Martin N. F., Irwin M. J., Ibata R. A., Conn B. C., Lewis G. F., Bellazzini M., Chapman S., Tanvir N., 2006a, MNRAS, 367, L69
- Martínez-Delgado et al. (2005a) Martínez-Delgado D., Butler D. J., Rix H.-W., Franco Y. I., Peñarrubia J., Alfaro E. J., Dinescu D. I., 2005a, ApJ, 633, 205
- McClure-Griffiths et al. (2004) McClure-Griffiths N. M., Dickey J. M., Gaensler B. M., Green A. J., 2004, ApJ, 607, L127
- Moitinho et al. (2006) Moitinho A., Vázquez R. A., Carraro G., Baume G., Giorgi E. E., Lyra W., 2006, MNRAS, 368, L77
- Momany et al. (2004) Momany Y., Zaggia S. R., Bonifacio P., Piotto G., De Angeli F., Bedin L. R., Carraro G., 2004, A&A, 421, L29
- Momany et al. (2006) Momany Y., Zaggia S., Gilmore G., Piotto G., Carraro G., Bedin L. R., de Angeli F., 2006, A&A, 451, 515
- Newberg et al. (2002) Newberg H. J., et al., 2002, ApJ, 569, 245
- Peñarrubia et al. (2005) Peñarrubia, J., et al. 2005, ApJ, 626, 128
- Reylé & Robin (2001) Reylé C., Robin A. C., 2001, A&A, 373, 886
- Robin et al. (2003) Robin A. C., Reylé C., Derrière S., Picaud S., 2003, A&A, 409, 523
- Robin & Creze (1986) Robin A., Creze M., 1986, A&A, 157, 71
- Robin et al. (1996) Robin A. C., Haywood M., Creze M., Ojha D. K., Bienayme O., 1996, A&A, 305, 125
- Robin, Reylé, & Crézé (2000) Robin A. C., Reylé C., Crézé M., 2000, A&A, 359, 103
- Rocha-Pinto et al. (2003) Rocha-Pinto H. J., Majewski S. R., Skrutskie M. F., Crane J. D., 2003, ApJ, 594, L115
- Rocha-Pinto et al. (2004) Rocha-Pinto H. J., Majewski S. R., Skrutskie M. F., Crane J. D., Patterson R. J., 2004, ApJ, 615, 732
- Rocha-Pinto et al. (2006) Rocha-Pinto H. J., Majewski S. R., Skrutskie M. F., Patterson R. J., Nakanishi H., Muñoz R. R., Sofue Y., 2006, ApJ, 640, L147
- Schlegel, Finkbeiner, & Davis (1998) Schlegel D. J., Finkbeiner D. P., Davis M., 1998, ApJ, 500, 525
- Skrutskie et al. (2006) Skrutskie, M. F., et al. 2006, AJ, 131, 1163
- Willman et al. (2005a) Willman, B., et al. 2005a, AJ, 129, 2692
- Willman et al. (2005b) Willman, B., et al. 2005b, ApJ, 626, L85
- Yanny et al. (2003) Yanny, B., et al. 2003, ApJ, 588, 824
- Yusifov (2004) Yusifov I. 2004, astro-ph/0405517
- Zucker et al. (2004) Zucker D. B., et al., 2004, ApJ, 612, L121
- Zucker et al. (2006) Zucker D. B., et al., 2006, ApJ, 643, L103