A Survey of OH Masers Towards High Mass Protostellar Objects
Abstract
Context. Masers are important tracers of the early evolution of young high mass stars, but the relationship between different types of maser and the evolutionary state of the exciting source remains unclear.
Aims. To determine whether OH masers are common towards candidate high mass protostellar objects.
Methods. We present a survey of OH maser emission towards a sample of high mass protostellar objects made using the Nançay and GBT telescopes.
Results. OH maser emission was detected towards 63 objects with 36 new detections. There are 56 star-forming regions and 7 OH/IR candidates. Nearly half of the detected sources have OH flux densities 1 Jy. There is no evidence that sources with OH masers have a different range of luminosities from the non-maser sources. The results of this survey are compared with previous H2O and class II CH3OH maser observations of the same objects. Some of the detected sources are only associated with OH masers and some sources are only associated with the 1720 MHz OH maser line. The velocity range of the maser emission suggests that the water maser sources may be divided into two groups. The detection rates and velocity range of the OH and Class II CH3OH masers support the idea that there is a spatial association of the OH and Class II CH3OH masers. The sources span a wide range in , the ratio of the methanol maser peak flux to OH 1665 MHz maser peak flux, however there are only a few sources with intermediate values of , , which has characterised previous samples. The majority of the sources are either methanol-favoured or OH-favoured. Sources which have masers of any species, OH, water or methanol, have redder [100m12m] IRAS colours than those without masers. However, there is no evidence for different maser species tracing different stages in the evolution of these young high mass sources.
Conclusions. The detection of OH masers towards 26% of a sample of 217 sources should remove any doubt about the existence of OH maser emission towards these objects or this early evolutionary stage. Previous observations which have shown that the OH maser emission from similar sources traces the circumstellar disks around the objects. This combined with the sensitivity of the OH emission to the magnetic field, make the newly detected sources interesting candidates for future follow-up at high angular resolution.††thanks: The data shown in Figures 19 and 20 are available in electronic form at the CDS via anonymous ftp to cdsarc.u-strasbg.fr (130.79.128.5) or via http://cdsweb.u-strasbg.fr/cgi-bin/qcat?J/A+A/
Key Words.:
masers – stars: formation – ISM: molecules –HII regions1 Introduction
Compact HII regions, poorly collimated bipolar molecular outflows and circumstellar disks are signs of the existence of massive protostars (e.g. Garay & Lizano garay99, 1999; Churchwell churchwell02, 2002). Maser emission is also found to be associated with these objects (e.g. Garay & Lizano garay99, 1999; Edris et al. Edris05, 2005) with OH, H2O and CH3OH the three most widespread types of maser associated with these regions. These species have been used as probes of star-forming regions as their maser emission provide unique information on these dense dusty regions (e.g. Cohen cohen89, 1989, and references therein). Observations of H2O and Class II CH3OH masers have shown that both maser types are signposts of high mass star formation in very early evolutionary stages (Beuther et al. beuther02, 2002; Szymczak et al. SHK2000, 2000, hereafter SHK2000; Palla et al. palla91, 1991, hereafter P91).
On the other hand OH masers are known to be associated with an advanced stage of the appearance of UCHII region (e.g. Garay & Lizano garay99, 1999, and references therein). Models of these OH masers assume that the maser arises in the compressed shell between the shock and ionisation fronts around the HII region (Elitzur & De Jong elitzur78, 1978). However in a survey, Caswell caswell83 (1983) found large proportion of OH masers have no closely related prominent HII regions. In some molecular outflow sources, OH masers have been mapped with high angular resolution and found to be associated with an earlier stage of molecular outflows and circumstellar disks (Cohen, Rowland & Blair cohen84, 1984; Brebner brebner88, 1988; Cohen et al. cohen03, 2003; Edris et al. Edris05, 2005). Since the masers can be observed with high spatial, and spectral, resolution they can probe the inner regions of these sources. OH masers also provide the possibility of measuring the magnetic fields in these regions.
With this in mind, and to form a more complete picture of the relationship between maser emission and the evolution of high mass protostars, 217 high mass protostellar object (HMPO) candidates have been surveyed for OH maser emission using the Nançay radio telescope111The Nançay Radio Observatory is the Unité scientifique de Nançay of the Observatoire de Paris, associated as Unité de Service et de Recherche (USR) No. 704 to the French Centre National de la Recherche Scientifique (CNRS). The Nançay Observatory also gratefully acknowledges the financial support of the Conseil Régional de la Région Centre in France. and the NRAO Green Bank Telescope222The National Radio Astronomy Observatory (NRAO) is a facility of the National Science Foundation operated under cooperative agreement by Associated Universities, Inc. (GBT). The aims of this survey are:
-
•
to determine whether OH masers are associated with these objects,
-
•
to investigate the relationship between the OH and H2O and/or CH3OH maser emission and whether the masers are related to the evolutionary stage of these objects or represent different regions of the star formation core,
-
•
to identify sources for further study at high angular resolution.
The description of the sample is given in section 2 and the details of the observations are given in section 3. In section 4 we report the results of the survey while section 5 presents some detection statistics. In section 6 we discuss the interpretation while the conclusions are drawn in section 7.
2 The sample
| Class of object | [2512] | [6025] | [10060] | [6012] | Ref. |
|---|---|---|---|---|---|
| Cores | 0.41.0 | 0.41.3 | 0.10.7 | 1 | |
| H2O maser | 0.51.1 | 0.41.7 | 0.10.5 | 2 | |
| UCHII regions | 0.6 | 1.3 | 3 | ||
| Bright IRAS | 0.51.2 | 0.61.6 | 0.00.6 | 4 | |
| CMC+UCHII | 0.57 | 0.611.74 | 0.0870.52 | 1.3 | 5 |
| OH maser | 1.2 | 2.2 | 6 |
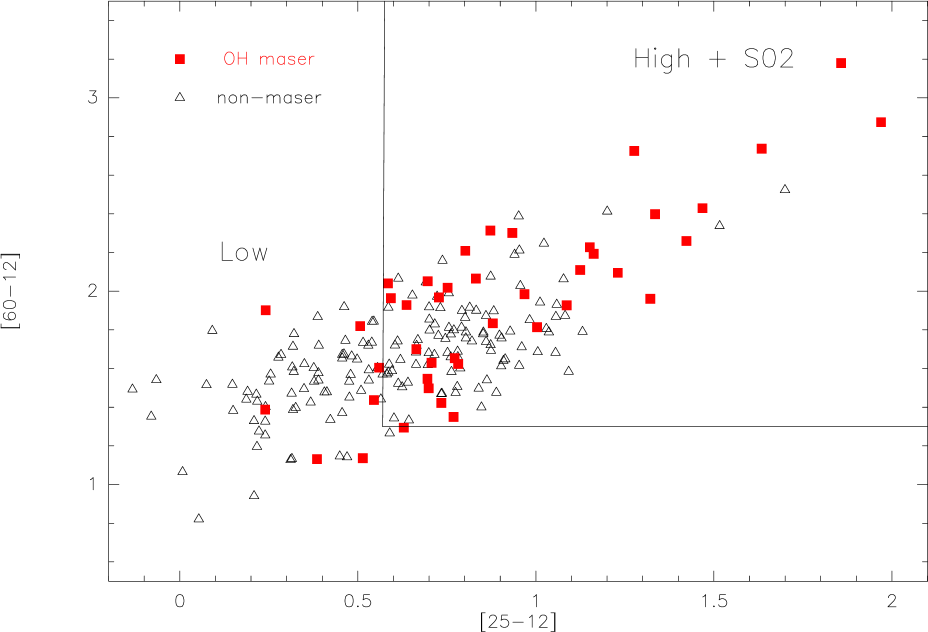
Different selection criteria have been proposed by many authors to use the IRAS point source catalogue to identify massive young sources (Table 1, and references therein). The sample of sources in this present survey is drawn from the sample of Sridharan et al. (sridharan02, 2002, hereafter S02) and Molinari et al. (molinari96, 1996, hereafter M96). These two samples are believed to contain massive sources in a very early stage of evolution prior to the forming of UCHII regions. M96 divided their sample into two subsamples, a High sample and a Low sample. The S02 sample and the High subsample of M96 satisfy the colour selection criteria of Wood & Churchwell wood89, 1989 (hereafter WC89) for UCHII regions. However the sources in these two samples (and also the M96 Low subsample) are not known to be associated with detectable HII regions. M96 suggest that their Low subsample comprises objects which are in a different evolutionary stage from those in their High subsample, and therefore also from the S02 sample. The two samples (S02 and M96) have sources with flux densities brighter than 90 Jy at 60m. Figure 1 shows the [2512]333[xy] indicates versus [6012] colour-colour diagram, indicating the location of the High, Low and S02 samples, for the whole sample observed here. Figure 1 also shows the results of this survey (§ 4); the detected sources of OH maser emission are marked with filled squares.
Observations show evidence of dense molecular gas associated with the majority of sources in the sample. The sources in the S02 sample have all been detected in CS J=21 (S02) while ammonia was detected towards 80% and 45% of the High and Low subsamples respectively of M96. Further details about the sources and their selection criteria can be found in S02 and M96 and references therein.
Combining the M96 and S02 samples, and accounting for the 15 sources in common, results in a sample of 217 of HMPO candidates which have been observed here. The vast majority of the sources in the sample have luminosities in the range L⊙ to L⊙. However distance uncertainties affect the luminosity estimates of individual sources and are likely to explain a few sources with apparently with much lower luminosities. Although these objects have been previously systematically surveyed for water and methanol masers, only a handful have previously been searched for OH masers.
2.1 Water and Methanol Masers in the sample
S02 searched their sample for 22 GHz H2O and 6.7 GHz CH3OH masers using the Effelsberg 100 m telescope. The detected sources (29 H2O and 26 CH3OH masers) were mapped with the Very Large Array (VLA) by Beuther et al. beuther02 (2002). The M96 sample had already been surveyed for H2O maser by P91 with the Medicina 32 m telescope and most of the sources were searched for 6.7 GHz CH3OH maser emission by Szymczak, Hrynek & Kus (SHK2000, 2000) using the Toruń 32 m radio telescope. Towards the M96 sample 40 H2O and 26 CH3OH maser sources have been reported. Therefore water and methanol masers were found towards 36% and 21%, respectively, of the 217 sources.
2.2 Outflows in the sample
Beuther et al. 2002c searched 26 sources from the S02 sample at a spatial resolution of 11 for bipolar molecular outflows. The signature of outflow was found towards 21 sources of them. The other five sources showed confusing morphology but have strong line wings. More recently, Zhang et al. zhang05 (2005) studied this phenomenon towards 69 sources of the M96 sample. Mapping in the CO - line, they identified 39 molecular outflows. Therefore, among 95 sources systematically searched out of the total of 217 objects, 60 sources show clear evidence of bipolar molecular outflows. This gives a 63 % detection rate which indicates that molecular outflows are very common in these regions.
3 Observations
3.1 Nançay Observations
Observations using the Nançay radio telescope were performed between July 2002 and June 2003. At 18cm the telescope has a beamsize of 3.5x19 (RA Dec). We simultaneously observed the four OH transitions at 1665, 1667, 1612 and 1720 MHz in both left and right circular polarizations. The 8192 channel autocorrelator was configured into eight banks of 1024 channels. Each bank had a total bandwidth of 1.5625 MHz yielding velocity resolutions of 0.284, 0.275, 0.274 and 0.266 km s-1 at 1612, 1665, 1667 and 1720 MHz, respectively. Inband frequencyswitching was used during these observations. The total integration time per sources was 18 minutes, giving a typical noise level in a single polarisation of about 50 mJy. A total useable velocity range of about 160 km s-1 was covered towards each source. The radial velocities were measured with respect to the local standard of rest (LSR). The spectral bandwidth was centred at the molecular gas velocity of the observed source, as given by M96 and S02. The NAnçay Preprocessing Software (NAPS) program was used for the initial data processing and eliminating bad integrations, and integrating the whole cycles of each scan. The data were then imported into CLASS for further processing. In CLASS, the spectra were FOLDed to remove ripples coming from the frequencyswitching technique and finally the spectral plots were produced.
3.2 GBT Observations
The Green Bank Telescope (GBT) was used to reobserve the sources detected by Nançay in order to: (1) observe them with higher spectral resolution; (2) decrease the contamination due to Nançay’s large beam size (, comparing to of GBT); and (3) make small maps to determine whether the masers were associated with these IRAS sources or offset from them. The GBT was also used to observe a small set of sources we did not have enough time to observe with Nançay. The observations were carried out from 18 to 23 May 2003. The 12.5 MHz, 9 level, 8 sampler correlator setting was used to observe all four OH lines (1665, 1667, 1612 and 1720 MHz) in both senses of circular polarizations. After confirming the presence of an OH maser towards the IRAS position of a source, most of the sources were mapped with small 3 arcminute sampled maps, typically pixels in size, to determine the position of the peak emission. For the majority of sources, where the position of the OH masers was consistent with the IRAS position, a higher resolution spectrum (with a velocity channel width of km s-1) was then obtained towards the IRAS position. The typical noise level in these high resolution spectra as about 0.1 Jy. For the high resolution spectra, the 12.5MHz, 3 level, 8 sampler mode was used to obtain four times higher resolution and covering all four OH lines in both senses of circular polarizations. Frequency switching was used during these observation. The typical system temperature was 20K resulting in a typical noise level of 50 mJy and 150 mJy in the low and high resolution spectrum respectively. Note that sources observed at Nançay but not detected were not reobserved at GBT.


4 Results
Combining the results from both Nançay and GBT, a total of 63 sources show OH maser emission, defined as bright and narrow polarized lines, in one or more of the OH transitions. Of these 36 have not been reported before.
The nature of the OH maser emission provides the opportunity to distinguish between sources which have same colours as HMPOs but are in fact late type stars around which OH masers are also known to occur (e.g. Cohen 1989). Towards evolved stars the 1612 MHz line spectrum usually shows double-peaked profile with sharp external edges and smooth internal ones with the two peaks separated by 15 to 40 km s-1 (Cohen 1989). Of the sources detected here 7 have 1612 MHz masers which indicate that they are OH/IR candidates.
The 63 sources detected include 57 detected at both Nançay and GBT, and 6 which were detected at Nançay but not observed at the GBT. We categorize these 6 sources as not confirmed, and do not consider them in our subsequent analysis.
The association of the maser emission and the IRAS source that we searched towards is confirmed by GBT maps for the first 46 sources in the table. Only these 46 objects are considered in the IRAS-related statistical analysis that follows. Thirty nine of these IRAS-associated sources are typical star-forming regions with masers strong in the main lines, 1665 and 1667 MHz. One source, IRAS 18463+0052, is associated with an OH/IR star. The remaining 6 sources have OH masers which are not typical of star-forming regions; they show maser emission in one of the satellite lines only (see § 6.4). There are remaining 11 confirmed sources with OH maser emission offset by 2 from the IRAS position are cataloged as offset sources in Table 2. They include 4 OH/IR candidates and 7 sources with OH spectra characteristic of star-forming regions.
The 57 confirmed maser sources and their OH line parameters are listed in Table 2. Column 1 gives the IRAS name of the source, columns 2 and 3 the maser position, where measured, with the uncertainties, column 4 the frequency and circular polarization of the maser line, with either L or R referring to lefthand or righthand circular polarisation respectively, column 5 the feature central velocity (relative to the LSR), columns 6 and 7 the velocity interval at zero intensity, column 8 the peak flux density in Jy, column 9 rms noise, column 10 the ratio of the CH3OH peak flux density to the OH peak flux density, R, as defined by Caswell (1998), and column 11 some comments.
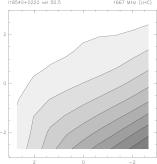
Figure 2 shows an example set of OH maser spectra and map from the GBT (IRAS18144–1723, left panels). The figure also shows an example of one of the sources cataloged as offset because their map reveal that the emission is not consistent with the IRAS position (IRAS18540+0220, right panels). Many of the sources with maser emission, for example IRAS 17527–2339 (Figure 19), show ‘conjugate’ behaviour with one of the satellite lines in emission while the other is in absorption (Elitzur Elitzur76, 1976). The maps and spectra of all the OH detected sources are shown in Figure 17 and Figure 19 respectively. The maps and spectra of the sources with maser emission offset from the IRAS position by 2 are separated in to Figure 18 and Figure 20 respectively.
A further 79 sources were detected in thermal emission and/or absorption. They are listed in Table 3 along with the 75 sources which were not detected in our observations. Table 3 also list the 6 sources categorized as not confirmed maser sources. A brief description and discussion of each of the OH maser sources is given in Appendix A.
| IRAS Name | position | Frequency | Velocity at | Flux at | RMS | R | Ref./Notes | |||
|---|---|---|---|---|---|---|---|---|---|---|
| RA(J2000) | DEC(J2000) | |||||||||
| h m s | ∘ ′ ′′ | km s-1 | Jy | Jy | ||||||
| 05137+3919 | 05 17 12.8 2.2 | 39 22 05 38 | 1665R | 21.58 | 24.5 | 21.2 | 2.20 | 0.40 | ||
| 05274+3345 | 05 31 06.4 1.4 | 33 47 27 19 | 1665R | 3.61 | 5 | 0.6 | 1.34 | 0.18 | 70 | |
| 1667L | 4.93 | 0.14 | 0.04 | |||||||
| 1612L | 3.87 | 0.13 | 0.05 | |||||||
| 05358+3543 | 05 39 13.0 0.1 | 35 45 51 01 | 1665L | 10.88 | 16.5 | 8.5 | 2.82 | 0.47 | 91 | 1 |
| 1667L | 10.53 | 0.93 | 0.17 | |||||||
| 05382+3547 | 05 41 12.9 1.3 | 35 54 06 20 | 1665R | 26.83 | 27.0 | 26.5 | 0.50 | 0.13 | 15 | |
| 06056+2131 | 06 08 52.4 1.6 | 21 34 06 23 | 1665L | 10.14 | 3.0 | 11.0 | 3.23 | 0.51 | 6 | |
| 1667R | 9.44 | 0.22 | 0.05 | off source | ||||||
| 1720R | 3.37 | 0.60 | 0.10 | |||||||
| 17527$-$2439 | 17 55 28.3 1.9 | 24 36 36 27 | 1665R | 11.53 | 8.2 | 12.2 | 0.40 | 0.14 | ||
| 18018$-$2426 | 18 04 53.1 0.1 | 24 26 41 01 | 1665R | 10.84 | 10.0 | 12.0 | 8.10 | 1.83 | ||
| 1667L | 11.05 | 0.98 | 0.20 | 1 | ||||||
| 18024$-$2119 | 18 05 25.6 2.3 | 21 14 59 19 | 1665R | 4.05 | 9.0 | 31.0 | 0.69 | 0.17 | 145 | |
| 1667R | 3.75 | 0.38 | 0.10 | |||||||
| 18048$-$2019 | 18 07 44.6 2.2 | 20 18 41 38 | 1665R | 44.36 | 40.0 | 44.7 | 0.34 | 0.08 | 104 | |
| 1667L | 40.28 | 0.27 | 0.09 | |||||||
| 18089$-$1732 | 18 11 51.4 0.1 | 17 31 29 01 | 1665L | 32.92 | 31.0 | 36.0 | 10.30 | 1.86 | 6 | 1 |
| 1667L | 33.36 | 2.00 | 0.32 | |||||||
| 18090$-$1832 | 18 11 47.4 1.5 | 18 29 47 26 | 1665R | 108.9 | 103.0 | 110.0 | 0.70 | 0.08 | 110 | |
| 1667R | 106.6 | 0.49 | 0.08 | |||||||
| 18102$-$1800 | 18 13 04.4 1.5 | 18 00 23 16 | 1665R | 24.40 | 24.0 | 25.0 | 0.42 | 0.10 | 31 | |
| 18144$-$1723 | 18 17 26.5 1.1 | 17 22 29 16 | 1665L | 48.33 | 48.0 | 64.0 | 35.9 | 3.45 | 1 | |
| 1667L | 61.75 | 4.80 | 0.62 | |||||||
| 18182$-$1433 | 18 21 11.0 1.0 | 14 31 23 14 | 1665L | 61.55 | 58.0 | 64.0 | 0.72 | 0.16 | 33 | |
| 1667L | 62.45 | 0.40 | 0.12 | |||||||
| 18236$-$1205 | 18 26 36.2 1.0 | 12 04 54 14 | 1665R | 31.09 | 20.0 | 32.0 | 0.80 | 0.16 | 8 | |
| 18 26 31.7 1.0 | 12 03 26 14 | 1667L | 62.45 | 0.28 | 0.06 | |||||
| 18264$-$1152 | 18 29 19.2 1.1 | 11 50 05 17 | 1720L | 39.31 | 37.5 | 43.5 | 2.30 | 0.55 | ||
| 18278$-$1009 | 18 30 37.9 1.1 | 10 07 25 17 | 1665R | 119.7 | 118.0 | 121.0 | 0.42 | 0.09 | 33 | |
| 18290$-$0924 | 18 31 46.4 1.1 | 09 22 14 15 | 1665R | 78.33 | 76.0 | 84.0 | 2.30 | 0.41 | 5 | |
| 1667R | 78.45 | 0.34 | 0.90 | |||||||
| 18310$-$0825 | 18 33 36.0 0.8 | 08 19 46 13 | 1667L | 88.74 | 88.0 | 89.0 | 1.40 | 0.21 | ||
| 18316$-$0602 | 18 34 25.9 1.1 | 06 00 01 16 | 1665R | 39.90 | 36.0 | 46.0 | 6.00 | 0.87 | 30 | |
| 1667L | 40.41 | 3.38 | 0.48 | |||||||
| 18345$-$0641 | 18 47 08.0 2.8 | 02 19 05 40 | 1612R | 93.52 | 92.0 | 96.0 | 0.43 | 0.07 | 23 | |
| 18360$-$0537 | 18 38 42.2 1.1 | 05 36 25 16 | 1665R | 102.9 | 102.0 | 106.0 | 0.54 | 0.05 | ||
| 18 38 47.2 1.2 | 05 35 40 17 | 1667L | 105.3 | 0.74 | 0.05 | |||||
| 18385$-$0512 | 18 41 18.2 1.0 | 05 08 57 14 | 1665R | 24.87 | 21.0 | 30.0 | 1.01 | 0.04 | ||
| 18440$-$0148 | 18 46 37.8 1.0 | 01 44 27 13 | 1665R | 101.4 | 99.0 | 110.0 | 6.00 | 0.08 | 0.5 | |
| 1667R | 102.6 | 2.00 | 0.10 | |||||||
| 18454$-$0158 | 18 48 01.3 1.0 | 01 54 34 15 | 1665L | 39.6 | 30.0 | 44.0 | 0.35 | 0.10 | ||
| 18463+0052 | 18 48 46.8 2.2 | 00 56 55 24 | 1612R | 67.32 | 67.0 | 70.0 | 2.26 | 0.09 | OH/IR | |
| 18488+0000 | 18 51 30.5 1.0 | 00 03 21 16 | 1665R | 79.57 | 79.0 | 87.0 | 4.52 | 0.07 | 6 | |
| 1667R | 77.90 | 2.66 | 0.05 | |||||||
| 18507+0121 | 18 53 18.2 1.2 | 01 24 30 18 | 1665L | 55.78 | 53.0 | 56.0 | 2.00 | 0.08 | 14 | |
| 1667L | 53.88 | 1.10 | 0.09 | |||||||
| 18527+0301 | 18 54 46.5 2.5 | 03 05 07 40 | 1665R | 74.44 | 72.0 | 75.0 | 0.21 | 0.02 | 48 | |
| 1667L | 73.30 | 0.16 | 0.02 | |||||||
| 18553+0414 | 18 57 50.7 1.2 | 04 18 36 18 | 1720L | 6.63 | 4.0 | 8.0 | 0.67 | 0.03 | ||
| 18566+0408 | 18 59 08.7 1.1 | 04 10 21 17 | 1665L | 83.41 | 52.0 | 92.0 | 1.00 | 0.12 | 7 | |
| 18 59 10.4 1.0 | 04 13 21 14 | 1667L | 81.52 | 0.50 | 0.14 | |||||
| 19035+0641 | 19 06 01.6 0.0 | 06 46 35 01 | 1665L | 32.44 | 24.2 | 36.2 | 90.00 | 0.61 | 0.2 | 1 |
| 1667R | 27.33 | 22.30 | 0.27 | |||||||
| 19092+0841 | 19 11 45.9 0.4 | 08 46 49 06 | 1665R | 57.87 | 54.0 | 62.0 | 3.45 | 0.04 | 3 | |
| 19 11 46.6 0.4 | 08 46 19 10 | 1667L | 60.51 | 1.75 | 0.04 | |||||
| 19118+0945 | 19 14 29.7 1.6 | 09 51 47 46 | 1665R | 61.25 | 61.0 | 71.0 | 0.35 | 0.05 | ||
| 1667L | 58.90 | 0.22 | 0.05 | |||||||
| 19217+1651 | 19 23 57.9 0.9 | 16 56 42 13 | 1665L | 0.21 | 2.0 | 10.0 | 1.35 | 0.05 | 1 | |
| 1667L | 6.69 | 1.22 | 0.05 | |||||||
| 19220+1432 | 19 24 19.7 1.5 | 14 37 23 30 | 1720R | 60.67 | 59.5 | 61.0 | 0.44 | 0.08 | ||
| 19374+2352 | 19 39 37.4 4.0 | 23 59 53 109 | 1665R | 37.06 | 35.0 | 40.0 | 0.46 | 0.06 | ||
| 1667R | 37.00 | 0.13 | 0.02 | |||||||
| 1720R | 37.05 | 0.17 | 0.03 | |||||||
| 19388+2357 | 19 41 10.2 2.2 | 24 03 44 25 | 1665L | 35.81 | 34.0 | 39.0 | 0.32 | 0.04 | 77 | |
| 19410+2336 | 19 43 12.2 1.1 | 23 44 03 12 | 1665L | 20.67 | 20.0 | 23.0 | 0.71 | 0.03 | 48 | |
| 20062+3550 | 20 08 12.7 1.2 | 35 59 20 20 | 1665R | 0.77 | 1.0 | 2.2 | 0.17 | 0.03 | 59 | |
| 20126+4104 | 20 14 26.06 0.002 | 41 13 32.63 0.02 | 1665R | 12.27 | 16.0 | 2.0 | 2.37 | 0.11 | 16 | 2 |
| 20188+3928 | 20 20 41.8 1.0 | 39 37 42 12 | 1720L | 1.03 | 3.0 | 4.0 | 4.18 | 0.14 | ||
| 20227+4154 | 20 24 34.6 1.3 | 42 06 12 22 | 1665L | 24.29 | 10.0 | 25.0 | 0.80 | 0.07 | ||
| 22198+6336 | 22 21 00.7 1.3 | 63 51 57 16 | 1665L | 12.14 | 23.0 | 10.0 | 2.00 | 0.08 | ||
| 22 21 37.6 0.4 | 63 51 47 08 | 1667L | 13.00 | 3.50 | 0.17 | |||||
| 22272+6358 | 22 28 58.5 0.8 | 64 15 52 14 | 1665L | 12.12 | 12.0 | 8.0 | 1.10 | 0.06 | 83 | |
| 1667L | 11.96 | 1.68 | 0.07 | |||||||
| 23139+5939 | 23 16 06.8 1.0 | 59 58 52 13 | 1612R | 72.93 | 74.0 | 68.0 | 0.63 | 0.11 | ||
| Masers sources offset | ||||||||||
| 04579+4703 | 1720R | 17.70 | 18.1 | 16.8 | 0.22 | 0.05 | ||||
| 06382+0939 | 1665R | 11.48 | 9.2 | 13.0 | 0.80 | 0.16 | ||||
| 18408$-$0348 | 1665R | 89.60 | 88.0 | 113.0 | 1.00 | 0.10 | ||||
| 18511+0146 | 1665R | 47.91 | 47.0 | 49.0 | 0.38 | 0.04 | ||||
| 18540+0220 | 1665R | 49.13 | 48.0 | 53.5 | 53.73 | 0.19 | ||||
| 1667L | 50.38 | 10.57 | 0.09 | |||||||
| 18586+0106 | 1665L | 42.00 | 38.5 | 46.0 | 0.50 | 0.18 | ||||
| 1667L | 42.50 | 0.70 | 0.17 | |||||||
| 1720R | 38.81 | 3.00 | 0.31 | |||||||
| 20099+3640 | 1665R | 42.74 | 43.0 | 42.0 | 0.30 | 0.04 | ||||
| OH/IR sources offset | ||||||||||
| 18258$-$0737 | 1612R | 93.00 | 63.0 | 95.0 | 2.00 | 0.10 | OH/IR | |||
| 18348$-$0616 | 1612L | 70.00 | 25.0 | 73.0 | 1.50 | 0.18 | OH/IR | |||
| 18424$-$0329 | 1612L | 40.00 | 38.0 | 82.0 | 0.50 | 0.13 | OH/IR | |||
| 18565+0349 | 1612L | 27.00 | 25.0 | 62.0 | 1.50 | 0.11 | OH/IR | |||
| IRAS sources with thermal absorption and/or thermal emission | |||
| 00420+5530 | 18167$-$1614 | 18551+0302 | 20081+2720 |
| 05168+3634 | 18172$-$1548 | 18567+0700 | 20180+3558 |
| 05345+3157 | 18212$-$1320 | 18571+0326 | 20205+3948 |
| 05373+2349 | 18223$-$1243 | 18571+0349 | 20216+4107 |
| 06061+2151 | 18256$-$0742 | 18596+0536 | 20217+3947 |
| 06063+2040 | 18288$-$0158 | 19001+0402 | 20220+3728 |
| 06105+1756 | 18306$-$0835 | 19002+0454 | 20293+3952 |
| 06299+1011 | 18337$-$0743 | 19012+0505 | 20293+4007 |
| 06303+1021 | 18363$-$0554 | 19012+0536 | 20319+3958 |
| 17417$-$2851 | 18396$-$0431 | 19023+0538 | 20332+4124 |
| 17450$-$2742 | 18426$-$0204 | 19045+0518 | 20333+4102 |
| 17495$-$2624 | 18437$-$0216 | 19088+0902 | 20343+4129 |
| 17582$-$2234 | 18445$-$0222 | 19175+1357 | 21078+5211 |
| 18024$-$2231 | 18447$-$0229 | 19198+1423 | 21548+5747 |
| 18039$-$2052 | 18454$-$0136 | 19295+1637 | 22551+6221 |
| 18134$-$1942 | 18517+0437 | 19332+2028 | 23026+5948 |
| 18156$-$1343 | 18530+0215 | 19343+2026 | 23033+5951 |
| 18159$-$1550 | 18532+0047 | 19368+2239 | 23140+6121 |
| 18159$-$1648 | 18537+0145 | 20050+2720 | 23545+6508 |
| 18162$-$1612 | 18544+0112 | 20051+3435 | |
| IRAS sources with no detected absorption or emission | |||
| 00117+6412 | 18272$-$1217 | 19542+3004 | 22187+5559 |
| 01420+6401 | 18317$-$0513 | 20028+2903 | 22267+6244 |
| 03211+5446 | 18355$-$0550 | 20056+3350 | 22305+5803 |
| 04034+5116 | 18372$-$0541 | 20106+3545 | 22344+5909 |
| 05490+2658 | 18470$-$0044 | 20278+3521 | 22457+5751 |
| 05553+1631 | 18472$-$0022 | 20286+4105 | 22506+5944 |
| 06068+2030 | 18521+0134 | 20321+4112 | 22570+5912 |
| 06103+1523 | 19043+0726 | 20406+4555 | 23146+5954 |
| 06104+1524 | 19077+0839 | 20444+4629 | 23151+5912 |
| 06155+2319 | 19094+0944 | 21046+5110 | 23152+6034 |
| 06291+0421 | 19183+1556 | 21080+4758 | 23314+6033 |
| 06308+0402 | 19045+0813 | 21202+5157 | 23330+6437 |
| 06584$-$0852 | 19213+1723 | 21307+5049 | 23385+6053 |
| 17571$-$2328 | 19266+1745 | 21336+5333 | 23448+6010 |
| 17504$-$2519 | 19282+1814 | 21391+5802 | 23507+6230 |
| 18014$-$2428 | 19403+2258 | 21519+5613 | |
| 18123$-$1203 | 19411+2306 | 21526+5728 | |
| 18151$-$1208 | 19413+2332 | 22134+5834 | |
| 18197$-$1351 | 19458+2442 | 22147+5948 | |
| 18247$-$1147 | 19471+2641 | 22172+5549 | |
| Maser sources not confirmed | |||
| 00070+6503 | 18311$-$0701 | 18431$-$0312 | 19074+0752 |
| OH/IR sources not confirmed | |||
| 18308$-$0841 | 18460$-$0307 | ||
5 Detection Statistics and Analysis
The survey observations detected 63 OH maser sources out of 217 IRAS sources. For 46 of these the association with the IRAS source is confirmed by maps made with the GBT. Of these 36 are new detections. That gives a detection rate of 29% (including unconfirmed and not associated with IRAS position sources) or 21% if only the confirmed IRAS associated sources are considered. This is very similar to the 22% detection rate of Cohen et al. cohen88 (1988) although the Cohen et al. sample contained only sources with F Jy. Cohen et al. also found that higher F60 was correlated with a higher probability of the presence of OH masers. There is little evidence for such a correlation in the objects observed in this survey, although the small number of high flux sources in this sample makes it difficult draw any firm conclusion.
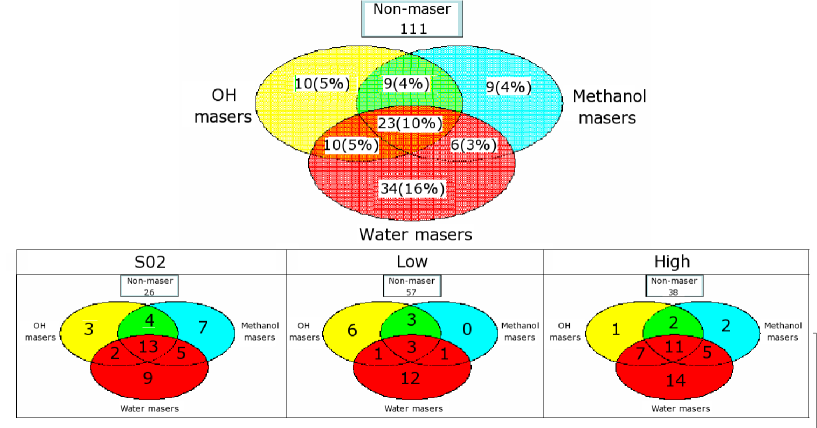
Figure 3 summarises the detection statistics for OH, H2O and 6.7 GHz, Class II, CH3OH masers towards the sample. OH and CH3OH masers show very similar percentages of detections. Indeed, among the detected OH masers sources, the two types of maser have 67% of sources in common. The number of detections of the three maser types towards the subsamples is also shown. The S02 and High samples show similarly higher detection rates than the Low sample for which 70% of its sources have no maser emission. Not only are masers of any type relatively rare towards the Low subsample, sources with all three types of maser are particularly uncommon. In the Low subsample there are only three such sources, namely IRAS 19092+0841, IRAS 180242119 and IRAS 181441723. Water masers show the highest detection rates towards the High sample (46%), while CH3OH masers show high detection rate towards S02 sample (42%). Perhaps surprisingly there is a significant difference in the detection rates of S02 and High sample for CH3OH maser, 42% and 25% respectively. OH masers have similar detection rates towards the High and S02 samples, 26%. The sources which show only OH maser emission are mostly from the Low sample. This point is discussed in § 6.3.
5.1 OH Maser Flux Densities
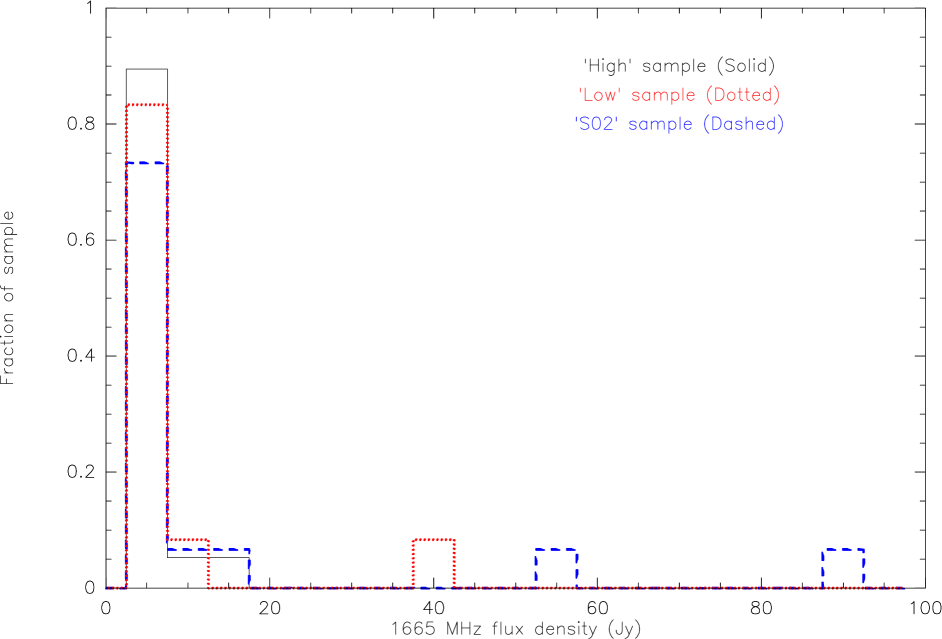
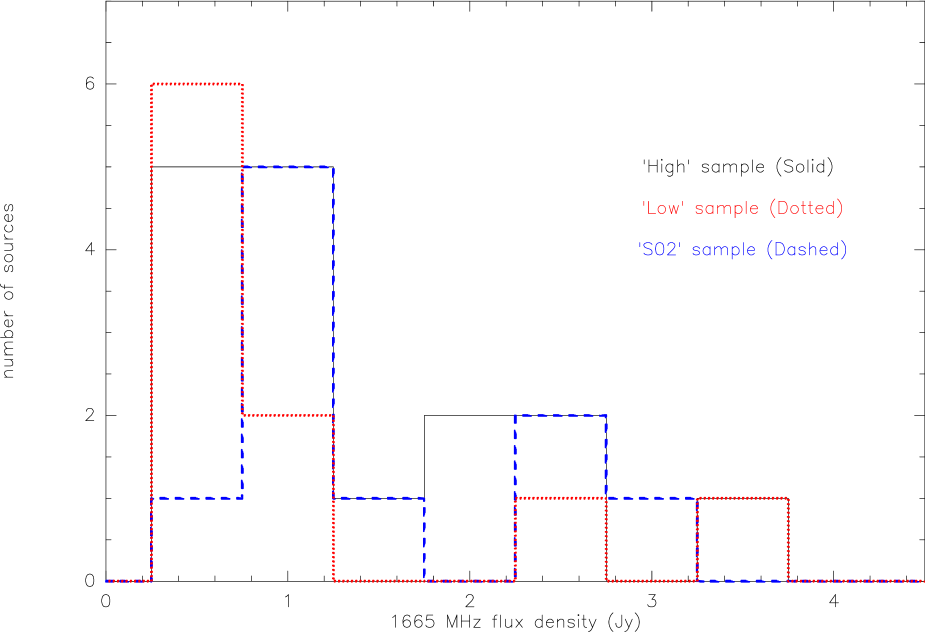
Figure 4 shows the distribution of 1665 MHz peak flux densities towards the three subsamples, High sample (solid line), Low sample (dashed line) and S02 sample (dotted line). The right panel of Figure 4 shows an expanded view for sources with 1665 MHz flux density weaker than 4.5 Jy. These figures show that nearly half of the detected sources have peak flux densities 1 Jy. The significance of this result is discussed in Sec. 6.2. Figure 4 also shows a further difference between the different subsamples. Most of the Low sample have 1665 MHz flux densities between 0.25 and 0.75 Jy while most of those of the S02 sample between 0.75 and 1.25 Jy and the High sample shows a wider spread of 1665 MHz flux densities.
5.2 IRAS flux densities and colour analysis

The correlation of maser emission and IR has been studied by many authors to examine if masers are pumped by IR photons or not. A correlation of OH maser flux and IR flux has been clearly seen at 60 and 100m by several authors (Cohen et al cohen88, 1988; Moore et al. moore88, 1988; Slysh et al. Slysh97, 1997). Figure 5 plots the 1665 MHz peak flux densities against the IRAS flux densities at 12, 25, 60 and 100 m for the sample observed here. The top-left panel of F60 F1665 also shows the results of previous studies: the Slysh et al. Slysh97 (1997) data upper limit (dashed line) corresponds to = 0.024 and the dotted line is the upper limit line of Moore et al. moore88 (1988) data (corresponding to = 0.1 ). The solid line corresponds to equal flux densities. Although the sources searched here have flux densities similar to Slysh et al. Slysh97 (1997), the survey results are more consistent with the Moore et al. moore88 (1988) line and appear to be consistent with an extension of Moore et al. sample to lower IR flux densities. The distribution at 60 and 100m flux densities confirm previous conclusions that, at these wavelengths, a minimum IR flux density is required for a given maser line strength (Cohen et al. cohen88, 1988; Moore et al. moore88, 1988; Slysh et al. Slysh97, 1997).

Figure 6 plots the [10060] colour index OH 1665 MHz maser luminosity, . There may be a suggestion of a lower envelope to the distribution at [100-60] indicating masers are found prefentially towards sources with warmer radiation temperatures.
| [2512] | [6012] | [6025] | [10060] | [10012] | ||||||
|---|---|---|---|---|---|---|---|---|---|---|
| Maser type/s | % | % | % | % | % | % | % | % | % | |
| OH | 96.5 | 100 | 53.6 | 19.7 | 100 | 98.8 | 84.8 | 92.4 | 96.5 | |
| H2O | 100 | 100 | 61.3 | 12.4 | 100 | 83.1 | 99.2 | 99.7 | 99.5 | |
| CH3OH | 99.9 | 100 | 91.7 | 98 | 100 | 100 | 41.1 | 99.6 | 100 | |
| OH, H2O & CH3OH | 96.5 | 100 | 81.5 | 74.5 | 100 | 99.9 | 81.5 | 99.4 | 99.4 |
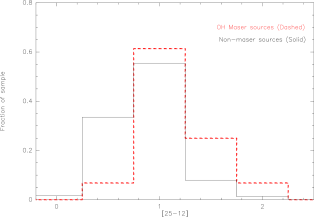
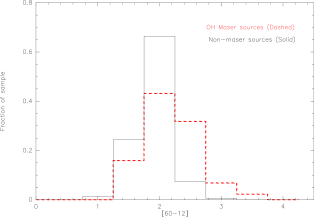
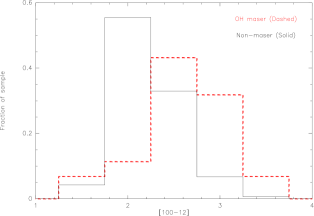
To see if there is a difference in IR flux densities or colours between maser and non-maser sources, IRAS sources associated with one or more type of maser were compared with the rest of the sources. Table 4 gives the results of KolmogorovSmirnov (KS) test for the probability D, that the flux density or colour distribution between maser and nonmaser source are different. The table shows that in general, the maser sources do show different flux densities and colours from nonmaser ones. The difference between maser sources and nonmaser sources is most evident in the [6012] and [10012] colours for all types of masers where D 100% and in the [2512] colour for H2O and CH3OH masers where D 99.9%. Figure 7 plots the distribution of these three colour indices for the OH maser and non-maser sources to demonstrate the last points. It can also be seen in Figure 1, where it is clear that sources with OH masers dominate over non-maser sources in the regions [25-12] and [60-12]. Even for colours smaller than these values, the maser sources make up % of the population, a higher fractor than for sources with smaller colours and for the sample overall. The redder colours of the maser sources is unlikely to be affected by the uncertainties in the colours of the sources unless the uncertainties preferentially affect maser sources and non-maser sources in different senses.
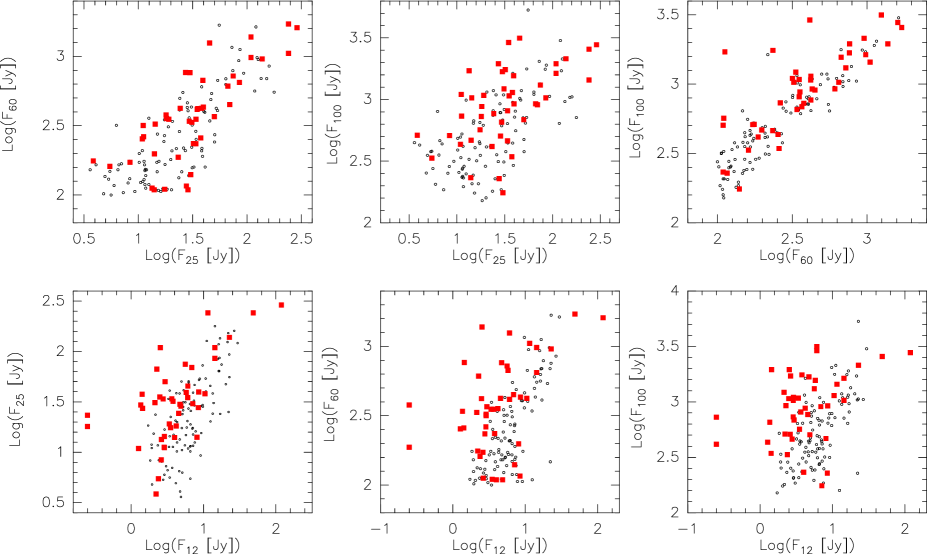
The [2512] and [6012] colour indices are the ones used by WC89 to identify UCHII regions. These results show that maser sources tend to be relatively faint at 12m compared to their fluxes at longer wavelengths. Figure 8 shows the four IRAS flux densities against each other for maser sources (squares) and non-maser sources (dots).The difference between maser sources and non-maser sources is obvious in the lower panels which include the 12m flux densities. On the other hand, as Table 4 also shows, sources with only OH or H2O masers have [6025] and [10060] colours indistinguishable from non-maser sources.
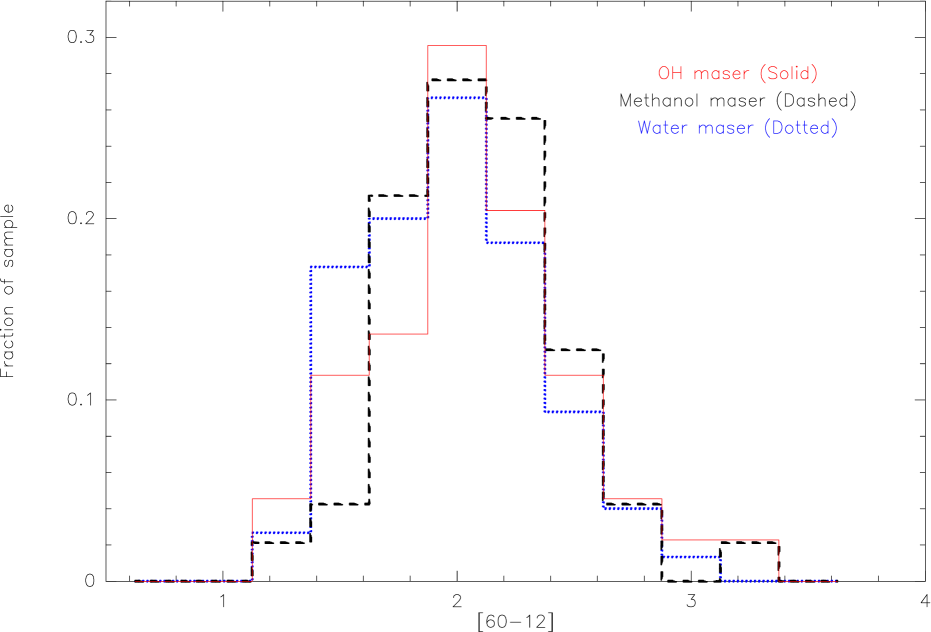
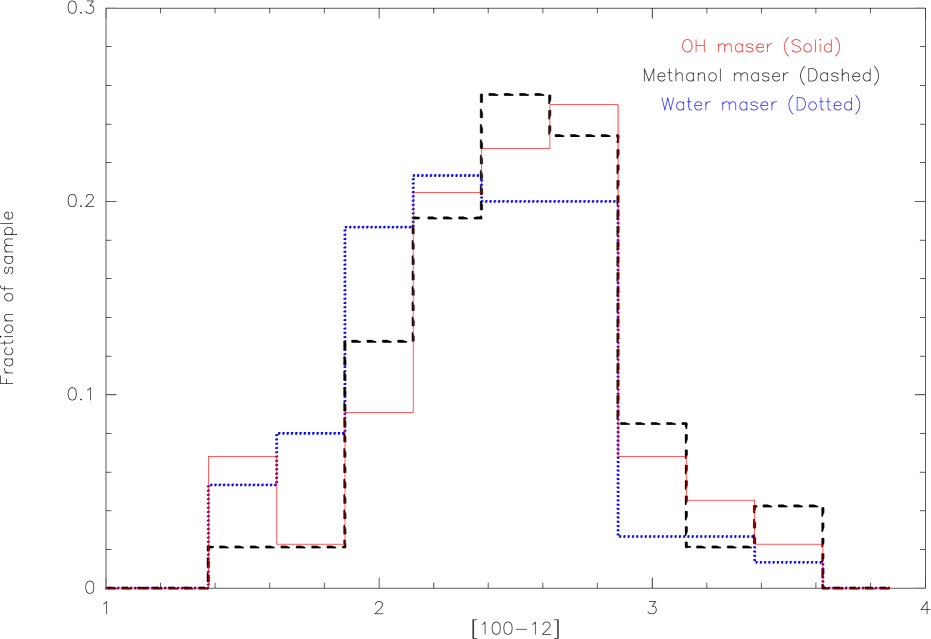
Given the differences in [6012] and [10012] colours of sources with any type of maser, it is interesting to ask whether there is any systematic difference in source colour as a function of maser type. Figure 9 compares these colours for sources with each type of maser showing that there is no significant difference in the distribution of these colours as a function of maser type. For this sample there appears to be no evidence in their IRAS colours that different types of maser trace sources in significantly different evolutionary states.

Regarding the 100, 60, 25 and 12m flux densities, the probabilities, D in Table 4 are relatively large for all flux densities, except the CH3OH only sources at 25m. However only for few maser–flux combinations are the individual D probabilities statistically significant at a 3 level. Although methanol masers are believed to be excited by mid-IR photons (Cragg et al. Cragg05, 2005), Figure 10 shows that there is no clear correlation between CH3OH maser and 12 m flux densities.
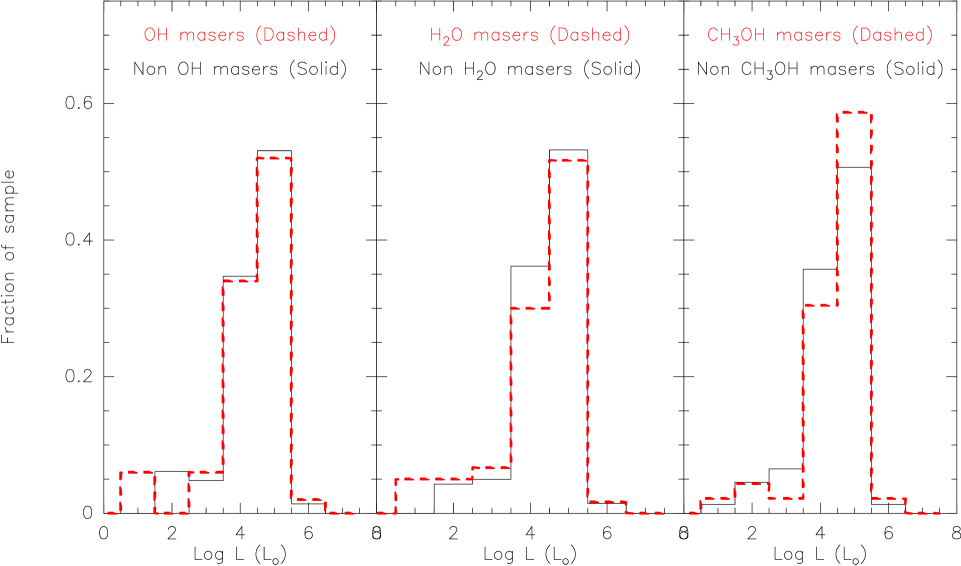
Figure 11 compares the luminosity of maser sources and non-maser sources. The distributions are statistically indistinguishable, indicating that masers are not preferentially associated with only the more luminous sources.

Comparing the IRAS colour indices to the ratio of CH3OH and OH maser flux densities, Figure 12 plots the ratio of the OH peak flux density to the CH3OH peak flux density, R, versus the IRAS colours of a source. According to Caswell caswell98 (1998) the spread in the ratio R reflects the range in evolutionary stage of the sources, but this figure does not show any evidence that R depends on the colour of a source which might also be expected to evolve as a source evolves. In considering this result, it should be noted that the IRAS colours may suffer from confusion because of the poor spatial resolution of IRAS and maser observations combined with the tendency of massive stars to form in clusters (cf. Bourke et al. bourke05, 2005).
5.3 Velocity Range of Masers
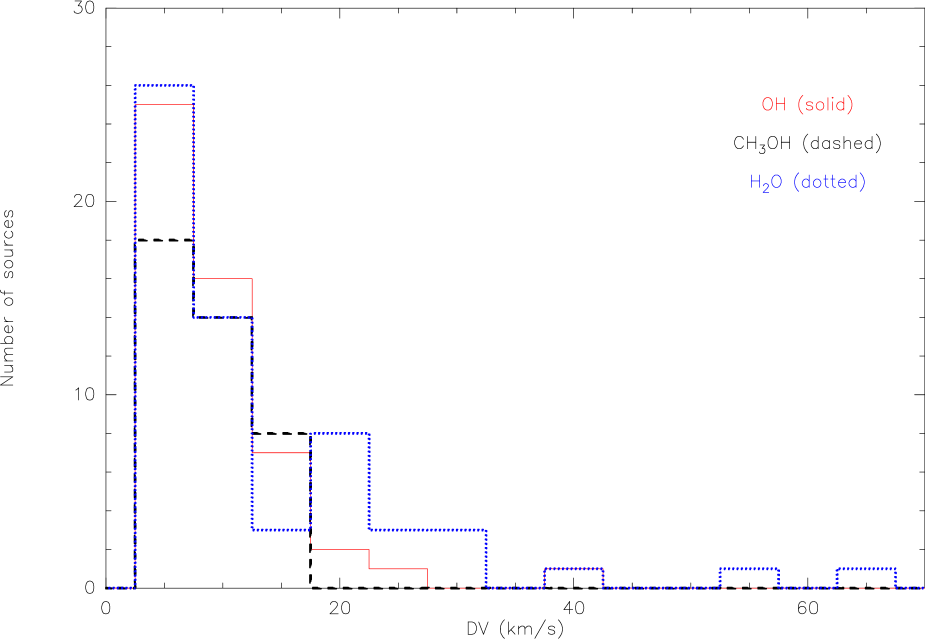
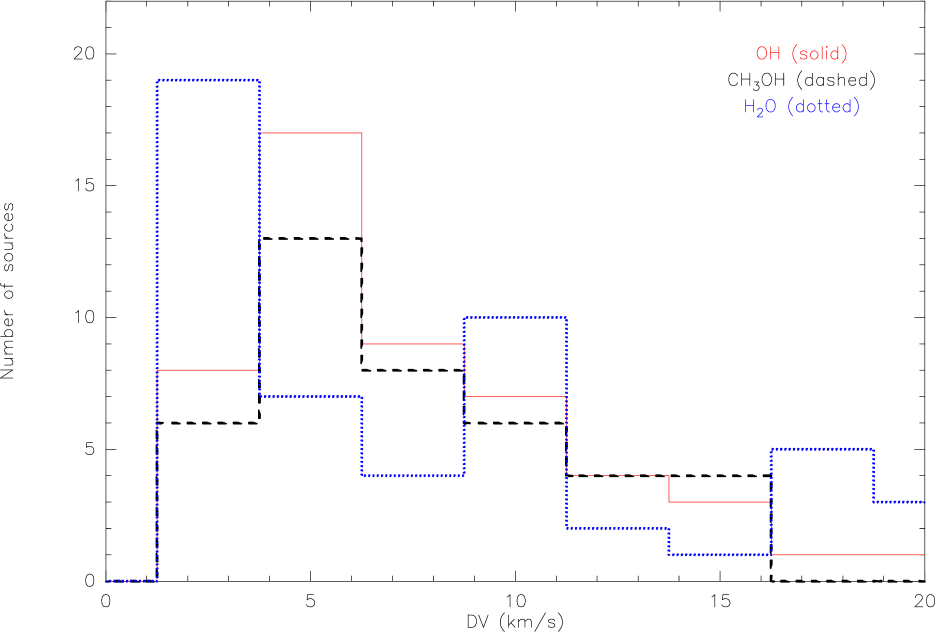
The range of velocities over which maser emission is observed can be used to investigate whether the emission from different masers arises from different material associated with the sources. Figure 13 shows the distribution of the range of velocity for each OH maser source detected (Table 2). For comparison the figure also shows the velocity range of the H2O and CH3OH masers from SHK2000, P91, S02 (and references therein) and Han et al. (1998). The righthand panel of Figure 13 shows an expanded view of the sources with velocity range 20 km s-1.
For all three species the velocity range peaks at less than 10 km s-1. The CH3OH masers and OH masers extend up to velocity ranges of 17.5 and 22.5 km s-1 respectively. Overall the figures show that the OH and CH3OH agree very well in their distribution of velocity range, peaking at km s-1, suggesting that these masers may originate in similar material around the sources. On the other hand the H2O masers show a quite different distribution. In some sources the emission covering up 65 km s-1 has been observed. However the distribution actually peaks at spreads km s-1, smaller than for the OH and CH3OH. This suggests a two population structure, with one group of sources with velocity ranges between km s-1 and km s-1 and a second with velocity ranges km s-1.
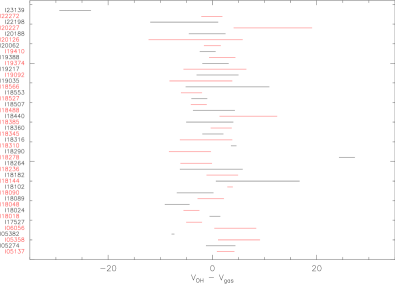
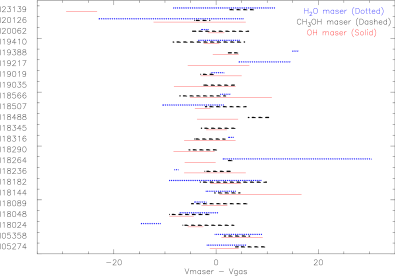
The offset between the OH maser velocity and the velocity of the dense gas towards each source (M96 and S02) is shown in Figure 14 (left). Overall the OH maser velocities are distributed around the gas velocity, as they are also for some particular sources. On the other hand there are exceptions with some sources where the OH masers are offset by up to km s-1 from the gas velocity. Comparing the velocity offset between different maser type and dense gas for sources with all three types of masers (Figure 14, right), it is difficult to identify any global trend. However inspection of the observations shows 8 out of the 23 sources with all three masers have V(OH) V(CH3OH) V(H2O).
6 Discussion
6.1 Comparison of OH Masers With 6668 MHz Methanol Masers
The similarity in detection rates and velocity ranges suggest an association between OH and Class II CH3OH masers in these sources as first suggested by Caswell et al. caswell95 (1995) and modelled by Cragg, Sobolev & Godfrey cragg02 (2002). A similar result has also been found by Szymczak & Gérard szymczak04 (2004) who searched a sample of 100 CH3OH maser sources for OH masers. They found that 55% of CH3OH maser sources also have OH maser emission. Their results also show that OH and CH3OH masers cover similar velocity ranges.
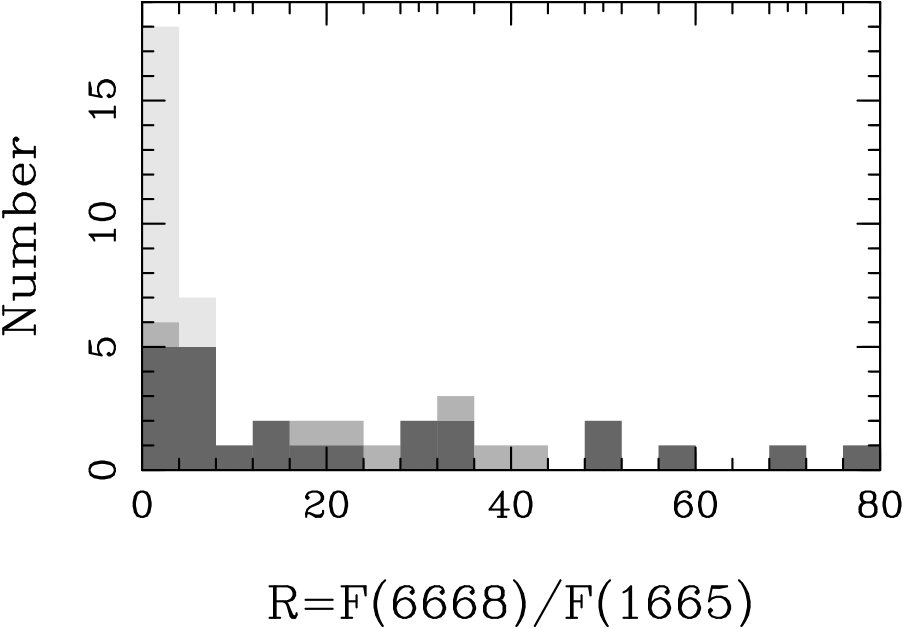
We applied the suggestion of Caswell caswell96 (1996) for characterizing the maser sites where methanol and OH masers occur using the ratio of peak methanol intensity to peak 1665 MHz OH intensity. Figure 15 shows the distribution of the OH to CH3OH intensity ratio, (Table 2). For the 29 sources which show both 1665 MHz OH masers and 6668 MHz masers, 12 sources have values of R 32 which places them in methanol-favoured region and 10 sources in OH-favoured region (R 8).
There are an additional 12 sources which do not have OH maser emission but do have methanol masers and 20 sources with OH masers but no methanol masers. Limits on for these sources were obtained by adopting a three sigma limit on the presence of OH masers of 150 mJy (typical of this survey) and a limit of 1500 mJy for the presence of methanol masers (Pestalozzi et al. 2005). The resulting 3-sigma limits are also shown on Figure 15. All the methanol non-detections are consistent with the sources being OH favoured. For the OH non-detections, one source with a lower limit on R of 3 could be OH favoured, 8 sources are definitely methanol favoured and the remaining 3 have lower limits on between 8 and 32.
The sources observed here have a very wide range in , with measured values from ranging from 0.2 to 145 and three lower limits on in excess of 400. The distribution of these values is in marked contrast to the results of Caswell caswell96 (1996), who found most sources to have in the range 8 to 32, with a typical value of 16. Over our whole sample, including the limits, 25 sources (41%) are OH-favoured. A similar fraction of the sample, 26 sources (43%), are CH3OH favoured, which Caswell caswell96 (1996) suggested are sources in an earlier evolutionary stage than OH-favoured sources. Only 7 sources (11%) have measured values of between 8 and 32 plus there are a further 3 lower limits (corresponding to a further 5% of the sample) which could place these sources in this range of . If does indeed trace the evolutionary status of sources as Caswell has suggested, then these results suggest that the sample observed here represent a particular mix of sources in different evolutionary stages distinct from that in the sample observed by Caswell. The high fraction of methanol favoured sources here suggesting that this sample contains a higher portion of younger objects.
6.2 OH maser flux densities
Figure 4 shows that nearly half of the detected sources show OH flux densities 1 Jy, which indicates two points. First it demonstrates how less sensitive observations (with detection limits of 1 Jy, e.g. Cohen et al. cohen88, 1988) could be missing a significant population of OH maser sources. More importantly it indicates that the sources observed here, which are believed to be in an early stage of formation with no observable UCHII regions, have lower OH flux densities than sources in more evolved objects associated with HII regions, where typical OH masers have flux densities 1 Jy.
Figure 6 shows that most of the OH maser sources prefer warmer radiation fields. This is probably because most of the FIR transitions which pump the OH maser are at wavelengths between 60m and 100m (Gray, Field & Doel 1992). The luminosity of the 1665 MHz line spans a factor of about 300 across the sample, but the origin of this scatter is unclear. However it is likely that individual maser spots are saturated, so for a given source luminosity (especially in the spectral region 60m 100m) the maser luminosity may reflect the number of maser sites or volume of masing gas (Gray priv. comm.).
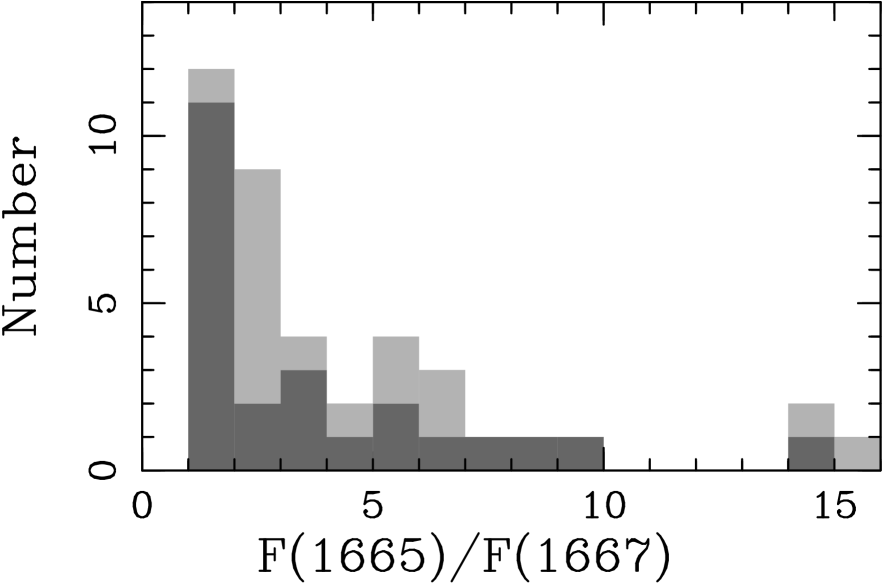
Models of OH maser emission show different physical conditions give rise to different combinations of OH maser lines. For example the Cragg et al. cragg02 (2002) models show that 1665 MHz masers trace a wider range of conditions that 1667 MHz masers. In particular gas kinetic temperatures K, and gas number densities cm-3 more strongly quench the emission at 1667 MHz than the emission at 1665 MHz suggesting that ratio of these lines fluxes may be a probe of the conditions in the gas, with masers seen in only the 1665 MHz line tracing warmer, denser gas.
For the sample observed here 28 sources were detected in both the 1665 MHz and 1667 MHz lines. For all except four of these objects the 1665 MHz line was stronger that the 1667 MHz line. The ratio of the flux density at 1665 MHz to that at 1667 MHz for these objects is shown in Figure 16. A further 16 objects were detected in only the 1665 MHz line. The 3-sigma lower limits on the 1665 MHz to 1667 MHz ratio for these sources are also shown the figure. The majority of sources have ratios of less , but there is a tail of sources (and limits) up to ratios as large as . Whether this range of intensity ratios reflects different physical conditions in these sources requires more detailed follow-up observations of the sources, particularly at higher angular resolution.
6.3 OH Maser Only Sources
There is a group of newly detected sources associated with only OH maser emission; namely IRAS 06382+0939, 184080348, 18540+0220, 184540158, 18511+0146, 18586+0106, 19118+0945, 19220+1432 and 20099+3640. The already known OH maser source IRAS 180182426 may also be in this group, although there has been no search for CH3OH maser emission towards it. However for only four of these objects, IRAS 180182426, 184540158, 19118+0945 and 19220+1432 are the OH masers positionally associated with the IRAS source. The OH masers towards the other sources are offset from the IRAS position and so it is possible that previous searches for other types of maser may have missed masers which are also offset from the IRAS position.
Interestingly, six of the ten OH-only objects, including IRAS 18018-2426 and IRAS 19118+0945, are from the Low subsample of M96 which contains sources which do not have UCHII region IRAS colours (WC89). However, four of these sources are associated with radio continuum emission and no equivalent observations has been carried out towards the other two sources, IRAS 06382+0939 and 19118+0945. M96 found a lower incidence of ammonia emission towards their Low sample than the High one and suggested that the Low sample contains sources in two different evolutionary stages. Some sources are in a stage before the existence of an UCHII region and others are in a stage after the HII region has evolved. The sources with evolved HII regions were suggested to be a very late HMPO stage and are expected to be associated with relatively small amounts of neutral gas. The absence of detectable ammonia towards IRAS 18408-0348, 19118+0945 (M96), 18454-0158 and 18540+0220 (S02) but the presence of only OH masers suggest that these objects could be relatively evolved.
6.4 1720 MHz only sources
There are five sources, IRAS 04579+4703444Note that the masers towards IRAS 04579+4703 are offset from the IRAS source., 182641152, 18553+0414, 19220+1432 and 20188+3928, which have OH maser emission, but only in the 1720 MHz transition. These sources, apart from IRAS 19220+1432, are associated with other maser types. They are, apart from IRAS 04579+4703, also associated with, at most, weak radio continuum emission ( 1 to 11 mJy). Isolated 1720-MHz masers are sometimes observed in star-forming regions in association with 6668-MHz methanol masers (e.g. Etoka, Cohen & Gray etoka05, 2005), an association which can be understood in terms of common pumping conditions (Cragg et al. cragg02 (2002)). Other objects associated with only 1720MHz OH maser emission are believed to be supernova remnants. Elitzur Elitzur76 (1976) suggests that the level inversion of these 1720 MHz masers is due to collisional excitation. Models suggest that the masers originate in the post-shock molecular gas behind C-type shocks (e.g. Lockett et al. Lockett99, 1999). However, these 4 sources appear to be star-forming regions. If the Elitzur Elitzur76 (1976) model is correct, the masers may be tracing post-shock gas towards these sources. Confirmation of this interpretation will require detailed follow-up of these objects.
7 Conclusions
The results of this survey confirm that OH masers are common, not only towards HII and UCHII regions as previously known, but also towards less evolved high mass young stars which, although luminous, have not yet significantly ionised their surroundings. Indeed towards these young sources OH masers are as common as the H2O and Class II CH3OH masers which have often been been cited as evidence of the youth of these sources. Compared to the OH masers associated with HII/UCHII regions, the OH masers towards these younger sources are weaker, suggesting that the OH maser flux density could be a crude evolutionary indicator.
There is no evidence within the observed sample for a luminosity difference between those sources with OH masers and those without masers. However, on average the sources with OH masers have significantly redder [100-12] and [60-12] IRAS colours than those which do not have OH masers, suggesting that the OH maser sources are more deeply embedded and hence younger. Similar colour differences are also seen for sources with H2O and CH3OH masers. However intercomparing the distribution of these colours for sources with each type maser shows them to be indistinguishable. For the sources in this study at least, there is no evidence that one or other of the types of maser in particular traces younger (or older) sources.
The velocity range of the maser emission suggests that the water maser sources may be divided into two groups, one of which shows narrow velocity spread of less than km s-1, while the other shows a much wider one, with sources which have H2O maser velocities spread over up to km s-1. This division may well reflect the suggestion by Torrelles et al. (torrelles97, 1997, torrelles98, 1998) that H2O masers can trace both molecular outflows and accretion disks perpendicular to the molecular outflow.
Comparing the OH and methanol maser peak fluxes, the majority of the sources are either methanol-favoured or OH-favoured with over 40% of the sources in each of these categories. Both the detection rate and velocity coverage of the maser emission suggests a close association between OH and CH3OH masers, which has also been reported by other authors (e.g. Caswell caswell98, 1998, and references therein; Szymczak & Kus 2000c, ; Szymczak & Gérard szymczak04, 2004). However understanding the exact origin of the OH masers and the detailed connection between the OH and CH3OH masers requires higher spatial resolution follow-up studies such as that of IRAS 20126+4104 by Edris et al. (2005). High resolution observations of some molecular outflow sources have shown that towards HMPOs the OH masers often arise from a circumstellar disc around the central source (Hutawarakorn, & Cohen hutawarakorn99, 1999; Hutawarakorn et al. hutawarakorn02, 2002; Hutawarakorn et al. hutawarakorn03, 2003; Edris et al. 2005). Such high resolution follow-up of the sources in this survey may therefore identify additional HMPOs with circumstellar disks and making use of the Zeeman sensitivity of the OH emission, measure the magnetic field within them.
Acknowledgements.
We would like to thank the staff at both Nançay and Green Bank for their invaluable help in obtaining the data presented here. We would also like to thank Malcolm Gray for helpful discussions. K.A.E and G.A.F would like to dedicate this paper to the memory of R.J. Cohen who passed away on 1 November 2006.References
- (1) Altenhoff, W.J., Downes, D., Pauls, T., Schraml, J. 1978, A&AS, 35, 23
- (2) Argon, A.L., Reid, M.J., Menten, K.M. 2000, ApJS, 129, 159
- (3) Bachiller, R. 1996, ARA&A, 34, 111
- (4) Benson, J.M. & Johnston, K.J. 1984, ApJ, 277,181
- (5) Beuther, H., Walsh, A., Schilke, P., Sridharan, T. K., Menten, K. M., Wyrowski, F. 2002, A&A, 390, 289
- (6) Beuther, H., Sridharan, T. K., Schilke, P., et al. 2002b, A&A, 383, 892
- (7) Beuther, H., Schilke, P., Menten, K.M. et al. 2002c, ApJ, 566, 945
- (8) Beuther, H., Schilke, P., Gueth, F. et al. 2002d, A&A, 387, 931
- (9) Beuther, H., Schilke, P., Gueth, F. 2004, ApJ, 608, 330
- (10) Beuther, H., Zhang, Q., Sridharan, T. K., Chen, J 2005, ApJ, 628, 800
- (11) Bourke, T.,L., Hyland, A.R., Robinson, G. 2005, ApJ, 625, 883
- (12) Braz, M.A., Lepine, L.R.D., Sivagnanam, P., Le Squeren, A.M. 1990, A&A, 236, 479
- (13) Brebner, G.C. 1988 PhD Thesis University of Manchester
- (14) Bronfman, L., Nyman, L.A., May, J. 1996, A&AS, 115, 81
- (15) Caswell, J.L., Haynes, R.F. 1983, Aust.J.Phys., 36, 361
- (16) Caswell J. L., Vaile R. A., Forster J. R . 1995, MNRAS, 277, 210
- (17) Caswell, J.L. 1996, MNRAS, 279, 79
- (18) Caswell, J.L. 1997, MNRAS, 289, 203
- (19) Caswell, J.L. 1998, MNRAS, 297, 215
- (20) Cesaroni, R., Felli, M., Testi, L., Walmsley, C. M., Olmi, L. 1997, A&A, 325, 725 (C97)
- (21) Churchwell, E., 2002, Annu. Rev. Astron. Astrophys. 40, 27
- (22) Cohen, R. J., Rowland, P.R., Blair, M.M. 1984, MNRAS, 210, 425
- (23) Cohen, R. J., Baart, E.E., Jonas, J.L. 1988, MNRAS, 231, 205
- (24) Cohen, R.J. 1989, Rep. Prog. Phys., 52, 881
- (25) Cohen, R.J., Brebner, G.C., Hutawarakorn, B., Gasiprong, N., IAU General Assembly, 2003 IAUS, 221P, 168C
- (26) Cragg, D. M., Sobolev, A. M., Godfrey, P. D. 2002, MNRAS, 331, 521
- (27) Cragg, D. M., Sobolev, A. M., Godfrey, P. D. 2005, MNRAS, 360, 533
- (28) Edris, K.A., Fuller, G.A., Cohen, R.J., Sandra, E., 2005 A&A, 343, 213
- (29) Elitzur, M. 1976, ApJ, 203, 124
- (30) Elitzur, M., de Jong, T. 1978, A&A, 67, 323
- (31) Etoka, S. Cohen, R.J., & Gray, M.D. 2005, MNRAS, 360, 1162
- (32) Foster, J.R., & Caswell, J.L. 2000, ApJ, 530, 371
- (33) Galt, J 2004, AJ, 127, 3479
- (34) Garay, G., Lizano, S. 1999, PASP, 111, 1049
- (35) Genzel, R. & Downes, D. 1977, A&AS, 30, 145
- (36) Gray, M. D., Field, D., & Doel, R. C. 1992, A&A, 262, 555
- (37) Gregory, P.C., Condon, J.J. 1991, ApJS, 75, 1011
- (38) Griffith, M.R., Wright, A.E., Burke, B.F., Ekers, R.D. 1994, ApJS, 90, 179
- (39) Haynes, R.F., Caswell, J.L., Simons, L.W.J. 1979, Aust. J. Phys. Astrophys. Suppl. 48, 1
- (40) Hofner, P., Cesaroni, R., Rodríguez, L. F., & Marti J. 1999, AA, 345, 43
- (41) Hughes, V.A., & Macleod, G.C. 1993, AJ, 105, 1495
- (42) Hutawarakorn, B., Cohen, R. J. 1999, MNRAS, 303, 845
- (43) Hutawarakorn, B., Cohen, R. J., Brebner, G. C. 2002, MNRAS, 330, 349
- (44) Hutawarakorn, B., Cohen, R. J. 2003, MNRAS, 345, 175
- (45) Jenness, T., Scott, P.F., Padman, R. 1995, MNRAS, 276, 1024
- (46) Lada, C.J. 1976, ApJS, 32, 603
- (47) Liechti, S. & Wilson, T.L. 1996, A&A, 314, 615
- (48) Lockett, P., Gauthier, E., Elitzur, M. 1999, ApJ, 447, 211
- (49) Marsalkova, P. 1974, Ap&SS, 27, 3
- (50) Minier, V., Conway, J. E., Booth, R. S. 2001, A&A, 369, 278
- (51) Minier, V., Burton, M.G., Hill, T., Pestalozzi, M.R., Purcell, C.R., et al 2005, A&A, 429, 945
- (52) Miralles, M.P., Rodríguez, L.F., & Scalise, E. 1994, ApJS, 92, 173
- (53) Molinari, S., Brand, J., Cesaroni, R., Palla, F. 1996, A&A, 308, 573
- (54) Molinari, S., Brand, J., Cesaroni, R., Palla, F., Palumbo, G.G.C. 1998, A&A, 336, 339
- (55) Molinari, S., Testi, L., Rodríguez, L., Zhang, Q. 2002, ApJ, 570, 758
- (56) Moore, T.J.T., Mountain, C.M., Yamashita, T., & Selby, M.J. 1988, MNRAS, 234, 95
- (57) Moscadelli, L., Cesaroni, R., Rioja, M. J. 2000, A&A, 360, 663 (MCR)
- (58) Palagi, F., Cesaroni, R., Comoretto, G., Felli, M., Natale, V. 1993, A&AS, 101, 153
- (59) Palla, F., Brand, J., Cesaroni, R., Comoretto, G., Felli, M., 1991, A&A, 246, 249 (P91)
- (60) Pestalozzi, M. R., Minier, V., & Booth, R. S. 2005, A&A, 432, 737
- (61) Richards, P.J., Little, L.T., Toriseva, M., Heaton, B.D., 1987, MNRAS 228, 43
- (62) Schutte, A.J., Van der Walt, D.J., Gaylard, M.J., Macleod, G.C., 1993, MNRAS, 261, 783
- (63) Shepherd, D.S., Nürnberger, D.E.A., Bronfman, L. 2004, ApJ, 602, 850
- (64) Shu, F.H., Adams, F.C., Lizano, S. 1987, ARA&A, 25, 23
- (65) Simon, M., Cassar, L., Felli, M., Fischer, J., Massi, M., Sanders, D. 1984, ApJ, 278, 170
- (66) Slysh, V.I., Dzura, A.M., Val’tts, I.E., Gérard, E., 1994, A&AS 106, 87
- (67) Slysh, V.I., Dzura, A.M., Val’tts, I.E., Gérard, E., 1997, A&AS 124, 85
- (68) Slysh, V.I., Val’tts, I.E., Kalenskii, S.V., et al. 1999, A&AS 134, 115
- (69) Sridharan, T. K., Beuther, H., Schilke, P., Menten, K. M., Wyrowski, F. 2002, ApJ, 566, 931
- (70) Szymczak, M., & Gérard, E. 2004, A&A, 414, 235
- (71) Szymczak, M., Hrynek, G., & Kus, A.J. 2000, A&AS, 143, 269 (SHK2000)
- (72) Szymczak, M., Kus, A.J. & Hrynek, G. 2000b, MNRAS, 312, 211
- (73) Szymczak, M., Kus, A.J. 2000, A&AS, 147, 181
- (74) Tofani, G., Felli, M., Taylor, G. B., Hunter, T. R. 1995, A&AS 112, 299
- (75) Torrelles J.M., Gómez J.F., Rodríguez L.F., et al., 1997, ApJ 489, 744
- (76) Torrelles J.M., Gómez J.F., Rodríguez L.F., et al., 1998, ApJ 505, 756
- (77) Val’tts I.E., Dzyura, A.M., Kalenskii, S.V., Slysh, V.I., Bus, R., Vinnberg, A. 1995, ARep, 39, 18
- (78) Verdes-Montenegro, L., Torelles, J.M., Rodriguez, L.F., Anglada, G., Lopez, R., Estalella, R., Cantó, J., Ho, P.T.P., 1989, ApJ, 346, 193
- (79) Walsh, A.J., Burton, M.G., Hyland, A.R., & Robinson, G. 1998, MNRAS, 301, 640
- (80) Williams, S.J., Fuller, G.A., and Sridharan, T.K. 2004, A&A, 417, 115
- (81) Wood, D.O.S., & Churchwell, E. 1989, ApJS., 83,119 (WC89)
- (82) Wright, A.E., Griffith, M.R., Burke, B.F., Ekers, R.D. 1994, ApJS, 91, 111
- (83) Wu, Y., Wei, Y., Zhao, M., Shi, Y., Yu, W., Qin, S., Huang, M. 2004, A&A, 426, 503
- (84) Zhang, Q., Hunter, T. R., Sridharan, T. K. 1998, ApJ, 505, 151
- (85) Zhang, Q., Hunter, T. R., Brand, J., et al. 2005, ApJ, 625, 864
The figures above are available as a separate file from http://www.mananchester.ac.uk/jodrellbank/gaf/Papers/6280_onlinefigs.pdf
Appendix A Notes on individual sources where OH masers were detected
IRAS 05137+3919. This source also shows water maser emission (P91). This IRAS source is one of the sources studied in detail at high angular resolution by Molinari et al. molinari02 (2002) at millimeter and centimeter wavelengths in both continuum and spectral lines. There is a core which shows radio continuum emission detected at 3.6 cm wavelength (VLA1) and mm continuum emission detected at 3.4 mm wavelength (Figure 1 of Molinari et al. molinari02, 2002). At 2.2m the IRAS source is resolved in to a cluster of objects (Molinari et al. molinari02, 2002).
IRAS 05274+3345 (AFGL5142). This source is also associated with H2O (Verdes-Montenegro et al. verdes89, 1989; P91) and CH3OH (SHK2000) masers. OH maser emission was previously reported towards this source by Braz et al. braz90 (1990). The OH lines detected towards this source, namely 1665, 1667 and 1612 MHz, have varied since the Braz et al. observations. While the 1665 MHz line has strengthened, the other two lines have weakened.
IRAS 05358+3543 (G173.481+2.445, S231, S233IR). This source has been mapped at high angular resolution, 1.5, with the VLA (see Figure 27 of Argon et al. argon00, 2000). The NançayGBT observations detected maser components in the two main lines, 1665 and 1667 MHz, in both the left and right circular polarisations, while only four components were reported by Argon et al. in the (LHC) 1665 MHz line. Two components of these four coincide very well with the IRAS source and the others are just 0.2 south. Szymczak et al. 2000b failed to detect maser emission at the 4765 MHz OH line towards this source. The IRAS source is also associated with H2O (S02) and a strong CH3OH masers (Galt galt04, 2004 and references therein). No radio continuum detection has been reported towards IRAS 05358+3543 in S02. On the other hand recent submillimeter continuum maps revealed a total of four sources (Williams et al. williams04, 2004; Minier et al. Minier05, 2005). One of these sources is coincident with the IRAS source and OH maser and 40 northeast another submm source harbours the CH3OH maser, exhibits midinfrared emission and coincides with one of the three 1.2mm continuum sources detected by Beuther et al. 2002b (see figure 4 of Minier et al. Minier05, 2005). High angular resolution observations with Plateau de Bure Interferometer by Beuther et al. 2002d reveal that this region contains at least three molecular outflows.
IRAS 05382+3547. The OH maser towards this source was discovered by Szymczak & Kus 2000c , but no position for it was measured. GBT observations show that the 1665 MHz OH maser components detected by Szymczak & Kus centred at velocities -27 and -22 km s-1are offset from the IRAS position by 3. GBT observations found new components centred at velocities -20 and -24.7 km s-1 offset 30 northwest of the IRAS source. This source is also associated with a CH3OH maser (SHK2000) with velocity centred at 24.1 km s-1close to one of the OH maser components.
IRAS 06056+2131. Cohen et al. cohen88 (1988) detected OH maser emission at 1665 MHz only. The NançayGBT observations found emission at 1667 and 1720 MHz as well.
IRAS 175272439. This source is also coincident with a H2O maser (P91).
IRAS 180182426 (G6.0491.447, M8E). This OH maser was first detected by Cohen et al. cohen88 (1988) and was mapped by Argon et al. argon00 (2000). These previous observations detected emission at 1665 MHz only, while NançayGBT detected maser emission in the 1667 MHz line as well. The OH maser emission is variable towards this source (Cohen et al. cohen88, 1988). The water maser was detected towards this source by Lada et al. lada76 (1976) but P91 failed to detect any water maser emission. This source is known to be associated with a compact HII region (Simon et al. Simon84, 1984). Molinari et al. molinari02 (2002) detected 6.75 and 4.9 mJy continuum radio emission at 2 and 6 cm wavelengths respectively. The maser towards this source is not polarized which is unusual (e.g. Cohen cohen89, 1989). The disappearance of H2O masers and the association of OH maser with compact HII region suggest that this may be in a late stage of star formation where the UCHII region has expanded and only the OH maser emission is surviving. No CH3OH maser towards this source has been reported.
IRAS 180242119. The newly detected OH main line maser emission towards this source has a relatively wide velocity range, covering km s-1. An H2O maser was also detected by P91. A relatively strong CH3OH maser of 100 Jy was recently detected by Galt galt04 (2004). No molecular outflow was detected towards this source by Zhang et al. zhang05 (2005).
IRAS 180482019. This source shows very weak OH maser emission in both main lines. Water (P91) and CH3OH (Schutte et al. Schutte93, 1993) masers are also associated with this source.
IRAS 180891732. This source is common in the S02 sample and the High subsample of M96. The OH maser emission was detected by Cohen et al. cohen88 (1988) in the 1665 MHz line only. The Argon et al. argon00 (2000) VLA map shows several 1665MHz OH maser components in three different positions. We detected maser emission at 1667 MHz as well. This source is also associated with H2O (P91) and CH3OH (SHK2000) masers and is associated with very weak 3.6 cm continuum emission, 0.9 mJy (S02). Recent high angular resolution submillimeter observations in various spectral lines by Beuther et al. beuther05 (2005) detect a massive rotating structure perpendicular to an emanating outflow which is likely associated with the central accretion disk.
IRAS 180901832. This source also shows a relatively strong, 77 Jy, CH3OH maser (SHK2000) and weak OH maser emission in the two main lines.
IRAS 181021800. This source is also associated with radio continuum emission, 44 mJy, at 3.6 cm wavelength (S02).
IRAS 181441723. This is a relatively strong OH maser source in the main lines. There is a significant gap, 13 km s-1 between the central velocities of strongest components in the 1665 and 1667 MHz lines. The IRAS source is also associated with CH3OH (SHK2000) and H2O (P91) masers. Radio continuum emission was also detected towards this source at 2 and 6 cm wavelengths (Molinari et al. molinari98, 1998).
IRAS 181821433. The H2O and CH3OH masers associated with this source were mapped in high angular resolution, 1 by Beuther et al. beuther02 (2002). Only one CH3OH maser component was detected, while several H2O maser components were detected. The H2O and CH3OH positions are coincident with the 1.2 mm continuum emission detected by Beuther et al. 2002b . Extremely weak radio continuum emission has been detected by Foster & Caswell Foster00 (2000) (0.3 mJy at 3.5 cm) and S02 (1 mJy at 3.6 cm). An outflow was detected towards this source by Beuther et al. 2002c .
IRAS 182361205. This IRAS source is also associated with CH3OH (SHK2000) and H2O (P91) masers.
IRAS 182641152. This source shows maser emission at the 6.7 GHz CH3OH and 22 GHz H2O maser lines (SHK2000 and P91 respectively). No radio continuum emission, mJy, is detected at 3.6 cm wavelength (S02). An outflow was detected towards this source by Beuther et al. 2002c .
IRAS 182781009. This source is also associated with a CH3OH maser (SHK2000). No radio continuum emission was detected at 2 and 6 cm wavelengths by Molinari et al. molinari98 (1998).
IRAS 182900924. This source is also associated with H2O and CH3OH masers (S02). The mm observations (Beuther et al. 2002b, ) towards this source show two peaks separated by 12 with the masers coincident with one of them. This source is also associated with radio continuum emission at 3.6 cm detected by S02.
IRAS 183100825. This source is the only source in our sample associated only with the 1667MHz of OH maser lines. It is also associated with a CH3OH maser detected by SHK2000 and mapped by Beuther et al. beuther02 (2002). The methanol maser is offset from the IRAS source and coincident with one of two mm and cm peaks (see Figure 1 of Beuther et al. beuther02, 2002).
IRAS 183160602. This source is also associated with very strong H2O (725.83 Jy, P91), and CH3OH (178 Jy, SHK2000) masers. This source is known to be associated with an UCHII region (Jenness et al. Jenness95, 1995) and molecular outflow (Wu et al. wu04, 2004). The OH maser emission is detected in the main lines while the satellite lines show conjugate behaviour with thermal emission at 1612 MHz and absorption at 1720 MHz.
IRAS 183450641. Towards this star-forming region only the 1612 MHz OH maser line was detected. The IRAS source is associated with strongly, variable CH3OH masers (SHK2000) which coincide with a mm continuum peak (Beuther et al. beuther02, 2002). Also freefree emission at 3.6 cm (S02) and an outflow have been detected towards this IRAS source (Beuther et al. (2002c, )).
IRAS 183600537. In addition to the OH main line masers detected here, this source is also associated with relative strong H2O maser emission, 92.73 Jy (P91).
IRAS 183850512. This source is also associated with a relatively strong H2O maser emission, 200 Jy (S02). Several H2O maser components coincide with a mm continuum peak (Beuther et al. beuther02, 2002). Radio continuum emission of 29 mJy was measured by S02 at 3.6 cm.
IRAS 184400148. This source is also associated with a CH3OH maser (SHK2000; Walsh et al. walsh98, 1998). The CH3OH maser components coincident with a 1.2 mm, 3.6 cm peak and midinfrared source (Beuther et al. beuther02, 2002; S02). A tentative detection of H2O maser emission is reported by S02.
IRAS 184540158. This is one of the sources which has an OH maser but does not have any other known masers. S02 observations did not detect H2O or CH3OH maser emission. This source is associated with 1.2 mm continuum emission as well as radio continuum emission (Beuther et al 2002b, and S02 respectively).
IRAS 18463+0052. Only 1612 MHz line OH masers are detected towards this source with a line profile with peaks at 67 and 92 km s-1, suggesting this source is an OH/IR star rather than a star-forming region. There are no H2O or CH3OH masers associated with the IRAS source.
IRAS 18488+0000. This is one of the common sources in the S02 sample and the High subsample of M96. This source is associated with a variable CH3OH maser (SHK2000, and references therein). Although not detected by P91, H2O maser emission has been detected by S02. The water maser is coincident within few arcsecond with a midinfrared source but offset from a millimetre continuum source (Beuther et al. beuther02, 2002). Relatively strong radio continuum emission, 194 mJy, has been detected towards this source (S02). Our NançayGBT observations detect OH maser emission in the two main lines which is coincident (within 30) with the 1.2 mm emission source rather than other tracers.
IRAS 18507+0121. This source is roughly 11 north from G34.257+0.154 (or G34.3+0.2) which shows strong OH maser emission in the main lines as well as 1720 MHz satellite line (Argon et al. (argon00, 2000). G34.257+0.154 also has H2O masers and is classified as an HII region (Benson & Johnston benson84, 1984; Genzel & Downes genzel77, 1977). The NançayGBT observations detect new (relatively weaker) OH maser emission associated with the IRAS source in the main lines. The IRAS source is also associated with H2O (P91) and CH3OH (SHK2000) masers. IRAS 18507+0121 region was studied in detail by Shepherd et al Shepherd04 (2004) at several millimeter and nearinfrared (NIR) wavelengths. Shepherd et al detected two compact molecular cores separated by 40 north-south. The northern molecular core contains a newly discovered, deeply embedded, B2 protostar surrounded by several hundred solar masses of warm gas and dust, G34.4+0.23 MM. Based on the presence of warm dust emission and the lack of detection at NIR wavelengths, Shepherd et al suggest that G34.4+0.23 MM may represent the relatively rare discovery of a massive protostar (analogous to a lowmass ”Class 0” protostar). The southern molecular core is associated with an NIR cluster of young stars and an UCHII region, G34.4+0.23 (detected by Miralles, Rodríguez & Scalise Miralles94, 1994), with a central B0.5 star. Shepherd et al to suggest an upper limit on the age of the IRAS 18507+0121 star–forming region of 3 Myr. This IRAS source is not associated with molecular outflow (Zhang et al. zhang05, 2005).
IRAS 18527+0301. This source was searched for OH masers by Szymczak & Kus 2000c to a rms noise level of 0.2 Jy but none were detected. The present observations, with better sensitivity (0.02 Jy), detected weak emission in the two main lines. Methanol maser emission was detected by SHK2000 in the same OH velocity range. No radio continuum emission at 6 cm was detected by Molinari et al. molinari98 (1998).
IRAS 18553+0414. This source is also associated with H2O maser emission (S02) which is coincidence with a millimeter continuum source (Beuther et al. 2002b, ).
IRAS 18566+0408. This common source in the S02 sample and the High subsample of M96 is also associated with CH3OH maser emission (S02; SHK2000). The H2O maser emission was newly detected by S02, while not detected by P91. The H2O masers are in better agreement with a millimeter continuum (Beuther et al. beuther02, 2002). The newly detected OH maser emission also seemingly coincides with the mm source mapped by Beuther et al. 2002b . An outflow was detected by Beuther et al. 2002c and S02 place an upper limit of 1 mJy on the 3.6 cm radio continuum flux from any source in this region.
IRAS 19035+0641 (G40.6220.137). This source is one of OH maser sources mapped with the VLA by Argon et al. argon00 (2000). Several components, at different velocities in the range of 25 to 36 km s-1, were detected in the two main lines and spread over 1 arcsec (figure 14 of Argon et al. argon00, 2000). Our NançayGBT observations show similar emission although the flux density of the components has varied since the Argon et al. observations. The flux density of the 1667 MHz RHC compoment centered at velocity 27.39 km s-1 has rocketed up from 0.44 to 22.3 Jy. The IRAS source is also associated with H2O and CH3OH masers (S02, SHK2000 and references therein). The H2O and CH3OH masers are coincident with a midinfrared and 1.2mm continuum emission sources (see figure 1 of Beuther et al. beuther02, 2002). The UCHII region, detected at 6cm by Hughes & Macleod Hughes93 (1993) and 3.6cm by S02, shows weak emission, of 3.8 and 4 mJy respectively. An outflow was detected towards this source by Beuther et al. 2002c .
IRAS 19092+0841. This source, also associated with H2O (P91) and CH3OH (SHK2000) masers, is one of the newly detected of OH masers. Radio continuum emission of 2.74 and 1.04 mJy have been detected by Molinari et al. molinari98 (1998) at the 2 and 6cm wavelengths respectively.
IRAS 19118+0945. This is one of the sources with only OH masers. No H2O or CH3OH masers have been detected towards this source (P91; SHK2000).
IRAS 19217+1651. This source is also associated with CH3OH masers and recently detected H2O masers as well as radio continuum emission (S02). One mm source was detected by Beuther et al. 2002b 5 north of the IRAS source and consistent with the H2O and CH3OH masers and a midinfrared source. The radio continuum source is 5 west of the mm source. The detected OH maser emission seems not consistent with any of the previous sources, being located 1 to the south. Beuther et al. beuther04 (2004) studied this region in detail with high spatial resolution using Plateau de Bure Interferometer in the CO J=21 and SiO J=21 transitions. They conclude that the highmass region IRAS 19217+1651 exhibits a bipolar outflow and the region is dominated by the central driving source.

IRAS 19220+1432. The OH maser towards this source is contaminated by the nearby OH maser source W51. However the GBT map (Figure 17) shows that there is a maser emission in the 1720MHz (RHC) line associated with the IRAS position. This is better illustrated in Figure 21 where the spectra from the map are plotted. The contamination of W51 maser is clear in the lower right corner of the map, but a component centred on the IRAS source is also visible. There is no other maser types associated with this source (S02). An flux density of 11 mJy in the radio continuum was detected by S02 at 3.6cm wavelength.
IRAS 19374+2352. This source is also associated with a H2O maser (P91), but no CH3OH maser emission was detected by SHK2000. Freefree emission at 64.4 mJy was detected by Molinari et al. molinari98 (1998).
IRAS 19388+2357. This source was searched by Szymczak & Kus 2000c for OH maser but no emission was found. The observations here detect OH maser emission in the 1665MHz line spread over velocity range 34 to 39 km s-1. On the other hand, CH3OH maser emission, although detected by Schutte et al. Schutte93 (1993) in 1992 and Slysh et al. Slysh99 (1999) in 1995, was not detected in later observations by SHK2000 in 1999. This source is also associated with H2O maser (P91) and freefree emission (Molinari et al. molinari98, 1998).
IRAS 19410+2336. This source is also associated with H2O and CH3OH masers (S02; SHK2000). Near the H2O maser source, a radio continuum emission of 1 mJy was detected by S02. Beuther et al. 2002b 1.2mm continuum observations detect one source consistent with a midinfrared source. The 1665MHz OH maser emission detected close to the midinfrared source. An outflow was detected towards this source by Beuther et al. 2002c .
IRAS 20062+3550. This source was detected by Szymczak & Kus 2000c at the velocity of 2.4 km s-1 in the 1665MHz line. The observations reported here detect a component in the same line over the velocity range 1 to 2.2 km s-1. Water and CH3OH masers have also been detected towards this source (P91; Slysh et al. Slysh99, 1999; SHK2000). No radio emission has been detected at 6 cm towards this source by Molinari et al. molinari98 (1998). This source is one of sources studied in detail by Molinari et al. molinari02 (2002) with the Owens Valley Radio Observatory (OVRO) millimeter wave array. Four distinct cores were identified in the HCO+ J=10. Two of them are also detected in H13CO+ J=10. One core also has a 3.4 mm counterpart and is likely the most massive member of this cluster (Molinari et al. molinari02, 2002).
IRAS 20126+4104. This source has a luminosity of L⊙ and is perhaps the best studied example of a massive protostar associated with a Keplerian disk and a jet/outflow system (Cesaroni et al. cesaroni97, 1997, 1999; Hofner et al. hofner99, 1999; Zhang et al. zhang98, 1998; Cohen et al. cohen88, 1988; Tofani et al. tofani95, 1995; Moscadelli et al. moscadelli00, 2000). The source is associated with OH, H2O and CH3OH masers. Observations of the water masers using the VLA with angular resolution of identified three emission regions (Tofani et al. tofani95, 1995). Moscadelli et al. moscadelli00, 2000 resolved two of these into 26 unresolved spots using the VLBA. The velocity and spatial structure of these spots were well fitted by a model with the spots arising at the interface between a jet and the surrounding molecular gas. Two features of OH masers were first detected in the 1665MHz line by Cohen et al. cohen88 (1988). More recently mapping of the OH and CH3OH masers at high angular resolution using MERLIN, Edris et al. Edris05 (2005) showed that OH and methanol masers appear to trace part of the circumstellar disk around the central source.
IRAS 20188+3928. Only the 1720 MHz of four OH lines is detected towards this source. The source is also associated with a H2O maser (P91) and a 2.86 Jy 6 cm radio continuum source (Molinari et al molinari98 (1998)).
IRAS 20227+4154. This source is associated with a H2O maser (P91) but no CH3OH maser emission was detected by SHK2000. Only the 1665 MHz OH maser line has been detected by our NançayGBT observations.
IRAS 22198+6336. This source is also associated with a H2O maser emission (P91) but no CH3OH maser emission was detected by SHK2000. No radio emission was detected by Molinari et al molinari02 (2002) at 6 cm wavelength. The two main lines of OH maser were detected by our NançayGBT observations.
IRAS 22272+6358. Although not detected in 1993 to a 3 upper limit of about 0.15 Jy (Slysh et al. Slysh94, 1994), OH emission was found in 1999 in both main lines by Szymczak & Kus 2000c . This suggests considerable variations of the source. Approximately three years after Szymczak & Kus observations, the NançayGBT observations show that the OH masers have varied. At the 1665 MHz (LHC), a new component was detected centred at 8.46 km s-1 and the velocity of a bright component has slightly varied by 1.2 km s-1 (from 10.9 to 12.12 km s-1 ). The velocity range of the OH emission is similar to that observed for the 6.7 GHz methanol maser (SHK2000). No H2O maser was detected by P91.
IRAS 23139+5939. This sources is very similar to IRAS 183450641. Only the 1612 MHz OH maser line has been detected and the source is also associated with 3.6cm radio continuum emission (S02). It is also associated with a H2O maser (S02) which coincides with a mm continuum emission and mid-infrared sources (Beuther et al. beuther02, 2002). An outflow along the line of sight was detected by Beuther et al. 2002c .