Abundant crystalline silicates in the disk of a very low mass star111Based partly on observations obtained at the ESO NTT at La Silla (Chile) for program 276.C5031.
Abstract
We announce the discovery of SST-Lup3-1, a very low mass star close to the brown dwarf boundary in Lupus III with a circum(sub)stellar disk, discovered by the ‘Cores to Disks’ Spitzer Legacy Program from mid-, near-infrared and optical data, with very conspicuous crystalline silicate features in its spectrum. The Spectral Energy Distribution of the system is fit with stellar and disk models to study the disk structure. SST-Lup3-1 is a M5.5 star with a luminosity of 0.08 L⊙ (at an assumed distance of 200 pc), a mass of 0.10 M⊙, a radius of 1.09 R⊙, and an age of 1 Myrs. It is the first of such objects with a full 5 to 35 m spectrum taken with the IRS and it shows strong 10 and 20 m silicate features with high feature to continuum ratios and clear crystalline features out to 33 m. The mass of its flared disk is constrained to lie between 2 and M⊙ (80–0.03 M⊕ masses) and the dust in the upper layer has a crystalline silicate grain fraction between 15% and 33%, depending on the assumed dust continuum. The availability of the full Spitzer infrared spectrum allows an analysis of the dust composition as a function of temperature and position in the disk. The hot (300 K) dust responsible for the 10 m feature consists of a roughly equal mix of small ( m) and large ( m) grains, whereas the cold (70 K) dust responsible for the longer wavelength silicate features contains primarily large grains (m). Since the cold dust emission arises from deeper layers in the inner ( 3 AU) disk as well as from the surface layers of the outer (3-5 AU) disk, this provides direct evidence for combined grain growth and settling in the disk. The inferred crystalline mass fractions in the two components are comparable. Since only the inner 0.02 AU of the disk is warm enough to anneal the amorphous silicate grains, even the lowest fraction of 15% of crystalline material requires either very efficient mixing or other formation mechanisms.
1 Introduction
Ground based observations of young brown dwarfs in star forming clouds have shown the presence of significant infrared (IR) excesses (e.g., Comerón et al., 2000; Jayawardhana et al., 2003) and broad H emission lines (e.g., Muzerolle et al., 2003; Natta et al., 2004) suggestive of the presence of circum(sub)stellar disks and accretion in these very low-mass objects. Also, recent ground-based mid-IR photometry has shown hints of grain growth and dust settling from the silicate emission features of some of these disks (Sterzik et al., 2004; Apai et al., 2004). Observations with the Spitzer Space Telescope (SST or Spitzer) permit the first detailed studies of the geometry of such disks (e.g., Allers et al., 2006) and of their silicates (e.g., Furlan et al., 2005) which provide interesting comparisons with the dust evolution in disks around higher-mass T Tauri and Herbig Ae/Be stars.
It is known that the presence and intensity of amorphous silicate features in T Tauri stars anti-correlates with the size of the grains in the disk surface layers (Bouwman et al. 2001; van Boekel et al. 2003, 2005; Przygodda et al. 2003; Kessler-Silacci et al. 2006). Apai et al. (2005) analyzed Spitzer spectra of the 10 m silicate feature of 6 brown dwarfs and very low mass stars with disks in Chamaeleon I and found an anticorrelation between the crystallinity of the silicates and the degree of disk flaring, which suggests an evolutionary process in which the disk flattens and the dust crystallizes as the grains grow and settle to the disk mid-plane. This explanation, although very attractive, is based on observations of only the 10 m silicate feature, with low peak to continuum ratios and with spectra dominated by either crystalline or amorphous features but not in combination.
In the present paper we announce the discovery of SST-Lup3-1, a new very low mass star close to the brown dwarf boundary with a disk in the Lupus III dark cloud, and analyze the properties of its disk from its Spectral Energy Distribution (SED). Its Spitzer InfraRed Spectrograph (IRS) spectrum over the entire 5 – 35 m range shows strong amorphous and crystalline silicate emission features and is presented and analyzed here to extract the mineralogical composition of the dust in the disk.
2 Target selection and observations
The ‘Cores to Disks’ (c2d) Spitzer Legacy program (Evans et al., 2003) has mapped five nearby large molecular clouds with IRAC and MIPS at 6 wavelengths between 3.6 and 70 m. Photometry was extracted for all point sources and band-merged with the 2MASS catalog. For more information see the Delivery Documentation of the c2d project (Evans et al., 2006). The area has also been surveyed with the 2.2m telescope of the European Southern Observatory (ESO) and the Wide Field Imager (WFI) instrument in the , , and broad-band filters to complement the Spitzer data and study the very low-mass stellar population (Comerón et al. in prep.). Detailed descriptions of the observations of Lupus by the c2d Team can be found in Mundy et al. (in prep.) for IRAC and in Chapman et al. (2006) for MIPS.
Using the band-merged catalog of the Lupus III dark cloud, we have discovered a rich population of IR excess sources with luminosities in the substellar domain according to the Baraffe et al. (1998) pre-main sequence tracks. Constructing their SEDs with WFI , 2MASS plus IRAC and MIPS fluxes from 0.6 to 70 m and comparing them with stellar emission models, we find that some of the IR excesses at near and mid IR wavelengths may be explained with the presence of circum(sub)stellar disks. We selected one of them with optical and near IR colors characteristic of a late M-type dwarf which could be observed with the Spitzer IRS. The object, with coordinates 16h11m59.9s, -38o23′37.5′′ (J2000), is named SSTc2d J161159.9-382337. We name it SST-Lup3-1 (catalog ) following Comerón et al. (2003), and nickname it Veronica’s star (catalog ).
SST-Lup3-1 was observed with the IRS onboard Spitzer on 14-08-2005, with AOR Key 0015737856, in both short low (SL) and long low (LL) modules. The total wavelength coverage is 5 – 35 m and the integration times were 120 and 620 s for SL and LL, respectively. Data reduction started from the Basic Calibrated Data images, pipeline version S12.4.0. The processing includes bad-pixel correction, extraction, defringing, and order matching using the c2d analysis pipeline (Kessler-Silacci et al. 2006; Lahuis et al. 2006).
In addition, an optical spectrum of SST-Lup3-1 was obtained with the EMMI instrument on ESO’s New Technology Telescope. The object was observed with the grism # 6, which provides a spectral resolving power of 1,500 with the 1′′ slit, and with 9 minutes of integration time. The spectrum was reduced using standard IRAF tasks for extraction, wavelength calibration, and relative flux calibration within the ‘onedspec’ package. Relative flux calibration was performed by using the spectrum of the spectrophotometric standard Vir as a reference.
3 Stellar parameters
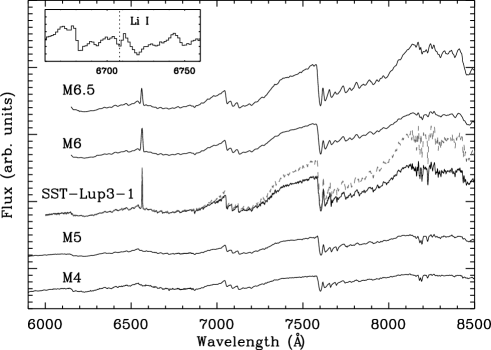
Figure 1 shows the full optical spectrum of SST-Lup3-1 compared to spectra of young M-type stars. It is clear that the object belongs to an intermediate class between the M5 and M6 spectral types and that the moderate extinction towards the source makes it resemble a colder M6.5 brown dwarf. The TiO band-head absorptions at 6200, 7100 and 7600 Å (Kirkpatrick et al., 1991) and the slope of the continuum around 7500 Å were used for the spectral typing after the extinction correction.
We subsequently used an improved version of the method by Frasca et al. (2003), in which the spectrum is compared with a grid of standard spectra of M to L dwarfs from Kirkpatrick et al. (1991) with different extinctions to get the best fit to both parameters simultaneously. This yields a spectral type of M5.5 with an error of less than 0.5 spectral subclasses and an extinction of =2.2 mag. A similar analysis with the method by Guieu et al. (2006), which uses instead an average of dwarf and giant M to L field standards to better approach the emission of young stars, yields a spectral type of M5.75 and =2.08 mag. The similarity of these two results gives confidence in our determination of the spectral type of the object.
The spectrum of SST-Lup3-1 shows H (6563 Å) in emission with an equivalent width of 16.2 Å. The profile is too narrow (FWHM 5 Å) to be a signature of disk accretion and is most likely related to chromospheric activity (White & Basri 2003, Jayawardhana et al. 2002). However, its presence in the spectrum, as well as in the other M6 and M6.5 young stars shown in the figure, indicates the youth of the object and confirms its membership to the Lupus molecular cloud. The detection of the Li i absorption line at 6708 Å with an equivalent width of 0.5 Å supports the young nature of the object.
The SED of the object is constructed using the photometry in Table 1 and compared with StarDusty stellar models (Allard et al., 2000). Following Luhman et al. (2003), a young M5.5 star has an effective temperature of 3057 K and intrinsic color = 1.88. Given the observed color of 2.00 we derive an extinction from the optical photometry of using the extinction law of Rieke & Lebofsky (1985). The difference in the extinction determinations from the optical photometry and spectrum is larger than their uncertainties and cannot be due to the object having surface gravity of a giant or dwarf. However it would disspaear if the star would have an M5 spectral type, in which case 2, consistent with the spectroscopic result. Possible reasons for this discrepancy are the scatter in the intrinsic colors of M-type stars, that the object is variable at optical wavelengths, as seen in other very low mass stars (Caballero et al., 2004), that it presents bluer optical colors than those expected for its spectral type as in Luhman et al. (1998), or that the standard interstellar extinction law is not valid for the Lupus dark cloud.
The difference in extinctions introduces only small differences in luminosity of 0.015 L⊙ and age of 0.4 Myrs so it is not critical for the subsequent analysis. We thus adopt an extinction value of = 0.7, which is consistent with all of the optical and near-infrared photometry, and gives a luminosity of 0.081 L⊙, or log L/L, for an assumed distance to Lupus III of 200 pc (Comerón, 2006). Together with the of 3050 K, this gives an age of 1 Myr, a mass of 0.10 M⊙ and a radius of 1.09 R⊙ using the Baraffe et al. (1998) isochrones.
| Band | Magnitude | Flux | Ref. | |
|---|---|---|---|---|
| m | mag | mJy | ||
| R | 0.70 | 16.00 0.10 | - | 1 |
| Rc | 0.64 | 16.251 0.009 | - | 2 |
| Ic | 0.79 | 14.256 0.007 | - | 2 |
| z | 0.96 | 13.597 0.008 | - | 2 |
| J2MASS | 1.25 | 12.197 0.024 | - | 3 |
| H2MASS | 1.62 | 11.511 0.026 | - | 3 |
| K2MASS | 2.20 | 11.204 0.023 | - | 3 |
| IRAC-1 | 3.60 | - | 17.03 2.55 | 4 |
| IRAC-2 | 4.50 | - | 14.60 2.19 | 4 |
| IRAC-3 | 5.80 | - | 11.70 1.76 | 4 |
| IRAC-4 | 8.00 | - | 12.90 1.94 | 4 |
| MIPS-1 | 24.0 | - | 22.40 3.36 | 5 |
| MIPS-2 | 70.0 | - | 50.00 | 6 |
References: 1. DENIS catalog (2005), 2. Comerón et al. (in prep.),
3. Cutri et al. (2003), 4. Mundy et al. (in prep.), 5. Chapman et
al. (2006), 6. Young et al. (2005)
4 Disk parameters
The aim of this work is to link the analysis of the SED, which is related to the geometry of the disk, and the mid-infrared spectrum, which gives the mineralogical composition of the dust in the upper disk layer. The problem has no unique solution because the dust composition is commonly determined by subtracting the disk continuum SED from the IRS spectrum whereas the disk geometry and the SED itself are determined partially by the dust properties. A larger sample of 100 spectra of disk sources will be analyzed with the same method (Olofsson, Augereau et al. in prep.); here we introduce the method and the relevant ranges of disk and dust parameters for this specific object.
We have computed flared irradiated disk models with the CGPLUS code (Dullemond et al., 2001) and flared irradiated accretion disk models with the prescriptions of D’Alessio et al. (2001, 2005) using the stellar parameters of SST-Lup3-1 as inputs for the central star. The dust compositions were chosen to produce negligible silicate emission: pure carbon grains of interstellar size in CGPLUS and large grains in the disk surface in the D’Alessio et al. models. This provides possible disk continua to subtract from the IRS spectrum assuming that the silicate features in the spectrum are produced in an optically thin disk upper layer. A model is considered a good fit for this analysis when it fits the dereddened 2MASS and IRAC photometry, matches the IRS spectrum shortward of 8 m and does not exceed it at longer wavelengths. This yield a range of disk parameters that fulfill that condition: the CGPLUS disk models give an upper limit to the disk mass (gas plus dust with the usual ratio of 100:1) of M⊙, inclination angle ( being edge-on) and 15 AU. The D’Alessio et al. models provide reasonable fits for disk masses between 2 and 0.018 M⊙, inclinations and 50 AU. The large difference in disk properties in the computed cases comes mostly from the different dust opacities in the two sets of models: the D’Alessio et al. models allow a range of maximum grain sizes from 1 m to 10 cm, which make the disk opacities low enough to get very small infrared fluxes with larger disks than the CGPLUS models, which use the dust opacity of astronomical carbon and silicate sub-micron sized grains (Dullemond et al., 2001). In any case, the quoted disk radii and masses of these disk models are representative only of the material probed by the IRS spectrum and therefore lower limits to the actual values. Both sets of models produce flared disks with and .
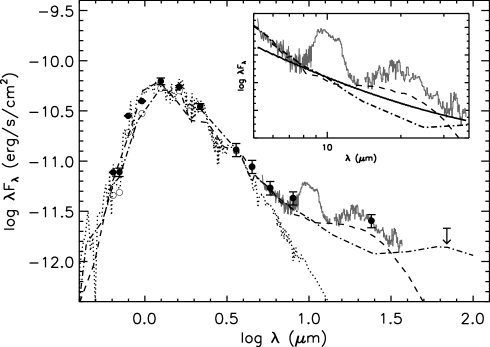
Figure 2 shows the SED of SST-Lup3-1 together with example models, with properties conveniently chosen to explore the range of reasonable continua for the subsequent analysis of the IRS spectrum. The dot-dashed line corresponds the ‘low continuum’ model, a flared D’Alessio et al. disk model with an outer disk radius of 10 AU, an inner radius of 0.01 AU (3 times the stellar radius), a mass of 2.4 M⊙, a mass accretion rate of 10-9 M⊙yr-1, a viscosity = 0.01, a maximum grain size of 100 m and an inclination of 60o. It represents a relatively massive disk with low dust opacities in this comparison. The dashed line is the ‘high continuum’ model, an extremely low mass CGPLUS disk model with an outer radius of 15 AU, an inner radius of 0.06 AU (20 times the stellar radius), a mass of M⊙ and an inclination angle of 75o. More massive disks with these small dust grains rapidly produce larger fluxes than those seen in the IRS spectrum. The inset shows a blow-up of the IRS spectrum with both continua together with the usual power-law fit to the continuum (as in Kessler-Silacci et al., 2006) for comparison. Both disk models (very low mass with very small dust particles or more massive but with large dust particles) produce similar SEDs up to the mid-IR wavelengths but have very different shapes at long wavelengths. The need for large grains or very small masses of small grains suggests that some degree of dust grain growth and settling to the midplane have taken place in the disk of SST-Lup3-1.
5 Dust composition in the disk
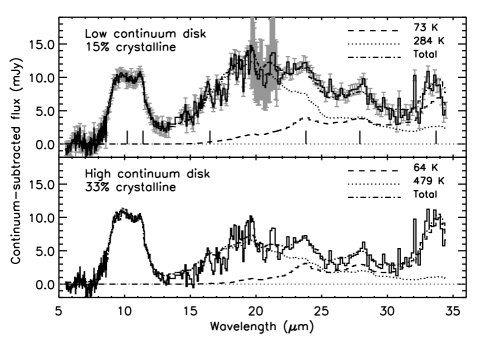
Figure 3 shows the IRS spectrum of SST-Lup3-1 from which the disk models in Figure 2 have been subtracted. Both spectra are then compared with the best-fit silicate emission model. The spectrum has, to our knowledge, one of the highest peak to continuum ratios () in the 10 m silicate feature ever published for a disk around a very low mass star. The spectrum also shows evidence of a moderately high degree of crystallization, with a ratio equal to 0.9, and conspicuous features from crystalline silicates such as forsterite at 11.4, 23.8, 27.9, and 33.7 m (Koike et al., 1993). The 1- error bars in the upper panel quantify the signal to noise around these features. Problems with the extraction of the third order of the LL module at wavelengths between 19.5 and 21.5 m for very faint sources do not allow the identification of the 19.8 or 21.0 m forsterite features. The 10.2 and 16.5 m features are not significant within the noise. The rest of the crystalline features are present in both full aperture and profile fit extractions, see Lahuis et al. (2006) for more information about the quality assessment of the c2d IRS data reduction pipeline.
5.1 Method and results
Compositional fits to the full IRS spectrum of SST-Lup3-1 have been obtained following the method outlined in van Boekel et al. (2005) and used in Apai et al. (2005) and in Honda et al. (2006): a minimization between the spectrum and a weighted sum of dust opacities, multiplied by one or more blackbodies, for the five principal dust species and for 2 grain sizes (0.1 m and 1.5 m). For every fixed blackbody temperature, this procedure provides relative mass abundances, and a minimum value. This results in a relation between the temperatures and the minimum values, from which we infer the best-fit temperature. We use the distribution of hollow spheres routine for calculating the opacities of the crystalline grains (Min et al., 2005) and the standard Mie theory for the amorphous grains.
Two novelties are applied here: the first one is that we use disk models to estimate the disk continuum emission, which connects the compositional analysis with the physical picture of the disk and allows us to study the height and/or depth in the disk of the dust emitting the 10 and 20 m amorphous and longer wavelength crystalline silicate features. The second one is that we fit the entire IRS spectrum from 5 – 35 m, which requires the inclusion of an extra low-temperature dust component for the long wavelength part and thus allows different parts of the disk to be probed. This long wavelength range is also essential to ascertain the presence of crystalline silicate features, many of which are potentially confused with PAH features shortward of 13 m.
We first fit the 10 m silicate feature considering only the spectral range between 7.5 and 13.5 m, which is least affected by the continuum choice and which requires a relatively high temperature of 300 K. This best fit is then subtracted from the spectrum and the residual spectrum is fit with a lower temperature component with a best-fit value of 70 K. This method has the virtue that it allows a direct comparison with fits performed to only the 10 m feature (as in Apai et al. 2005, van Boekel et al. 2005), where only the high temperature component is considered. It also allows a direct determination of the mass fractions in each component, which are 59 and 41% for the hot and cold components respectively if the low continuum model is used. With the high continuum, these numbers change to 65 and 35%. Also, the two temperature approach identifies (via the minimization) the characteristic temperature ranges of the dust producing the amorphous 10 and 20 m silicate features.
| Species | Mass %a | Mass %a | ||
|---|---|---|---|---|
| 28427 K | 739 K | |||
| 0.1 m | 1.5 m | 0.1 m | 1.5 m | |
| Amorphous silicatesb | 33.52.7 | 49.85.3 | 0.0+1.5 | 87.89.6 |
| Crystalline forsterite | 6.00.5 | 2.30.2 | 11.81.2 | 0.20.1 |
| Crystalline enstatite | 0.70.1 | 7.70.6 | 0.0+1.5 | 0.20.1 |
a Relative fractions of 59% (284 K) and 41% (73 K).
b Includes olivine, pyroxene and silica.
Table 2 shows the abundances of the different dust species that result in the best fit to the IRS spectrum shown in Figure 3 after subtracting the low continuum disk model. The abundances are found by averaging a number of realizations of the fit in which the spectral ranges used for the fits were changed and in which a range of temperatures was explored. The associated uncertainties are therefore larger than indicated by the standard deviations of the data, since they account for the relatively low number of realizations. However, they are similar to those cited in Apai et al. (2005) and in Honda et al. (2006) in their fits to the 10 m spectral range (high temperature component). The uncertainties in derived abundances are slightly larger for the longer wavelength spectral range. The quantitative fit results obviously depend sensitively on the adopted continuum, but the qualitative results are very similar. Hence, we will discuss primarily the low continuum case below, and mention the high continuum case only when it gives a different trend. Also, Table 2 only provides a combined mass percentage for the amorphous silicates, which includes olivine, pyroxene and silica, because the fitting method was not sufficiently robust to identify the individual amorphous species responsible for the long-wavelength part of the spectrum. This does not affect the relative mass fraction of amorphous and crystalline material, which was always consistently recovered.
The best fit composition shows that i) the amorphous hot silicates are a roughly equal mix of small and large grains, which is also found in other sources with high peak to continuum ratios (2.0) of the 10 m silicate feature (see e.g. Fig. 3 in Honda et al. 2006); ii) the crystalline silicates in the hot component are a mix of large and small grains independently of the chosen continuum, a result also consistent with that given by van Boekel et al. (2005) for similar 10 m features; iii) the amorphous cold grains are mostly large (1.5 m). This is a new and surprising result. However, this conclusion depends on the adopted continuum, since the high continuum yields mostly small grains in the cold component; iv) the cold crystalline grains are found to be smaller than 2 m regardless of the continuum used.
In the following, we discuss in detail the total crystalline mass fraction and the distribution of large and small grains in the disk.
5.2 Crystalline mass fraction
The best-fit crystalline mass percentage varies from 33% for the high disk continuum, through 20% with the power law continuum and down to 15% with the low disk continuum. In general, it is found that the smaller the peak to continuum ratio, the larger the mass crystalline fraction. The case with the low continuum based on the D’Alessio et al. (2005) models represents the best fit to the spectrum, mostly at 10 m, and also the lower limit to the total dust crystalline fraction, therefore all subsequent analyses will focus on this case.
The percentages of crystalline grains in the hot and cold components are 16.7 and 12.2 % respectively, with a similar ratio but larger absolute values in the high continuum case. The clear identification of the 23.7, 27.9 and 33.7 m forsterite features in the long wavelength spectrum is a good assessment of the presence of crystalline grains in the disk and confirms the result at short wavelengths. We have also compared our results to those of Apai et al. (2005) for sources with similar 10 m feature shapes using the high continuum case, which is the closest approximation to the definition of the continuum of those authors. Our inferred crystalline mass fractions are similar to better than 10%.
5.3 Distribution of large and small grains
Regardless of the adopted continuum, our fitting technique of the hot component recovers the approximately 50–50% of small (0.1 m) and large (1.5 m) grains found by previous analyses for this type of 10 m feature. The fit to the long wavelength part of the spectrum yields mostly large grains for the low continuum (87.7 % of large grains, Table 2) and mostly small grains for the high continuum (76.3 % of small grains).
To test the sensitivity of the results to the adopted large grain size, a series of fits to the long wavelength range of the IRS spectrum was performed with 1.0 and 5.0 m grain sizes but this did not improve the fits dramatically. The results were consistent with what has been reported above, namely that most of the grains in the low-temperature component are 1 m-sized amorphous grains for the low continuum case. Therefore, even with the small difference in feature profiles for grains in the 1–5 m size range, the best fit always selects grains of 1 m radius for the low temperature component.
The crystalline grains are also a mix of large and small grains in the hot component regardless of the continuum used. However, in the tests with larger grain sizes for the cold component, we find that the best fit always selects the smallest available grains, with grains of 0.1 – 1.5 m giving the best fit to the long wavelength spectrum. In these cases, the cold temperature components of the silicate emission model (dashed lines in Fig. 3) show the 1:1:2 relative flux ratios between the 23.7, 27.9 and 33.7 m forsterite features for small grains (Fig. 8 in Kessler-Silacci et al. 2006).
6 Discussion
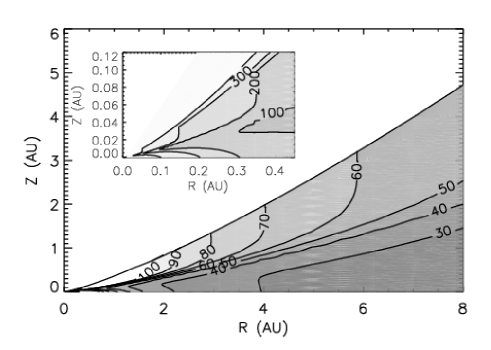
In this section we connect the results of the compositional analysis with the disk modeling to provide a combined interpretation of all the data. As shown in Table 2, the hot temperature emission component contributes 59% of the total dust mass, reproduces completely the 10 m feature and contributes to the 20 m feature. The cold temperature component, mostly coming from large amorphous grains, reproduces the rest of the 20 m feature and accounts for most of the forsterite features longward than 20 m. Figure 4 shows the 2D temperature structure of the D’Alessio et al. disk model (from Sect. 4) used to fit the entire SED except the silicate emission features. The 300 and 70 K contours indicate the locations in the disk surface where the different features are mostly produced. The hot inner disk region (from 0.05 to 1 AU) with temperatures around 300 K emits mostly in the 10 m range. The longer wavelength emission comes from dust at a temperature of around 70 K, which is found both in the outer disk surface (from 3 to 5 AU) and in the deeper disk layers at smaller radii.
Interestingly, the majority of the grains in the low temperature component are large grains, while only half of the grains in the high temperature component are large. Together with the distribution of dust at 70 K in the disk, this strengthens the possibility that part of the long wavelength emission spectrum comes from deeper layers of the inner disk rather than just the outer disk surface. This could be interpreted as a signature of sedimentation to the disk mid-plane. This conclusion is not affected by optical depth: the total gas plus dust density in most of those layers (from the disk surface to 1/2 of the disk’s height) is not high enough to render the disk optically thick. This would naturally explain the presence of larger grains in the low-temperature component, and is consistent with the disk model used for the underlying continuum which assumes dust grains as large as 100 m in size in the disk interior (Sect. 4).
Concerning the crystalline silicates, their mass percentages in the hot and cold components are 16.7% and 12.2% respectively. Given that 59% of the dust mass is in the hot component, this means that there are 2 times more crystalline grains in the inner disk than in the outer disk. This is consistent with the radial distribution of crystalline material reported by the high spatial resolution observations in the inner disks in Herbig Ae/Be stars (van Boekel et al., 2004) and suggests similar phenomena in disks around the very low mass stars.
Van Boekel et al. 2005 and Apai et al. (2005) report correlations between high crystalline fractions and overall large grain sizes or flatter disks respectively, based on 10 m spectra only. Both results suggest a relation between the crystallization and grain growth processes. Our results for the hot component alone are consistent with those trends, however, the complete 5 to 35 m spectrum of SST-Lup3-1 shows a much more complex scenario: higher amounts of crystalline silicates in the hot component, but not necessarily linked with larger amorphous grains, and mostly large amorphous grains in the cold component, where the crystalline fraction is only slightly smaller.
Here we speculate on a scenario implied by the observed dust distributions: the inner disk is a turbulent region where dust is being partially annealed when the temperature is above 800 K and where grain growth is efficient for all particles because of the higher densities (Kessler-Silacci et al., 2007). The outer disk contains small particles with a non-negligible percentage of crystalline material which has either been transported out radially (Gail, 2004) or which have formed via a different mechanism than annealing. The 10 m feature comes mostly from the hot and dense inner disk down to a depth in the disk where both large and small grains are probed. The long wavelength part of the spectrum is emitted by large amorphous grains in deep layers of the disk at distances from 0.7 to 5 AU, and by small crystalline grains in the disk surface further than 3 AU. According to this, the crystalline material could be preferentially found in the disk surface and in the hot part of the innermost disk and the larger amorphous grains would be found closer to the midplane once grain growth and settling have taken place. Then, the high crystalline fractions in disks with large grains could be explained if the lower dust opacities (due to the larger grains) would allow the 10 m feature to probe deeper in the inner disk, where the large and crystalline grains are abundant, as in van Boekel et al. (2005). Such disks would also consistently have a smaller flaring angle, as found by Apai et al. (2005). On the other hand, disks where grain growth has not occurred may have small dust with large opacities in the inner disks, large flaring angles and a 10 m feature coming from the surface of the inner disk, where the abundance of large grains is smaller.
Finally, even assuming the most conservative estimate of the disk crystalline mass fraction of 15%, the disk of SST-Lup3-1 shows a remarkably high degree of crystallinity taking into account that only 0.2% of the disk (from 0.01 to 0.2 AU, out of 10 AU) is warm enough to produce crystalline material. Three main phenomena may explain this result: i) there is another source of disk heating such as X-ray flares (e.g., Preibisch et al., 2005) or shocks that are operating in the system, ii) there was an episodic heating event e.g., due to a sudden increase in the disk mass accretion rate as observed in FU Ori stars (Hartmann & Kenyon, 1996) or iii) there is efficient radial and vertical transport of dust in the system. Gail (2004) show that radial mixing in disks can produce crystallinity fractions of several tens of per cent at distances of 5 to 10 AU, although that model predicts larger amounts of forsterite grains in the inner than outer disk, contrary to our observations. Future X-ray observations of the source, dynamically self-consistent disk models of the object, and a larger sample of complete 5 to 35 m IRS spectra of disks may help elucidate which is the main effect at work.
7 Conclusions
A detailed study of the disk emission of SST-Lup3-1 is presented and the results obtained are as follows:
-
•
SST-Lup3-1 is a newly discovered very low mass M5.5 young star close to the hydrogen burning boundary with a disk, found with the Spitzer c2d data in the Lupus III dark cloud.
-
•
The complete 5–35 m mid-IR Spitzer/IRS spectrum of such a low luminosity object is presented for the first time. It contains one of the highest 10 and 20 m peak to continuum ratios reported for such a source.
-
•
A compositional fit of the spectrum shows two temperature components. A hot (T 300 K) component with a mix of small and large grains and a cold component (T 70 K) with mostly large grains. This latter conclusion depends on the adopted continuum.
-
•
The spectrum has prominent spectral signatures indicating significant amounts of crystalline grains in the disk, confirmed in the long wavelength range of the spectrum. The crystalline mass fraction in the cold component is only slightly less than that in the hot disk component.
-
•
The crystalline grains in the hot component are a mix of large (1.5 m) and small (0.1 m) grains, while those in the cold component are mostly small grains, suggesting that the crystalline material is preferentially in the disk surface layers.
-
•
The cold component emission can arise from both the “outer” disk surface or from deeper layers in the inner disk. In the latter case, this would be direct evidence for combined grain growth and settling with vertical height.
References
- Allard et al. (2000) Allard, F., Hauschildt, P. H., & Schweitzer, A. 2000, ApJ, 539, 366
- Allers et al. (2006) Allers, K. N., Kessler-Silacci, J. E., Cieza, L. A., & Jaffe, D. T. 2006, ApJ, 644, 364
- Apai et al. (2005) Apai, D., Pascucci, I., Bouwman, J., et al. 2005, Science, 310, 834
- Apai et al. (2004) Apai, D., Pascucci, I., Sterzik, M. F., et al. 2004, A&A, 426, L53
- Baraffe et al. (1998) Baraffe, I., Chabrier, G., Allard, F., & Hauschildt, P. H. 1998, A&A, 337, 403
- Bouwman et al. (2001) Bouwman, J., Meeus, G., de Koter, A., et al. 2001, A&A, 375, 950
- Caballero et al. (2004) Caballero, J. A., Béjar, V. J. S., Rebolo, R., & Zapatero Osorio, M. R. 2004, A&A, 424, 857
- Chapman et al. (2006) Chapman, N., Evans, II, N. J., Allen, L. E., et al. 2006, ApJ, submitted
- Comerón (2006) Comerón, F. 2006, The Lupus Dark Clouds, ed. B. Reipurth (Handbook of Low Mass Star Formation in Southern Molecular Clouds), submitted
- Comerón et al. (2003) Comerón, F., Fernández, M., Baraffe, I., Neuhäuser, R., & Kaas, A. A. 2003, A&A, 406, 1001
- Comerón et al. (2000) Comerón, F., Neuhäuser, R., & Kaas, A. A. 2000, A&A, 359, 269
- D’Alessio et al. (2001) D’Alessio, P., Calvet, N., & Hartmann, L. 2001, ApJ, 553, 321
- D’Alessio et al. (2005) D’Alessio, P., Merín, B., Calvet, N., Hartmann, L., & Montesinos, B. 2005, Revista Mexicana de Astronomia y Astrofisica, 41, 61
- Dullemond et al. (2001) Dullemond, C. P., Dominik, C., & Natta, A. 2001, ApJ, 560, 957
- Evans et al. (2003) Evans, II, N. J., Allen, L. E., Blake, G. A., et al. 2003, PASP, 115, 965
- Evans et al. (2006) Evans, II, N. J., Harvey, P. M., Dunham, M. M., et al. 2006, http://ssc.spitzer.caltech.edu/legacy/original.html
- Frasca et al. (2003) Frasca, A., Alcalá, J. M., Covino, E., et al. 2003, A&A, 405, 149
- Furlan et al. (2005) Furlan, E., Calvet, N., D’Alessio, P., et al. 2005, ApJ, 621, L129
- Gail (2004) Gail, H.-P. 2004, A&A, 413, 571
- Guieu et al. (2006) Guieu, S., Dougados, C., Monin, J.-L., Magnier, E., & Martín, E. L. 2006, A&A, 446, 485
- Hartmann & Kenyon (1996) Hartmann, L. & Kenyon, S. J. 1996, ARA&A, 34, 207
- Honda et al. (2006) Honda, M., Kataza, H., Okamoto, Y. K., et al. 2006, ApJ, 646, 1024
- Jayawardhana et al. (2002) Jayawardhana, R., Mohanty, S., & Basri, G. 2002, ApJ, 578, L141
- Jayawardhana et al. (2003) Jayawardhana, R., Mohanty, S., & Basri, G. 2003, ApJ, 592, 282
- Kessler-Silacci et al. (2006) Kessler-Silacci, J., Augereau, J.-C., Dullemond, C. P., et al. 2006, ApJ, 639, 275
- Kessler-Silacci et al. (2007) Kessler-Silacci, J., Dullemond, C. P., Augereau, J.-C., et al. 2007, ApJ, submitted
- Kirkpatrick et al. (1991) Kirkpatrick, J. D., Henry, T. J., & McCarthy, Jr., D. W. 1991, ApJS, 77, 417
- Koike et al. (1993) Koike, C., Shibai, H., & Tuchiyama, A. 1993, MNRAS, 264, 654
- Lahuis et al. (2006) Lahuis, F., Kessler-Silacci, J., Evans, N., et al. 2006, c2d Spectroscopy Explanatory Supplement, Tech. rep., Pasadena: Spitzer Science Center
- Luhman et al. (2003) Luhman, K. L., Briceño, C., Stauffer, J. R., et al. 2003, ApJ, 590, 348
- Luhman et al. (1998) Luhman, K. L., Briceno, C., Rieke, G. H., & Hartmann, L. 1998, ApJ, 493, 909
- Min et al. (2005) Min, M., Hovenier, J. W., & de Koter, A. 2005, A&A, 432, 909
- Muzerolle et al. (2003) Muzerolle, J., Hillenbrand, L., Calvet, N., Briceño, C., & Hartmann, L. 2003, ApJ, 592, 266
- Natta et al. (2004) Natta, A., Testi, L., Muzerolle, J., et al. 2004, A&A, 424, 603
- Preibisch et al. (2005) Preibisch, T., McCaughrean, M. J., Grosso, N., et al. 2005, ApJS, 160, 582
- Przygodda et al. (2003) Przygodda, F., van Boekel, R., Àbrahàm, P., et al. 2003, A&A, 412, L43
- Rieke & Lebofsky (1985) Rieke, G. H. & Lebofsky, M. J. 1985, ApJ, 288, 618
- Sterzik et al. (2004) Sterzik, M. F., Pascucci, I., Apai, D., van der Bliek, N., & Dullemond, C. P. 2004, A&A, 427, 245
- van Boekel et al. (2004) van Boekel, R., Min, M., Leinert, C., et al. 2004, Nature, 432, 479
- van Boekel et al. (2005) van Boekel, R., Min, M., Waters, L. B. F. M., et al. 2005, A&A, 437, 189
- van Boekel et al. (2003) van Boekel, R., Waters, L. B. F. M., Dominik, C., et al. 2003, A&A, 400, L21
- White & Basri (2003) White, R. J. & Basri, G. 2003, ApJ, 582, 1109