A deep , VLA and IRAC study
of the very low luminosity nucleus
of the elliptical NGC 821
Abstract
The relatively nearby (distance=24.1 Mpc) elliptical galaxy NGC821 hosts an extreme example of a quiescent central massive black hole, for which deep observations revealed a nuclear source for the first time, with . We present here a multiwavelength study of this nucleus, including VLA observations that detect a radio counterpart to the nuclear source at 1.4 GHz, with a flux density of 127 Jy and possibly a flat spectral shape; we also consider new IRAC observations and archival images. With these data we discuss possible scenarios for the accretion modalities of the sole material that seems available for fuelling, i.e., the stellar mass losses steadily replenishing the circumnuclear region. The final stages of accretion could be radiatively inefficient and coupled to a compact nuclear jet/outfow. The stellar mass losses could instead end up in a standard disc only if a Compton-thick AGN is present. Two extended sources detected by close to the nucleus could be due to several unresolved knots in a jet. If a jet is present, though, its kinetic energy would be only a very small fraction of the energy associated with the rest mass of the material being accreted. Starformation close to the nucleus is not shown by the available data. Deeper NICMOS, radio and far-IR observations are expected to further constrain the accretion process in this intriguing nucleus.
1 Introduction
The connection between the mass of a central supermassive black hole (hereafter MBH) and the properties of the host galaxy (see, e.g., the relation; Ferrarese & Merritt 2000, Gebhardt et al. 2000), together with the recognition that a MBH resides at the center of every massive spheroid in the local universe (e.g., Ferrarese & Ford 2005), has led to the idea that the formation and evolution of the MBH and the host galaxy are intimately related (e.g., Springel, Di Matteo & Hernquist 2005, Sazonov et al. 2005, Hopkins et al. 2006a). In this picture, feedback from the MBH has been advocated to regulate starformation at early epochs, producing the observed galaxy mass function and colors (e.g., Croton et al. 2006); in later epochs, feedback is required to heat the galactic flows solving the ”cooling flow” problem (e.g., Omma et al. 2004; Ostriker & Ciotti 2005, 2007; Churazov et al. 2005, McNamara et al. 2005).
Although feedback is a promising mechanism for solving many observational puzzles, our understanding of how accretion and feedback work, and of their evolution over cosmic time, is still uncomplete. It has been suggested that after the bright AGN phase accretion switches to a more radiatively quiet or inefficient mode (e.g., Churazov et al. 2005, Hopkins et al. 2006b) possibly associated with radio jets or outflows that may carry out most of the accretion power (Di Matteo et al. 2003, Pellegrini et al. 2003, Falcke et al. 2004, Allen et al. 2006). Indeed, the nuclei of most of the nearby spheroids are either radiatively quiescent or exhibit low levels of activity (e.g., Ho 2005, Pellegrini 2005a). Typically, these nuclei are not associated with detectable radio sources, but the absence of radio emission in itself does not exclude nuclear activity, since ’frustrated’ or not collimated nuclear outflows would be hard to detect (Nagar et al. 2005). Also, intermittent AGN activity is suggested by the X-ray and radio morphology of nearby clusters of galaxies (e.g., Fabian et al. 2006) and galaxies (e.g., Machacek et al. 2006), and may originate in an accretion flow that switches between different accretion modes (Janiuk et al. 2004).
In nearby spheroids we can attempt to constrain observationally the modalities of accretion (and feedback) through detailed studies of the stellar population, the ISM and the current star formation rate for the central one hundred parsec region, especially if the AGN emission does not dominate over the other nuclear components. NGC 821, an isolated elliptical galaxy at a distance of 24.1 Mpc (Table 1), is an ideal target for studying how these phenomena have evolved in the local universe. There is compelling evidence of the presence of a central MBH in this galaxy, from resolved dynamical studies (Gebhardt et al. 2003). NGC821 has a very regular and smooth optical appearance (Lauer et al. 2005) and the old and metal rich stellar population typical of elliptical galaxies (Proctor et al. 2005); no cold (HI) or dusty ISM (Sarzi et al. 2006, Ravindranath et al. 2001) have been observed in it, restricting the potential reservoir for accretion.
The MBH of NGC821 has a mass of (Table 1) and an Eddington luminosity of . Therefore, if radiatively efficient accretion were taking place, this galaxy should be a luminous AGN. Instead, this MBH is extremely quiescent. Very low limits on optical emission lines (H, H, or [OIII]) are reported for the nucleus of NGC821 (Ho 2002; Ho et al. 2003; Sarzi et al. 2006) and the limits on nuclear radio emission are also stringent: 1.5 mJy at 15 GHz (with 150 mas resolution; Nagar et al. 2005) and 0.5 mJy at 5 GHz (with 5′′ resolution; Wrobel & Heeschen 1991).
Thanks to a deep pointing for a total exposure of 230 ksec (discussed in Pellegrini et al. 2007, hereafter P07), a source was detected for the first time at the nucleus of NGC821 (called S2). S2 is extended (Tab. 2), but it has a flat () unabsorbed X-ray spectrum, excluding a central concentration of hot, optically thin ISM. Its 2–10 keV luminosity is erg s-1. An upper limit of 2.8 erg s-1 was placed on a possible pointlike 0.3–8 keV emission associated with the MBH; this is one of the smallest values obtained with for galactic nuclei (Pellegrini 2005b).
In addition to the nucleus, also the hot ISM that could provide a source of fuel for the MBH can be measured in the X-rays (e.g., Loewenstein et al. 2001; Soria et al. 2006a). Our deep, sub-arcsecond pointing revealed diffuse emission in the central part of NGC 821, but also led to the detection of a population of X-ray binaries which can account for most – if not all – of the diffuse emission, so that we could place a very stringent upper limit on the contribution of a hot gaseous component (P07). This deep pointing highlighted the presence of three other sources around S2, of luminosity and spectral shape consistent with those of low mass X-ray binaries; only one is consistent with being pointlike, though, the other two (S1 and S4) are extended (Tab. 3), and could be due to the superposition of few point sources and/or truly diffuse emission. In particular, the morphology of S1 resembles a jet-like feature (see also Fabbiano et al. 2004).
In this paper we report the results of an observational campaign aimed at complementing the results, to better constrain the nature of the processes taking place in the vicinity of the MBH in NGC821. New data presented in this paper include sensitive VLA and IRAC observations; we also analyzed archival () observations. With this multi-wavelength data set we investigate: circumnuclear starformation, which may result from accretion (Tan & Blackman 2005); radiatively inefficient accretion, possibly coupled to a compact or resolved nuclear jet (e.g., Narayan 2005); and highly obscured scaled-down AGN emission. The paper is organized as follows: in Section 2 we summarize the main results concerning the nuclear sources, we present the results of the new VLA and observations, of the archival optical data, and previous NICMOS results; in Section 3 we discuss possible scenarios for accretion around this MBH; in Section 4 we summarize our conclusions.
2 The emission properties of the nuclear region
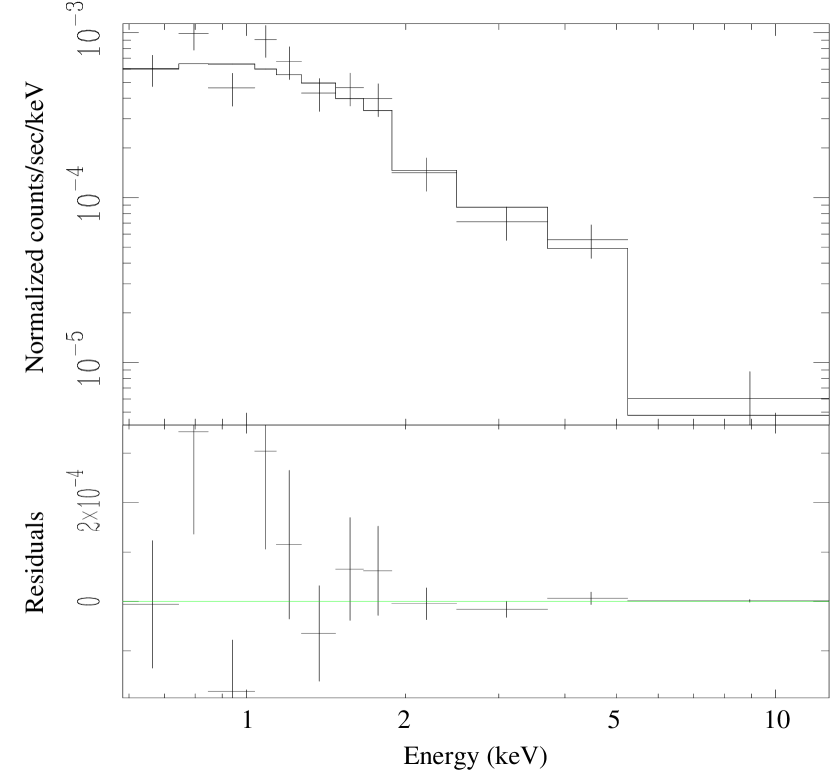
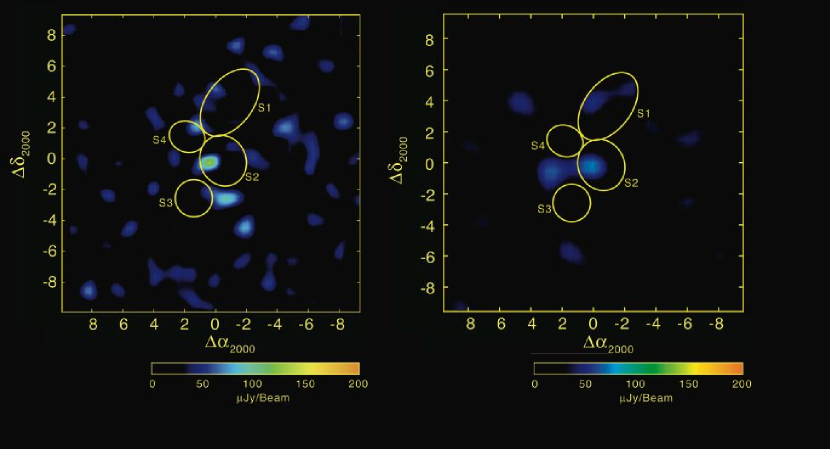
The main outcomes of the deep pointing concerning the properties of the nuclear source S2 are summarized in Tab. 2. We also show the source spectrum (Fig. 1) and the results of a spectral fit including fluorescent line emission from cold iron at 6.4 keV (Tab. 2), which produced only an upper limit on the equivalent width of the line. Tab. 3 summarizes the properties of the other two extended sources (S1 and S4) detected by in the central galactic region. The position and extent of the sources S1, S2 and S4 are also shown in Fig. 2.
Below we present new VLA observations in Sect. 2.1; the analysis of IR data from a program to observe a sample of radiatively quiescent MBHs (PI: Fabbiano) in Sect. 2.2, together with a previous NICMOS measurement; the reanalysis of archival WFPC2 data taken with the F555W and F814W filters, and of our previous R-band INT images in Sect. 2.3. Table 5 summarizes the results and Fig. 3 shows them.
2.1 Radio observations
We observed NGC821 with the VLA of the NRAO111The National Radio Astronomy Observatory is a facility of the National Science Foundation operated under cooperative agreement by Associated Universities, Inc. at 1.4 GHz in the most extended (A) configuration on 2004 December 31, and at 4.8 and 8.4 GHz in the second most compact (C) configuration on 2005 July 21. We used a 200 MHz instantaneous continuum bandwidth, observing 3C48 for flux density calibration and J0203+1134 for phase calibration, using standard techniques and the AIPS data reduction package. NGC821 lies from the phase calibrator. Empirical limits on systematic position uncertainties were estimated from snapshots images of three quasars (J0204+1514, J0149+0556, and J0242+1101) that lie within of the phase calibrator. The flux density scale was accurate to and absolute position measurements were accurate to . We mapped the entire primary beam of the VLA with 3-D deconvolution to obtain noise levels () of 20 Jy, 20 Jy, and 17 Jy at 1.4, 4.8, and 8.4 GHz respectively, for effective total integrations of 2.0–2.2 hours at each frequency. We adopted variance weighting of (u,v)-data with some downweighting of short baselines (AIPS parameter ROBUST=0). Beam half-power sizes are given in Tab. 5.
We detected a radio counterpart to source S2 at , at 1.4 GHz (Fig. 2, Tab. 2; Sect. 4.2 of P07 discusses the coincidence of the position of S2 with the optical center in WFPC2 images), with a flux density of 127 Jy (6). Emission was marginally detected at 8.4 GHz (71 Jy; 4.2), peaking at the same position to within the measurement uncertainty. The noise level at 8.4 GHz was about one and a half order of magnitude lower than the earlier upper limit obtained at 15 GHz by Nagar et al. (2005). A marginal detection at 4.8 GHz was also possible (80Jy; 4.0); in this case the prospective peak lies (or beamwidth) to the south.
The three flux densities correspond to a power law with spectral index (). The estimated spectral index may be viewed with some caution because it depends on measurements made with very different beamwidths. However, we have studied images at 1.4 GHz made with different weighting schemes (i.e., Natural and Uniform) and we did not find a significant change in peak signal to noise ratio at the location of S2, for beam sizes of to . At this and other frequencies, there is no indication that we might be partially resolving the emission for S2; however, multi-configuration data would be needed to properly address this question.
No sources were detected at the location of the other sources S1, S3 and S4 in the central galactic region (Sect. 4 in P07; Fig. 2). Therefore, we can place upper limits on their emissions of 80Jy, 80Jy and 68Jy respectively at 1.4, 4.8 and 8.4 GHz.
2.2 Infrared observations
NGC821 was observed with the Infrared Array Camera (IRAC, Fazio et al. 2004) on board the Space Telescope (Werner et al. 2004) on August 21, 2005 for a total of 725.5 s (Program ID 20371). After the standard IRAC processing222http://ssc.spitzer.caltech.edu/irac/dh/PDDv1.pdf, the four IRAC channels resulted in images at 3.6, 4.5, 5.8 and 8 ; the central region of NGC821 was detected in each of them. We based our analysis on the IRAC instrument performance as given in the Infrared Array Camera Data Handbook333http://ssc.spitzer.caltech.edu/irac/dh/iracdatahandbook3.0.pdf.
Using DS9 and 444hea-www.harvard.edu/RD/funtools/ , we extracted counts from circular regions of approximately 4 square arcseconds area ( radius) centered on the peak of the emission. In every case the position of this peak, with the WCS, falls in-between the optical center and the position for S2 (see Tab. 2); both of these are well within the count extraction radius. This position ( WCS) is at RA= .11, Dec= , although given the pixellation of the data, the peak count pixel may be slightly displaced.
The background was estimated both from a surrounding annulus, to attempt a rough subtraction of stellar light from the center-most emission, and from an off-source circle. The fluxes were all normalized to an area of 4 square arcseconds (that of circles of radius). The results are shown in Table 4, for both choices of the background.
We also list in Tab. 5 the upper limit on any unresolved nuclear emission in the H-band (centered at 1.6) derived from NICMOS data (Ravindranath et al. 2001). This limit refers to the NIC2 camera and corresponds to an intrinsic Gaussian of FWHM pixel.
2.3 Optical observations
We carried out aperture photometry on the archival WFPC2 images taken with the F555W and F814W filters (Lauer et al. 2005), following standard procedures described in the WFPC2 handbook555See http://www.stsci.edu/instruments/wfpc2/Wfpc2hand/wfpc2tutorialv3.0.pdf.. The instrumental F555W and F814W magnitudes were converted to standard V and I magnitudes using the most updated version666See http://purcell.as.arizona.edu/wfpc2calib/. of the color coefficients provided by A. Dolphin. In order to compare the optical emission with that estimated from IRAC observations, it was calculated for a circle of radius, the same area used to extract the fluxes (Sect. 2.2). The optical brightness inside this area is mag, and , after correcting for a Galactic extinction (Schlegel et al. 1998). The R-band magnitude from the same area was also calculated, by using INT images (Graham et al. 2001) and the corresponding surface brightness profile derived by Soria et al. (2006b); it results into in the Cousins system.
In order to constrain the emission coming from the MBH, from the deconvolved F555W and V–I profiles derived by Lauer et al. (2005) we also calculated the V and I luminosities within a circle of radius (the innermost radius at which deconvolution can give accurate results according to Lauer et al.). These luminosities are upper limits to the MBH emission, since both our analysis and that of Lauer et al. (2005) reveal the absence of an optical ”nucleus”, that is a compact light source rising above the surface brightness profile at small radii when extrapolated inward. In general these nuclei, which have been found in a large fraction of early-type galaxies from images (see also Ravindranath et al. 2001), are bluer than the background starlight and could be nuclear star clusters or low luminosity AGNs.
3 Discussion
The deep image of NGC821 revealed an extended, hard source at the position of the galactic center (P07); our associated VLA observations have led to the discovery of a 1.4 GHz source at the same position (Sect. 2.1); pointlike nuclear emission is not detected in the optical and the IR (Sects. 2.2 and 2.3). In the 0.3–8 keV band, the upper limit to any pointlike emission associated with the MBH is , and the at 1.4 GHz is just erg s-1. Therefore the MBH of NGC821 is one of the radiatively quietest MBH known, with . Most MBHs are radiatively quiescent in the local universe, or show very low activity levels (Sect. 1), therefore our deep look at the nucleus of NGC821 has a bearing on a very common state of MBHs. In the following we use our observational results to constrain the process of accretion in this nucleus.
3.1 Why not a dead MBH?
Given the general lack of fuel available for accretion observed at all wavelengths, including the X-rays (Sect. 1), is a truly dead MBH what we should expect at the center of NGC821? In fact, an aging stellar population continuously returns gas to the ISM, via its stellar mass losses (Ciotti et al. 1991, David et al. 1991), and the circumnuclear region should be replenished with this fuel. Indeed, hydrodynamical simulations specific for NGC821 (P07) demonstrate that this fuel should be present. While the bulk of the hot gas is expelled out in a wind (consistent with the lack of detection of hot gas), the stellar mass losses are accreting within a very small region of pc from the nucleus; at the innermost radius resolved by the simulations (10 pc), the mass accretion rate is few yr-1. Notwithstanding the limitations of the simulations, and the uncertainties associated with the observables used as input parameters, the presence of this small inflowing region was considered a robust result (see P07); similarly, a range of values for yr-1 was considered reliable (with the caveat that the true, final accretion rate on the MBH could be somewhat higher; P07). should produce a luminosity (1–4) erg s-1 if, closer in to the MBH, it ends up in a standard accretion disc with a radiative efficiency as assumed for classical AGNs (Shakura & Sunyaev 1973). This would be a highly sub-Eddington AGN, though, since few. For a standard spectral energy distribution (SED) of AGNs (Elvis et al. 1994), the upper limit on a pointlike nuclear X-ray emission (Tab. 2) corresponds to a bolometric upper limit of erg s-1, that is already 30 to 100 times less than .
Below we explore scenarios for the evolution of the accreting material, that would explain why the nucleus is not observed at a luminosity as high as . We consider, in turn, the presence of angular momentum in the accreting material (Sect. 3.2), a reduction of the accretion rate due to starformation in a circumnuclear disc (Sect. 3.3), accretion at low radiative efficiency (Sect. 3.4), the presence of a jet/outflow, whose kinetic power possibly accounts for a fraction of (Sect. 3.5), a transition in the accretion mode due to disk instabilities (Sect. 3.6) and finally obscuration of the nuclear radiation produced by a scaled-down AGN (Sect. 3.7).
Note that the mass accretion rate of galactic nuclei has been often estimated (e.g., Di Matteo et al. 2003) assuming spherically symmetric accretion from a nonrotating polytropic gas with given density and temperature at infinity (Bondi 1952). Moscibrodzka (2006) calculated model spectra emitted by such a Bondi flow for a sample of low luminosity AGNs, including NGC821. The adopted value of gas density was larger than constrained now thanks to the deep pointing (P07); even so, the predicted X-ray emission was ergs s-1, that is orders of magnitude below the limit on pointlike nuclear emission (Tab. 2). However, the Bondi accretion is a severe mathematical approximation of the accretion process (see also P07); for example, some initial angular momentum of the flow captured by the MBH, and the inclusion of viscosity, may result in a higher X-ray luminosity. Radiation models applied to global MHD simulations of low angular momentum accretion flows are being developed and will be applied to this nucleus (Moscibrodzka et al., in preparation; see also Balbus & Hawley 2002).
3.2 Angular momentum at large radii
The inclusion of even slow rotational motion of the gas at large radii can significantly reduce the rate at which mass is captured into the accretion flow, compared to the non-rotating case (Proga & Begelman 2003). The motivation for the Proga & Begelman’s study was to make less severe the problem that MBHs in the local universe are much dimmer than expected for a mass accretion rate estimated at large radii via the Bondi (1952) formula (Sect. 3.1) and ending up in a standard disc (e.g., Fabian & Canizares 1988, Pellegrini 2005a). While the Bondi formula assumes spherically symmetric accretion from a nonrotating gas under the sole influence of the central gravity, Proga & Begelman (2003) studied the evolution of the flow with a small angular momentum, including regions beyond the domination of the MBH gravity. They found that the mass supply rate to the MBH can be smaller by up to orders of magnitude with respect to the nonrotating case. In NGC821 the stellar kinematics becomes disc-like within the central (Scorza & Bender 1995, Emsellem et al. 2004), therefore the stellar mass losses close to the galactic center are likely to have angular momentum, which would lead to a reduction of .
Whether the expected luminosity could become consistent with the observed upper limits is however more questionable, since it is not known what is the final, net effect of the inclusion of angular momentum at large radii on the resulting luminosity of the flow closer to the MBH. It is probably not plausible that gas inflowing at the rate shown by the simulations (that is equal to of Sect. 3.1 at present and was larger in the past, for a total integrated mass of few over the past Gyrs; P07) continues to accumulate for many Gyrs in the nuclear region without accreting and without becoming observable. However, in order for the gas to be able to accrete, angular momentum must be transferred outward through viscosity, and this may actually increase the luminosity of the flow. MHD simulations with rotation and cooling by radiation included are needed to really state what happens to the luminosity of the flow (see also Sect. 3.1).
3.3 Circumnuclear starformation
Condensation into stars in a gravitationally unstable disc can prevent a significant fraction of the accreting gas from reaching the MBH (Tan & Blackman 2005), resulting into a much lower true accretion rate; this starformation should produce H and IR emission. As reported in Sect. 1, the optical spectrum of NGC821 shows only absorption lines; the upper limit on its H luminosity is erg s-1 (Ho et al. 2003, rescaled for the distance in Tab. 1). From the Kennicutt (1998) relation between starformation rate and , the resulting starformation rate is yr-1, much larger than given by the simulations (Sect. 3.1). Also the observed luminosity in the IRAC bands (Tab. 5, Fig. 3) is at least one order of magnitude higher than expected in the full IR band from starformation at the rate (Kennicutt 1998). However, the aperture used to derive the IRAC luminosities includes also emission from the normal, old stellar population, that has to be accounted for.
The analysis of the SED of NGC821 (Fig. 3) shows that it can be explained just by the normal, old galactic stellar population, without requiring ongoing starformation. To check this, we used the matched aperture photometry (i.e., all for aperture radius) from the to the V filter data points (Tab. 5) and compared it with SED templates for stellar populations of different ages and metallicities, for the Kroupa (2001) IMF (Bruzual & Charlot 2003); we also allowed for an exponentially declining starformation rate with time scale . The fitting procedure described by Bolzonella et al. (2003)777This fitting can be made with the public code , available on the web at http://webast.ast.obs-mip.fr/hyperz and built by Bolzonella et al. (2003). was applied. The observed data points are very well fitted by an age of 11.0 Gyrs and a metallicity of 0.25 solar, with a short time scale ( Gyr) and without current star formation (solid line in Fig. 3). These properties match closely those obtained from spatially resolved optical spectroscopy for the bulk of the stellar population (Proctor et al. 2005). The magnitudes and fluxes derived here have been corrected for extinction (Sect. 2); to check whether a residual extinction is left in the data, we allowed for free extinction in the fit, but the best fit extinction turned out to be consistent with zero. We can conclude that the optical and mid-IR emission within a central projected circle of radius is dominated by the normal stellar population of the galaxy.
From their analysis based on Lick absorption-line indices, Proctor et al. (2005) also found at the very center of NGC821 (within a central radius of ) an emission weighted abundance of times solar, and evidence for a burst of starformation between 1 and 4 Gyrs ago, that involved % of the galaxy’s mass. Therefore we fitted the observed data points also with a metallicity of 2.5 solar (the largest value available for the templates); this resulted in an age of Gyr, but the fit was not as good as the previous one (dotted line in Fig. 3). The optical points considered here contain less information than the indices used by Proctor et al. (2005); it is also likely that the true best fit SED is a combination of templates with different ages and abundances, but a fit with composite SEDs is beyond the scope of this work. For the purposes of the present investigation, the conclusion here is that current starformation is not required to explain the SED; however, is so low that the available optical and IR data cannot constrain whether a part (or even the total) of it goes into star formation.
3.4 Low radiative efficiency (plus a compact, nuclear jet)
It has been suggested that high-luminosity and low-luminosity AGNs host two different accretion modes: a radiatively efficient disk-dominated one and a radiatively inefficient one, which is expected to be coupled to strong outflows (see Narayan 2005 for a recent review). The SED of a few low-luminosity AGNs indeed has been modelled with truncated optically thick disks with inner radiatively inefficient flows (e.g., M81 and NGC4579, Quataert et al. 1999; NGC3998, Ptak et al. 2004; NGC1097, Nemmen et al. 2006). In the radiatively inefficient mode, the flow produces the X-ray emission, while the radio emission comes from the base of a nuclear jet, if present (e.g., Falcke et al. 2004, Körding et al. 2006). In fact, observations seem to suggest that low-luminosity AGNs are ”radio-loud” (Ho 2002, Terashima & Wilson 2003, Wu & Cao 2005); moreover, often their radio power and sometimes also their radio spectrum require a separate, compact jet component (Anderson et al. 2004; Nagar et al. 2005). On the theoretical side, MHD simulations show that at low accretion rates winds and jets naturally develop (e.g., Stone et al. 1999, Hawley & Balbus 2002, Igumenshchev et al. 2003, De Villiers et al. 2003), since the magnetic and kinetic energy release in the flow are enough to support an outflow or a jet (see also Blandford & Begelman 2004).
In the context of low radiative efficiency accretion, the relationship between the black hole mass, the core radio luminosity at 5 GHz and the 2–10 keV emission has been investigated for a large sample of accretion-powered sources, going from X-ray binaries to mostly low-luminosity AGNs by Merloni et al. (2003). They found the sources to lie on a plane described by log log 0.78 log 7.33 (with a scatter of ), which was attributed to the presence of a radiatively inefficient accretion flow jet system, that can exist with similar properties at different scales.
Low radiative efficiency accretion is compatible with the very low value of for the MBH of NGC821 (Sect. 3), and was already considered as a viable solution for its low emission by Pellegrini (2005a) and Soria et al. (2006a,b). Given our new radio observation, we examine here the position of this MBH with respect to the plane of Merloni et al. (2003). The 2–10 keV upper limit on nuclear pointlike emission is erg s-1 (Tab. 2), and the nuclear 5 GHz luminosity is erg s-1 (a detection, though; Sect. 2.1); the resulting location is shown in Fig. 4. If the 5 GHz detection is real, and the nuclear X-ray emission is smaller by a factor of than the upper limit, then NGC821 is consistent with the plane, and it may host a radiatively inefficient accretion flow jet system. If instead the X-ray emission is close to that of the whole S2 source, or even higher (see Sect. 3.7), then this nucleus lies well below the predictions of the plane. In this case, its SED could be consistent with that of a classical, bright AGN (see Sect. 3.7 below).
The sample of Merloni et al. includes mostly objects of relatively high . Below a critical , the jet emission can become dominant also in the X-ray domain, and the radio–X-ray correlation should turn steeper (Yuan & Cui 2005). The slope of the fundamental plane should then be different from when the X-ray emission is dominated by the accretion flow (see also Wang et al. 2006), and the fundamental plane in this regime becomes log log 0.25 log13.45 (with at 8.5 GHz, Yuan & Cui 2005). This relation predicts a lower radio luminosity for given X-ray emission and therefore the nucleus of NGC821 is located close to such a plane (Fig. 4) provided that the radio emission is close to the detection at 8.4 GHz and the 2–10 keV emission close to the upper limit.
In conclusion, a radiatively inefficient flow coupled to a nuclear jet is a viable scenario for the accretion process. Also the observed spectral shape of the nuclear source in the radio is consistent with this interpretation. The flux density of a jet with optically thick core/nozzle emission is approximately flat (, with ) up to high radio frequencies (Zensus 1997, Falcke et al. 2004). Within the uncertainties due to the marginal detections at 4.8 and 8.4 GHz and the unmatched beamwidths at the different frequencies (Sect. 2.1), the radio spectral shape of the nuclear source is relatively flat, and is therefore consistent with being produced by the base of a jet. This jet could be confined within the inner few arcsecs (see Tab. 3 for the beam sizes), because it is disrupted or frustrated within it; nuclei with parsec-scale jets have already been found in elliptical galaxies with the VLBI (e.g., Nagar et al. 2005).
In the next Section we examine whether a jet/outflow can be present on a larger scale (outside S2).
3.5 A resolved jet?
The elongated X-ray sources S1 and S4 in the central galactic region (P07, Fig. 2) may be due to an outflow or a jet; in the radio, only S2 is detected, but at the location of sources S1 and S4 we could place upper limits (Sect. 2.1). We use here the observed X-ray to radio flux ratios for typical jets to investigate whether S1 and S4 can be due to a jet (note however that the properties of jet emission depend on the internal jet structure as well as the environment in which the jet propagates). Kataoka & Stawarz (2005) compiled a sample of X-ray jets with data, observed outside the host galaxy of quasars and AGN. The X-ray luminosity usually dominates over the radio for the jet/knots emission, while for lobes and hot spots the radio luminosity is comparable to or exceeds the X-rays. In any case, in the Kataoka & Stawarz (2005) sample the X-ray to radio L1keV/L5GHz monochromatic luminosities ratio does not exceed 100. This same ratio is for the source S1, and for S4, assuming that the entire X-ray luminosity of each source is due to a jet, and the upper limits at 5 GHz (Sect. 2.1). However, if the observed X-ray luminosity is contributed by several blended knots then the limits quoted above are not meaningful. The case for unresolved knots in sources S1 and S4 is better investigated with more nearby objects. One example of a nearby jet moving within the interstellar medium of a galaxy is that of Centaurus A, with many resolved X-ray knots (Hardcastle et al. 2003, Kataoka et al. 2006). Cen A is at 3.4 Mpc distance, so that is equivalent to 17 pc. The size of source S1 (Tab. 3) corresponds to pc, and it is feasible for a jet to create many knots on that distance, given the large number of knots observed in the Cen A jet. Also, for a few knots in the Cen A jet the X-ray to radio luminosity ratio exceeds 100, with one case of (Hardcastle et al. 2003). The lowest detected 5 GHz luminosity of a radio knot in the Cen A jet is 1.4 erg s-1, which is below our upper limit of 2.7 erg s-1 at 5 GHz.
The available radio and X-ray data, although very deep, do not provide therefore a definite conclusion on the jet presence outside the S2 region.
Note that our current data do not resolve the nuclear S2 source, whose X-ray and radio luminosities are measured for a region of pc radius, and could also be related to a small jet. However, the radio spectrum of S2 (, Sect. 2.1) does not have the typical slope observed for extragalactic jets or hot spots (, Kataoka & Stawarz 2005), but is instead more similar to that of radio-loud AGNs (Elvis et al. 1994), and therefore more likely produced by the base of a jet.
If present, the launch of a nuclear jet/outflow could account for a non-negligible fraction (of the order of a few percent) of the energy associated with the rest mass of the material being accreted (i.e., of ), as shown to be the case for M87 (Di Matteo et al. 2003), IC1459 (Fabbiano et al. 2003) and IC4296 (Pellegrini et al. 2003) and recently in a few other hot gas rich sources (Allen et al. 2006). This may be a characteristic of the late stages of galaxy evolution, when accretion onto the MBH falls below the Eddington rate (e.g., Churazov et al. 2005). Unfortunately, radio synchrotron emission traces poorly the true jet power (Owen et al. 2000, Bîrzan et al. 2004), with the ratio of the mechanical (kinetic) luminosity to the 1.4 GHz synchrotron luminosity ranging between a few and roughly a few thousand for luminous radio sources, and up to several thousand for weaker sources. Notwithstanding these uncertainties, we can estimate that the jet kinetic power could account for just a few of , for the nuclear radio source coincident with S2 and detected at 1.4 GHz, and at most this fraction for the S1 and S4 sources with upper limits at 1.4 GHz. An injection of energy from the nucleus may have heated the surroundings, so that accretion has been recently stopped or lowered to values below the estimated in the numerical simulations of P07 that do not include feedback (Di Matteo et al. 2003; Ciotti & Ostriker 2007).
3.6 Disk instability
The mode of accretion may switch to a quiescent state due to the change in internal structure of the accretion flow produced by disk instabilities (Siemiginowska et al. 1996, Janiuk et al. 2004), with the timescale in the low quiescent state longer than that in the active state. Then the accretion flow can be described by a hybrid model, where an outer torus or cold disk accumulates accreting matter at the steady accretion rate, while the inner torus/disk has a low accretion rate and is radiatively inefficient. The transition radius between the two regions is set by the hydrogen ionization instability and depends on the accretion conditions onto the outer torus.
For the MBH mass of NGC821 (Tab. 1) the gravitational radius is located at cm. Assuming an accretion rate of yr-1 (Sect. 3.1), the location of the ionization zone is at (Janiuk et al. 2004). In the hybrid model we expect the outer disk to be cold and to emit a thermal spectrum with a total disk luminosity for these parameters of about ergs sec-1, that will be radiated mainly in the optical and near IR bands. This value is well within the observed limits (Tab. 5 and Fig. 3). The X-ray luminosity will come from the inner quasi-spherical accretion flow and depend on the density and temperature of the plasma; its value needs to be self-consistently calculated, which is beyond the scope of this work and will be addressed by Moscibrodzka et al. (in preparation).
3.7 A standard AGN (but very obscured)
We examine here the possibility that the nucleus of NGC821 is a normal AGN working at a very sub-Eddington rate of few, with erg s-1 estimated for a standard disc as described in Sect. 3.1, and test this hypothesis using the whole observed SED (Fig. 3). is 30–100 times larger than the upper limit on of pointlike nuclear emission (for a bolometric correction of , Elvis et al. 1994). We consider then the possibility that the X-ray radiation is heavily absorbed, so that the intrinsic is comparable to .
A Compton thin AGN with cm-2 (e.g., Bassani et al. 1999) can be excluded, since the X-ray spectrum of S2 does not show the characteristic cut-off at low energies (Tab. 2). A more interesting possibility is that S2 is a Compton thick AGN, where the direct nuclear emission is not detectable below keV because of an absorber of very large column density ( cm-2; e.g., Guainazzi et al. 2005). However, some few percent of the intrinsic emission is often scattered and reprocessed off some Compton thick ’mirror’ visible both to us and from the central continuum source, and may emerge below 10 keV with a flatter photon index than the intrinsic X-ray continuum (i.e., with ), as for example in the Circinus galaxy (Matt et al. 1999). The resulting X-ray spectrum also shows a very strong (equivalent width keV) iron fluorescent line (as in NGC1068, Levenson et al. 2006). S2 has quite a flat spectral shape (), reminiscent of what is found for Compton-thick sources; a 6.4 keV iron line is not seen in its X-ray spectrum, but only with a upper limit on its equivalent width of 2 keV (Tab. 2). Note also that extended emission has been observed associated with some obscured Seyfert nuclei, up to sizes of kpc (Elvis et al. 1990, Ogle et al. 2000), and is understood as emission from gas photoionized by the central AGN, or thermal emission from a hot collisionally ionized plasma that forms the intercloud medium. Therefore, this X-ray faint MBH may be an extreme scaled-down version of such obscured AGNs, and the extended S2 source could be nuclear flux scattered and fluorescing off cold gas. Evidence for Seyfert nuclei (including Compton-thick ones) being scaled-down versions of more luminous AGNs down to 2–10 keV luminosities of erg s-1 has been provided recently (Panessa et al. 2006, 2007), based on the significance of the correlation between and L(H) down to such low X-ray luminosity values. This implies a similar proportion of X-ray and UV ionizing radiation in high and low luminosity nuclei, so that the shape of their SEDs may be similar in these spectral regions.
If we assume that a typical 1% of the intrinsic AGN flux is scattered into our line of sight and observed as source S2 with a L(2–10 keV) erg s-1 (Tab. 2), the intrinsic erg s-1 for a standard AGN SED (Elvis et al. 1994), a luminosity that is consistent with . could be even higher, since some nearby AGN show % of their X-ray flux scattered, perhaps due to the lack of an appropriately positioned ’mirror’ (NGC4051, Uttley et al. 2003). An intrinsic 2–10 keV luminosity as large as assumed here would place the NGC821 nucleus way off the fundamental plane of Sect. 3.4 (increasing its x-axis value of 1.4 in Fig. 4), consistent with the hypothesis of a standard disc rather than a radiatively inefficient accretion flow.
How does this hypothesis of the nucleus of NGC821 being a scaled-down, highly obscured AGN compare with the available observational constraints?
The intrinsic SED would have the typical AGN shape of Elvis et al. (1994) shown in Fig. 3, rescaled up by a factor of for a 1% reflectance (since the average AGN SED in Fig. 3 is normalized to the upper limit on pointlike X-ray emission in Tab. 2, that is times lower than the whole X-ray luminosity of S2). The upper limits in the V and I bands allow for this shift, but the NICMOS F160W band limit lies just a factor above both the radio-quiet and radio-loud SEDs before rescaling. Even though the dispersion in the SEDs of AGN is rather large (even an order of magnitude in the X-ray to optical-UV ratio, Risaliti & Elvis 2004), scaling up the optical–IR SED of NGC821 by only a factor of and the X-rays by a factor of would produce an index of , that is definitely too low with respect to what typically observed (Risaliti & Elvis 2004). Therefore, a hidden AGN may have a % reflectance, rather than 1% as assumed above, and then erg s-1. This is a factor of lower than , which could be explained by a similarly lower value of the radiative efficiency (with respect to the standard value of 0.1 used to estimate in Sect. 3.1) and/or of (due, e.g., to angular momentum in the flow before being captured by the MBH, Sect. 3.2). With a 20% reflectance, and the H upper limit of Sect. 3.3, this nucleus would lie close to the L(2–10 keV)–LHα correlation (Panessa et al. 2006), at higher X-ray luminosities with respect to the best fit line but within the observed scatter.
Another observational constraint comes from the fact that thermal reradiation of an obscured continuum should appear as dust emission in the IR. The IRAC data in Fig. 3 fit very well to the SED of a stellar population (Sect. 3.3), so that any warm/hot dust must be negligible. The flux (Tab. 5) corresponds to erg s-1, and any fraction due to dust must be much less than this. A conservative limit would be that the dust flux is less than the difference of the fluxes at and , otherwise the SED would depart from the galaxy template. That difference (0.5 mJy, from Tab. 5) corresponds to a luminosity limit of erg s-1, that is a factor of a few less than . The prevalence of a non-nuclear origin for the IRAC measurements, that refer to an area of 4 square arcseconds, is indicated also by a color analysis. IRAC colors have been shown to provide a robust technique for identifying AGNs, i.e., inactive galaxies can be separated from AGNs in a [3.6]–[4.5] versus [5.8]–[8.0] plot (Stern et al. 2005). We calculated such colors for the nucleus of NGC821, using fluxes derived with a local background in order to better single out the nuclear emission (Tab. 4), and found that it falls well within the region of normal galaxies. This confirms that stars within the central radius dominate over the IR nuclear emission (Sect. 3.3). Longer wavelength data are crucial to definitely rule out the possibility of heavily obscured emission. Unfortunately, NGC821 has not been detected by (Knapp et al. 1989)888With IRAS data just an uncertain detection of 0.5 Jy at 100 could be placed [J. Knapp 1994, private communication to NED (http://nedwww.ipac.caltech.edu/)], corresponding to erg s-1.. MIPS imaging has been scheduled and, possibly together with deeper /NICMOS F160W images, should be useful to definitely test the hypothesis of a hidden AGN.
4 Summary and conclusions
NGC821 is an extreme example of a quiescent MBH, for which deep and VLA observations revealed a very sub-Eddington nuclear source for the first time. Since NGC821 is relatively nearby, it is a good testcase to study how accretion proceeds in the very low luminosity galactic nuclei that are the vast majority in the local universe (Sect. 1). Our multiwavelength analysis has shown that:
-
1.
A radio counterpart to the nuclear source S2 is detected at 1.4 GHz, with a flux density of 127 Jy. A source is also marginally (at the level) detected at 4.8 and 8.4 GHz. Within current uncertainties, the radio spectral shape of the nuclear source is relatively flat. Upper limits can be placed at the positions of the other elongated sources in the central galactic region (S1 and S4).
-
2.
The central radius region is also detected with IRAC, with the emission peak coincident with the position of the galactic center. Archival images taken with WFPC2/F555W, WFPC2/F814W and NICMOS (H-band) do not show a pointlike source at the galactic center.
-
3.
A dead MBH could be expected from the lack of detection of fuel at all wavelengths. However, the stellar mass losses in the circumnuclear region should produce a luminosity of few erg s-1, if they end in a standard disc (such a scaled-down AGN would work at few).
-
4.
Disc-like stellar kinematics in the central galactic region, with the consequent angular momentum of the accretion flow at large radii, may account for a reduction of the mass accretion rate; MHD simulations with rotation and cooling by radiation included are needed to estimate the final luminosity of the flow.
-
5.
Starformation in the accreting material could also reduce the actual fuel supply to the MBH. The mid-IR to V-band photometric data for the central radius region, though, are very well fitted by the spectral energy distribution of an old and metal rich stellar population.
-
6.
The upper limit on pointlike 2–10 keV nuclear emission, together with the 5 GHz () and 8.4 GHz () detections, and the MBH mass known from data, are consistent with the predictions for radiatively inefficient accretion coupled to a compact, nuclear jet. The relatively flat radio spectral shape of the nuclear source is also consistent with being produced by the base of a jet.
-
7.
The extended sources S1 and S4 could be due to several knots in a jet, given their X-ray–to–radio luminosity ratios not too far from those observed for the knots in the jet of Cen A; more sensitive radio observations are needed to draw final conclusions on this possibility. If these sources or the central radio source are jet-like, their mechanical energy would be a very small fraction (a few) of the energy associated with the rest mass of the material being accreted.
-
8.
The nucleus of NGC821 could be a standard AGN working at few but heavily obscured as in a Compton-thick source, possibly also extended as S2 is. The NICMOS upper limit on the nuclear emission constrains the reflectance in the X-rays, but does not rule out this possibility. Thermal re-radiation by dust is expected in the obscured scenario: the possible presence of warm/hot dust is already constrained by the mid-IR data, but far-IR observations are needed to assess the emission from cold dust.
In conclusion, the deep study of the nucleus of NGC821 has shown that MBHs in the local universe are still emitting, though at an extremely low level, even in low ellipticals, that are expected to be very poor of hot gas. This agrees with the findings of hydrodynamical simulations that stellar mass losses in the circumnuclear region can fuel the MBH, even in low galaxies. The present multiwavelength investigation leaves open the possibilities that the final stages of accretion are radiatively inefficient, or that a standard disc in a Compton-thick scaled-down AGN is present (provided that the radiative efficiency and/or the mass accretion rate are reduced). Deeper NICMOS and radio observations, together with far-IR data, are expected to solve the puzzle of the nature of the accretion process in this intriguing nucleus.
References
- (1) Allen, S. W., Dunn, R. J. H., Fabian, A. C., Taylor, G. B., Reynolds, C. S. 2006, MNRAS, in press
- (2) Anderson, J. M., Ulvestad, J. S., Ho, L. C. 2004, ApJ 603, 42
- (3) Balbus, S.A., Hawley, J.F. 2002, ApJ 573, 749
- (4) Bassani, L., Dadina, M., Maiolino, R., Salvati, M., Risaliti, G., Della Ceca, R., Matt, G., Zamorani, G. 1999, ApJS 121, 473
- (5) Bîrzan, L., Rafferty, D.A., McNamara, B.R., Wise, M.W., Nulsen, P.E.J. 2004, ApJ 607, 800
- (6) Blandford, R.D., Begelman, M.C. 2004, MNRAS 349, 68
- (7) Bolzonella, M., Miralles, J.M., Pelló, M. 2003, A&A 363, 476
- (8) Bondi, H. 1952, MNRAS, 112, 195
- (9) Bruzual, G., Charlot, S. 2003, MNRAS 344, 1000
- (10) Churazov, E., Sazonov, S., Sunyaev, R., Forman, W., Jones, C., Böhringer, H. 2005, MNRAS 363, L91
- (11) Ciotti L., D’Ercole A., Pellegrini S., Renzini A. 1991, ApJ 376, 380
- (12) Ciotti, L., & Ostriker, J.P. 2001, ApJ, 551, 131
- (13) Ciotti, L., & Ostriker, J.P. 2007, in press on ApJ (astro-ph/0703057)
- (14) Croton, D.J., Springel, V., White, S.D.M., et al. 2006, MNRAS 365, 11
- (15) David, L.P., Forman, W., Jones, C. 1991, ApJ 369, 121
- (16) de Vaucouleurs G., de Vaucouleurs A., Corwin Jr. H.G., Buta R.J., Paturel G., Fouque P., 1991, Third Reference Catalogue of Bright Galaxies, (New York: Springer Verlag) (RC3)
- (17) De Villiers, J.-P., Hawley, J. F., & Krolik, J. H. 2003, ApJ, 599, 1238
- (18) Dickey, J. M., Lockman, F. J. 1990, ARA&A 28, 215
- (19) Di Matteo, T., Allen, S.W., Fabian, A.C., Wilson, A.S., & Young, A.J. 2003, ApJ, 582, 133
- (20) Elvis, M., Fassnacht, C., Wilson, A. S., Briel, U. 1990, ApJ 361, 459
- (21) Elvis M., Wilkes, B.J., McDowell, J.C., et al., 1994, ApJS 95, 1
- (22) Elvis, M., Risaliti, G. 2004, Supermassive Black Holes in the Distant Universe, Amy J. Barger ed., Kluwer Academic Publishers, Dordrecht, The Netherlands, p.187
- (23) Emsellem, E., Cappellari, M., Peletier, R.F., et al. 2004, MNRAS 352, 721
- (24) Fabbiano, G., Elvis, M., Markoff, S., Siemiginowska, A., Pellegrini, S., Zezas, A., Nicastro, F., Trinchieri, G., & McDowell, J. 2003, ApJ 588, 175
- (25) Fabbiano, G., Baldi, A., Pellegrini, S., Siemiginowska, A., Elvis, M., Zezas, A., & McDowell, J. 2004, ApJ, 616, 730
- (26) Fabian, A.C., & Canizares, C.R. 1988, Nature, 333, 829
- (27) Fabian, A. C., Sanders, J. S., Taylor, G. B., Allen, S. W., Crawford, C. S., Johnstone, R. M., Iwasawa, K. 2006, MNRAS 366, 417
- (28) Falcke, H., Koerding, E., Markoff, S. 2004, A&A 414, 895
- (29) Fazio, G. G., Hora, J. L., Allen, L. E., et al. 2004, ApJS 154, 10
- (30) Ferrarese, L., Merritt, D. 2000, ApJ 539, L9
- (31) Ferrarese, L., Ford, H. 2005, Space Science Reviews 116, 523
- (32) Gebhardt, K., Bender, R., Bower, G., et al. 2000, ApJ 539, L13
- (33) Gebhardt, K., Richstone, D., Tremaine, S., et al. 2003, ApJ, 583, 92
- (34) Graham, A. W., Erwin, P., Caon, N., & Trujillo, I. 2001, ApJ, 563, L11
- (35) Guainazzi, M., Fabian, A.C., Iwasawa, K., Matt, G., Fiore, F. 2005, MNRAS 356, 295
- (36) Hardcastle, M. J., Worrall, D. M., Kraft, R. P., Forman, W. R., Jones, C., & Murray, S. S. 2003, ApJ593, 169
- (37) Hawley, J. F., & Balbus, S. A. 2002, ApJ, 573, 738
- (38) Ho, L.C. 2002, ApJ 564, 120
- (39) Ho, L. C., Filippenko, A. V., Sargent, W. L. W. 2003, ApJ 583, 159
- (40) Ho, L.C. 2005, Ap&SS 300, 219
- (41) Hopkins, P.F., Hernquist, L., Cox, T. J., Di Matteo, T., Robertson, B., Springel, V. 2006a, ApJS 163, 1
- (42) Hopkins, P.F., Narayan, R., Hernquist, L. 2006b, ApJ 643, 641
- (43) Janiuk, A., Czerny, B., Siemiginowska, A., & Szczerba, R. 2004, ApJ 602, 595
- (44) Igumenshchev, I.V., Narayan, R., Abramowicz, M.A. 2003, ApJ 592, 2042
- (45) Kataoka, J., Stawarz, Ł. 2005, ApJ, 622, 797
- (46) Kataoka, J., Stawarz, Ł., Aharonian, F., Takahara, F., Ostrowski, M., Edwards, P. G. 2006, ApJ, 641, 158
- (47) Kennicutt, R.C. 1998, ARA&A 36, 189
- (48) Knapp, G. R., Guhathakurta, P., Kim, D.-W., Jura, M. A. 1989, ApJS 70, 329
- (49) Körding, E. G., Jester, S., Fender, R. 2006, MNRAS 372, 1366
- (50) Kroupa, P. 2001, MNRAS 322, 231
- (51) Lauer T.R., et al. 2005, AJ 129, 2138
- (52) Loewenstein, M., Mushotzky, R.F., Angelini, L., Arnaud, K.A., & Quataert, E. 2001, ApJ, 555, L21
- (53) Levenson, N. A., Heckman, T. M., Krolik, J. H., Weaver, K. A., Zycki, P. T. 2006, ApJ 648, 111
- (54) Machacek, M., Nulsen, P. E. J., Jones, C., Forman, W. R. 2006, ApJ 648, 947
- (55) Matt, G., Guainazzi, M., Maiolino, R. et al. 1999, A& A 341, L39
- (56) McNamara, B. R., Nulsen, P. E. J., Wise, M. W., Rafferty, D. A., Carilli, C., Sarazin, C. L., Blanton, E. L. 2005, Nature 433, 45
- (57) Merloni, A., Heinz, S., Di Matteo, T. 2003, MNRAS 345, 1057
- (58) Moscibrodzka, M. 2006, A&A 450, 93
- (59) Nagar, A., Falcke, H., Wilson, A.S. 2005, A&A 435, 521
- (60) Narayan, R. 2005, Ap&SS 300, 177
- (61) Nemmen, R.S., Storchi-Bergmann, T., Yuan, F., Eracleous, M., Terashima, Y., Wilson, A.S. 2006, ApJ643, 652
- (62) Ogle, P. M., Marshall, H. L., Lee, J. C., Canizares, C. R. 2000, ApJ 545, 81
- (63) Omma, H., Binney, J., Bryan, G., & Slyz, A. 2004, MNRAS, 348, 1105
- (64) Ostriker, J.P., Ciotti, L. 2005, RSPTA 363, 667
- (65) Owen, F. N., Eilek, J. A., Kassim, N. E. 2000, ApJ 543, 611
- (66) Panessa, F., Bassani, L., Cappi, M., Dadina, M., Barcons, X., Carrera, F. J., Ho, L. C., Iwasawa, K. 2006, A&A 455, 173
- (67) Panessa, F., Barcons, X., Bassani, L., Cappi, M., Carrera, F. J., Ho, L. C., Pellegrini, S. 2007, A&A in press
- (68) Pellegrini S., Venturi, T., Comastri, A., Fabbiano, G., Fiore, F., Vignali, C., Morganti, R., Trinchieri, G. 2003, ApJ 585, 677
- (69) Pellegrini, S. 2005a, ApJ, 624, 155
- (70) Pellegrini, S. 2005b, MNRAS 364, 169
- (71) Pellegrini, S., Baldi, A., Kim, D.W., Fabbiano, G., Soria, R., Siemiginowska, A., Elvis, M. 2007, submitted to ApJ (P07)
- (72) Pinkney, J., Gebhardt, K., Bender, R., et al. 2003, ApJ 596, 903
- (73) Proctor, R. N., Forbes, D. A., Forestell, A., Gebhardt, K. 2005, MNRAS 362, 857
- (74) Proga, D., Begelman, M.C. 2003, ApJ 592, 767
- (75) Ptak, A., Terashima, Y., Ho, L. C., Quataert, E. 2004, ApJ 606, 173
- (76) Quataert, E., Di Matteo, T., Narayan, R., Ho, L.C. 1999, ApJ525, L89
- (77) Ravindranath, S., Ho, L.C., Peng, C.Y., Filippenko, A.V., Sargent, W.L.W. 2001, AJ 122, 653
- (78) Sarzi, M., Falcon-Barroso, J., Davies, R.L., et al. 2006, MNRAS 366, 1151
- (79) Sazonov, S.Yu., Ostriker, J.P., Ciotti, L., Sunyaev, R.A. 2005, MNRAS, 358, 168
- (80) Schlegel et al. 1998, ApJS 500, 525
- (81) Scorza, C., Bender, R. 1995, A&A 293, 20
- (82) Shakura, N.J., & Sunyaev, R.A. 1973, A&A, 24, 337
- (83) Siemiginowska, A., Czerny, B., Kostyunin, V. 1996, ApJ 458, 491
- (84) Soria, R., Fabbiano, G., Graham, A., Baldi, A., Elvis, M., Jerjen, H., Pellegrini, S., Siemiginowska, A. 2006a, ApJ 640, 126
- (85) Soria, R., Graham, A., Fabbiano, G., Baldi, A., Elvis, M., Jerjen, H., Pellegrini, S., Siemiginowska, A. 2006b, ApJ 640, 143
- (86) Springel, V., Di Matteo, T., Hernquist, L. 2005, ApJ 620, L79
- (87) Stern, D., Eisenhardt, P., Gorjian, V., et al. 2005, ApJ 631, 163
- (88) Stone, J.M., Pringle, J.E., Begelman, M.C. 1999, MNRAS 310, 1002
- (89) Tan, J., Blackman, E. 2005, MNRAS 362, 983
- (90) Terashima, Y., Wilson, A.S. 2003, ApJ 583, 145
- (91) Tonry, J.L., Dressler, A., Blakeslee, J.P., et al. 2001, ApJ, 546, 681
- (92) Uttley et al. 2003, ApJ 595, 656
- (93) Wang, R., Wu, X.-B., Kong, M.-Z. 2006, ApJ 645, 890
- (94) Werner, M. W., Roellig, T. L., Low, F. J., et al. 2004, ApJS 154, 1
- (95) Wrobel, J. M., Heeschen, D. S. 1991, AJ 101, 148
- (96) Wu, Q., Cao, X. 2005, ApJ 621, 130
- (97) Yuan, F., Cui, W. 2005, ApJ 629, 408
- (98) Zensus, J.A. 1997, ARA&A 35, 607
| TypeaaType, and size from de Vaucouleurs et al. (1991; RC3). The size gives the major and minor axis of the D25 ellipse, that is the 25.0 B-mag/square arcsec isophote. The position angle is (RC3). | BaaType, and size from de Vaucouleurs et al. (1991; RC3). The size gives the major and minor axis of the D25 ellipse, that is the 25.0 B-mag/square arcsec isophote. The position angle is (RC3). | DbbDistance D from Tonry et al. (2001). | log | SizeaaType, and size from de Vaucouleurs et al. (1991; RC3). The size gives the major and minor axis of the D25 ellipse, that is the 25.0 B-mag/square arcsec isophote. The position angle is (RC3). | ReccEffective radius Re in the R-band (from Soria et al. 2006b). | ddEffective stellar velocity dispersion (averaged over ) from Pinkney et al. (2003). | NHeeGalactic hydrogen column density (Dickey & Lockman 1990). | ffGebhardt et al. (2003) report a value of 3.7, later revised to the value given here (Richstone et al., astro-ph/0403257) that is considered more reliable (Gebhardt, K. 2006, private communication). | 1′′ |
|---|---|---|---|---|---|---|---|---|---|
| (mag) | (Mpc) | () | (arcmin) | (′′,kpc) | (km s-1) | (cm-2) | () | (pc) | |
| E6 | 11.72 | 24.1 | 10.27 | 2.57x1.62 | 43.9, 5.1 | 209 | 6.2 | 8.5 | 117 |
| Position (J2000) | RA | Dec | Ref. |
|---|---|---|---|
| (galactic center) | .13 | P07 | |
| .10 | P07 | ||
| VLA | Sect. 2.1 | ||
| .11 | Sect. 2.2 | ||
| SizeaaLength of semi-major and semi-minor axes of the ellipse describing the source shape, derived by the CIAO task (P07). | |||
| Spectral analysis of data: | |||
| Net countsbbFrom a total net exposure time of 226 ksec. | 246 | ||
| Model : | |||
| NH (1021 cm-2) | |||
| dof | 11.5/9 | ||
| L(0.3–8 keV)/ erg s-1 | 6.0 | ||
| L(2–10 keV)/ erg s-1 | 3.8 | ||
| Model ccThe energy of the gaussian emission line has been fixed at 6.4 keV. : | |||
| NH (1021 cm-2) | |||
| EW (keV) | 0.9 () | ||
| dof | 11.2/8 | ||
| L(0.3–8 keV)/ erg s-1 | 6.3 | ||
| L(2–10 keV)/ erg s-1 | 5.0 | ||
| Pointlike emissionddCalculated as described in P07. within S2: | |||
| L(0.3–8 keV)/ erg s-1 | |||
| L(2–10 keV)/ erg s-1 |
| S1 | S4 | |
| Size (ellipse)aaLength of semi-major and semi-minor axes of the ellipse describing the source shape, derived by the CIAO task (P07). | ||
| Net countsbbFrom a total net exposure time of 226 ksec. | 178 | 82 |
| Model : | ||
| NH (1021 cm-2) | ||
| 7.3/6 | 2.1/5 | |
| L(0.3–8 keV)/ erg s-1 | 4.7 | 1.9 |
| Band | Flux density (mJy) | Flux density (mJy) |
|---|---|---|
| local bkgd | field bkgd | |
| 3.6 | 2.4 0.5 | 5.6 0.5 |
| 4.5 | 1.1 0.4 | 3.1 0.4 |
| 5.8 | 0.7 0.2 | 1.8 0.2 |
| 8 | 0.4 0.3 | 1.3 0.2 |
| Band | Flux Density | (erg s | Region (′′) | Instrument |
|---|---|---|---|---|
| 1.4 GHz | Jy | aa”Region” gives here the beam size; the position angle of the beam is -56∘ at 4.8 and 8.4 GHz. | VLA (Sect. 2.1) | |
| 4.8 GHz | (Jy)bbThe 4.8 GHz is a detection, and the 8.4 GHz is a detection. | () | aa”Region” gives here the beam size; the position angle of the beam is -56∘ at 4.8 and 8.4 GHz. | ′′ |
| 8.4 GHz | (Jy)bbThe 4.8 GHz is a detection, and the 8.4 GHz is a detection. | () | aa”Region” gives here the beam size; the position angle of the beam is -56∘ at 4.8 and 8.4 GHz. | ′′ |
| 15 GHz | mJy | R=0.15 circle | VLA ( limit; Nagar et al. 2005) | |
| 8 | 1.3 0.2 mJy | R= circle | IRAC (Sect. 2.2) | |
| 5.8 | 1.8 0.2 mJy | ′′ | ′′ | |
| 4.5 | 3.1 0.4 mJy | ′′ | ′′ | |
| 3.6 | 5.6 0.5 mJy | ′′ | ′′ | |
| 1.6 | mJyccUpper limits to any ”AGN” flux density (the brightness profile is consistent with that of the normal galactic stellar emission). | R= circle | NICMOS (Ravindranath et al. 2001) | |
| I () | 7.45 mJy | R= circle | WFPC2 F814W (Sect. 2.3) | |
| ′′ | mJyccUpper limits to any ”AGN” flux density (the brightness profile is consistent with that of the normal galactic stellar emission). | R= circle | ′′ | |
| R () | 5.47 mJy | R= circle | INT (Sect. 2.3) | |
| V () | 3.54 mJy | ′′ | WFPC2 F555W (Sect. 2.3) | |
| ′′ | mJyccUpper limits to any ”AGN” flux density (the brightness profile is consistent with that of the normal galactic stellar emission). | R= circle | ′′ | |
| Hz | ph.cm-2s-1keV-1 | ACIS-Sdd upper limits on pointlike nuclear emission (P07). (Sect. 2) | ||
| Hz | ph.cm-2s-1keV-1 | ′′ | ′′ | |
| Hz | ph.cm-2s-1keV-1 | ′′ | ′′ |
Note. — The column density is in addition to the Galactic one. Errors give the 68% confidence interval for one interesting parameter.
Note. — The column density is in addition to the Galactic one (see P07). Errors give the 68% confidence interval for one interesting parameter.
Note. — Fluxes are given for two choices of the background: estimated from a surrounding annulus (local) and from an off-source circle (field), see Sect. 2.2.