A deep look at the low LB elliptical NGC 821:
X-ray binaries, a galactic wind and emission at the nucleus
Abstract
The relatively nearby (distance=24.1 Mpc) elliptical galaxy NGC821, hosting a central massive black hole but inactive at all wavelengths, was observed with for a total exposure of 230 ksec, to search for nuclear emission and gas available for accretion. Within its optical image, 41 sources were detected, with spectral properties typical of low mass X-ray binaries (LMXBs). The fractions of LMXBs in the field and in globular clusters were determined, together with their X-ray luminosity function (XLF) down to L(0.3–8 keV)=2 erg s-1. At the galactic center a source of L(0.3–8 keV)= erg s-1 was detected for the first time, slightly extended. Its spectral shape is quite hard (), without intrinsic absorption. It is surrounded by three sources with spectral shape typical of LMXBs and luminosities on the brightest end of the XLF. One is consistent with being pointlike; the others could be the superposition of few point sources and/or truly diffuse emission, with one resembling a jet-like feature. Diffuse emission was detected out to , and comes mostly from unresolved LMXBs, with a minor contribution from other types of stellar sources. Different lines of investigation consistently provide no evidence for hot gas. Hydrodynamical simulations show that stellar mass losses are driven out of NGC821 in a wind sustained by type Ia supernovae, but also hot accreting gas within a very small inner region. A companion paper presents further observational results from and the VLA, and possible accretion modalities for this central massive black hole.
1 Introduction
NGC 821 is an isolated elliptical galaxy at a distance of 24.1 Mpc (Smith et al. 2004; see Table 1), with very regular optical isophotes of disky shape (Bender et al. 1994, Lauer et al. 2005) and an old and metal rich stellar population as typical of elliptical galaxies (Proctor et al. 2005). No cold (HI) or dusty ISM has been revealed in it (Lauer et al. 2005, Sarzi et al. 2006). NGC 821 is also one of those nearby galactic spheroids for which a central supermassive black hole (MBH) has been claimed based on resolved dynamical studies (Ferrarese & Ford 2005). The mass of this MBH is (Table 1) and its Eddington luminosity is . However, this MBH is extremely quiescent at all wavelengths (see also Pellegrini et al. 2007), and represents an excellent example of the class of ”inactive” nuclei, that are very common in the local universe (e.g., Pellegrini 2005a, Ho 2005) and key to our understanding of the mechanisms of AGN evolution and nuclear feedback, that have been fundamental for shaping our universe (e.g., Springel, Di Matteo & Hernquist 2005). Since it is nearby, NGC821 is a prime target for observing a quiescent nucleus and its surroundings.
X-ray emission is a key symptom of nuclear activity resulting from accretion onto a MBH (Rees 1984), and the hot ISM that could provide a source of fuel is readily visible in the X-rays (e.g., Fabian & Canizares 1988; Loewenstein et al. 2001; Pellegrini 2005a). Previous observations of NGC821 with the PSPC had placed an upper limit of erg s-1 (O’Sullivan et al. 2001) on the total X-ray luminosity, suggesting a low content of hot gas (e.g., Kim et al. 1992). With the sub-arcsecond resolution of we could attempt to resolve the different components of the X-ray emission, i.e., the hot gas, the nucleus and the population of low mass X-ray binaries (LMXBs; Fabbiano et al. 2004, hereafter F04). This previous shallow (39 ks) observation, performed in 2002, revealed diffuse emission in the central galactic region, possibly from a hot interstellar medium. We did not detect any source that could be unequivocally identified as the galactic nucleus (for which we derived ), but an intriguing S-shaped feature crossing the center of the galaxy was observed. Explanations for this feature included either a weak two-sided X-ray nuclear jet, or a hot gas filament, at a temperature higher than that of the surrounding gas. This opened the possibilities that the accretion power could end mostly into mechanical rather than radiative power (Di Matteo et al. 2003, Pellegrini et al. 2003a, Fabbiano et al. 2003), or that the accretion flow may be disrupted by nuclear feedback (e.g., Ciotti & Ostriker 2001, Omma et al. 2004; see also Soria et al. 2006a,b).
In this paper we report the results of the analysis of deep observations (for a total exposure of nearly 230 ks) aimed at defining the properties of the various sources in the central galactic region. With the deep exposure, we can constrain all the components (nucleus, hot gas, unresolved sources) contributing to the emission, a necessary and critical step when the goal is to understand the accretion process. For example, we can detect a significant portion of the LMXB population, which was barely visible in the 2002 data, and thanks to the calculation of its X-ray Luminosity Function (XLF) we can now discriminate between the contributions to the diffuse emission of the unresolved LMXBs and of the hot ISM (e.g., Kim & Fabbiano 2004). Moreover, determining the properties of the hot ISM also gives clues on the way the ISM evolves in this galaxy, and more in general in galaxies of similar optical luminosity (e.g., Pellegrini & Ciotti 1998, Sansom et al. 2006, David et al. 2006). A companion paper (Pellegrini et al. 2007) presents an observational campaign aimed at determining the properties of the nuclear emission of NGC 821 at various wavelengths, including more sensitive proprietary VLA and IRAC observations, together with archival observations.
The paper is organized as follows: in Section 2 we describe the observations and data preparation; in Section 3 we present the X-ray properties of the whole LMXB population of the galaxy, also making use of WFPC2 images to identify those in field and in globular clusters; in Sections 4 and 5 we report the results of the X-ray analysis respectively for the nuclear region and the diffuse emission; in Section 6 we discuss the implications of our observations; in Section 7 we summarize our results.
2 observations and data preparation
NGC 821 was observed with ACIS-S (Weisskopf et al. 2000) seven times between November 2002 and June 2005, for a total exposure of 230 ks (Table 2). Here we consider both the archival observations (ObsID 4408 and 4006 in Tab. 2), already presented in F04, and the new unpublished data obtained in 2004 and 2005.
The satellite telemetry is processed at the X-ray Center (CXC) with the Standard Data Processing (SDP) pipelines, to correct for the motion of the satellite and to apply instrument calibration. The data used in this work were reprocessed in custom mode with the version 7.6.0 of the SDP, to take advantage of improvements in processing software and calibration, not available at the time of the original processing. Verification of the data products showed no anomalies. The relative astrometry of the different observations was corrected by using detected sources (above a 3 threshold) as reference points (http://cxc.harvard.edu/cal/ASPECT/align_evt/).
The data products were then analyzed with the CXC CIAO v3.0.1 software and the HEASARC XSPEC package. CIAO Data Model tools were used for data processing, such as screening out bad pixels and producing images in given energy bands. Calibration files in CALDB version 3.1.0 of June 2005 were used. No significant background flares were observed in these data, so no further screening was necessary. A time-dependent gain correction (Vikhlinin et al. 2003) was applied to the SDP Level 2 event files of the first two observations before further analysis. This correction was already included in the SDP Level 2 event files of the other observations supplied by the CXC. The seven observations were then coadded to produce a deep image, using the CIAO task , which takes as input the event files and the relative aspect solution (ASOL) files, and reprojects the coordinates of all the observations onto the first one.
Below we report the results of the analysis of these data.
3 The Low Mass X-ray Binaries population
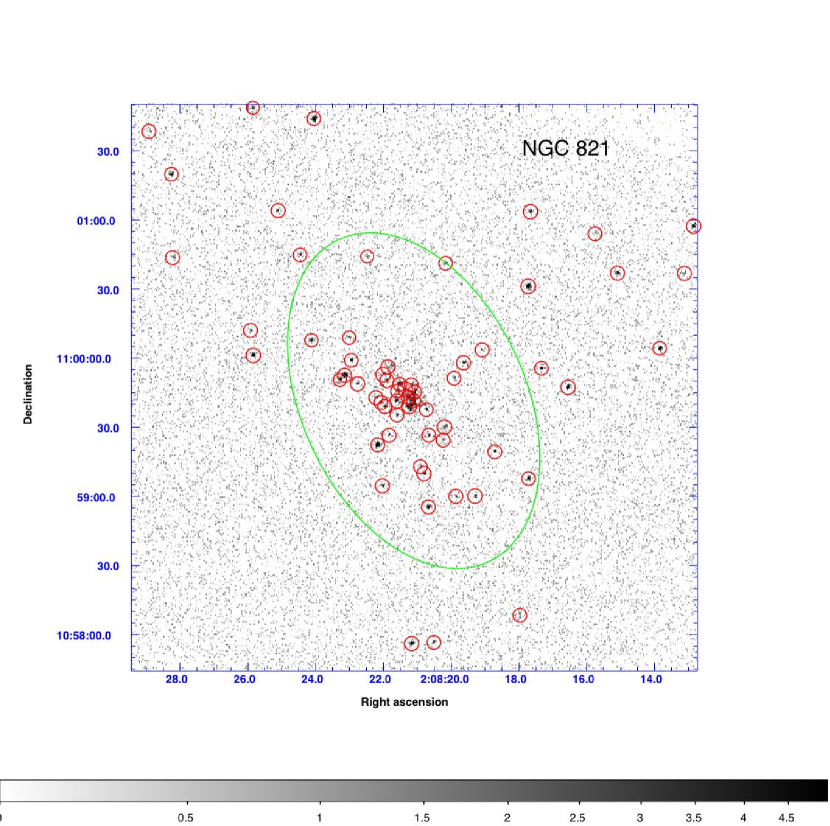
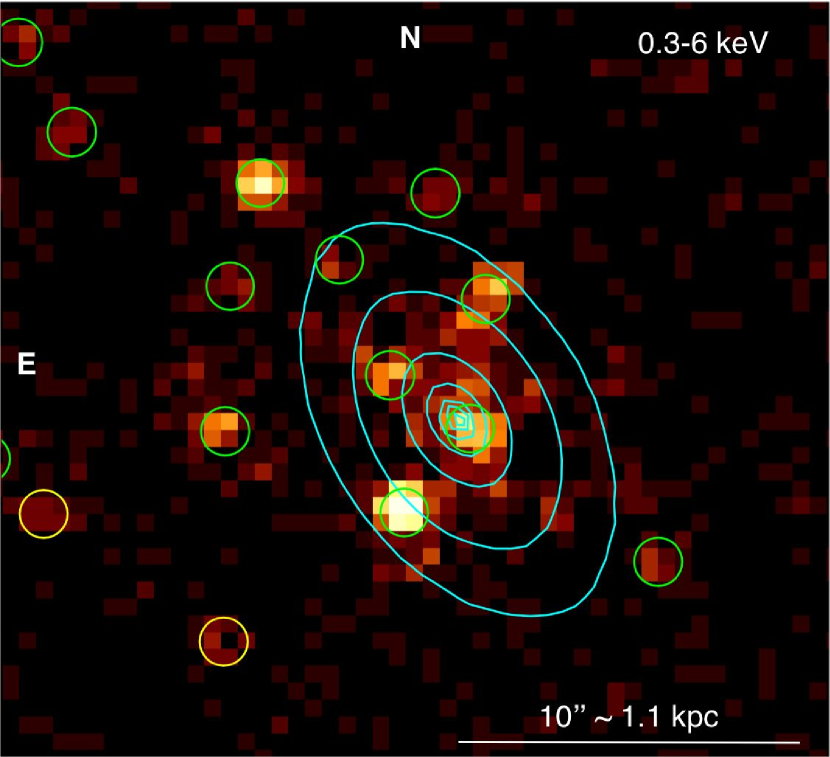
Figure 1 shows the merged X-ray image, with the D25 ellipse of NGC821 overplotted (this ellipse is the isophote of the 25.0 B-mag/square arcsec brightness level, Tab. 1); also marked are the X-ray sources detected by the CIAO task . Of the 104 sources detected within the ACIS-S3 CCD, 41 lie inside the D25 ellipse. Except for minor contamination from interlopers (see Sect. 3.2 and 5.6), and four particular sources in the central region (discussed in Sect. 4 below), these sources are pointlike and represent the LMXBs population of NGC821 (see Fabbiano 2006 for a review on X-ray binary populations of galaxies).
For the pointlike sources within D25, counts were extracted within a circle centered on the -determined source position, and background counts were estimated locally in an annulus surrounding the source. We chose the source extraction radius to be the 95% encircled energy radius at 1.5 keV (that is varying as a function of the off-axis angle), with a minimum of near the aim point. Similarly, the background was estimated for each source from an annulus surrounding it, with inner and outer radii of 2 and 5 times the source radius respectively. When nearby sources are found within the background region, they are excluded before measuring the background counts. Net count rates were then calculated with the effective exposure (including vignetting) for both the source and background regions. Errors on counts were derived following Gehrels (1986). When the source extraction regions of nearby sources overlap, to avoid an overestimate of their source count rates, we calculated the source counts from a pie-sector, excluding the nearby source region, and then rescaled them based on the area ratio of the chosen pie to the full disk. Once the correction factor is determined, the same factor can be applied to correct counts in all energy bands. For a small number of sources which overlap with nearby sources in a more complex way (e.g., overlap with more than 2 sources), instead of correcting the aperture photometry, we used the source cell determined by to extract the source counts.
The range of net detected counts for the pointlike sources is , corresponding to 0.3–8 keV luminosities of – erg s-1, when using the energy conversion factor described in Sect. 3.2 below. Most of the sources are too faint for a detailed spectral analysis, therefore their hardness ratio and X-ray colors were calculated in order to characterize their spectral properties. The X-ray hardness ratio is defined as HR = (HS) / (HS), where S and H are the net counts in the keV and keV bands respectively. Following the prescription of Kim et al. (2004), the X-ray colors are defined as C21 = log(C1/C2) and C32 = log(C2/C3), where C1, C2 and C3 are the net counts respectively in the energy bands of 0.3–0.9 keV, 0.9–2.5 keV and 2.5–8 keV. These counts were corrected for the temporal QE variation, referring them all to the first observing epoch (Nov. 2002, Tab. 2), and for the effect of the Galactic absorption (using the value in Table 1). By definition, as the X-ray spectra become harder, the HR increases and the X-ray colors decrease. For faint sources with a small number of counts, the formal calculation of the HR and colors often results in unreliable errors, because of negative net counts in one band and an asymmetric Poisson distribution. Therefore, we applied a Bayesian approach developed by Park et al. (2006), which models the detected counts as a non-homogeneous Poisson process, to derive the uncertainties associated with the HR and colors.
The main properties of the point sources detected in the merged observation within the D25 ellipse are summarized in Table 3, where the sources are listed in order of increasing distance from the galactic center. Column (1) gives the IAU name (following the convention that the name should be ”CXOU Jhhmmss.sddmmss”); columns (2) and (3) give the J2000.0 source position and column (4) its associated uncertainty at the 95% confidence level, determined based on the source net counts and off-axis angle, from the empirical formula given by Kim et al. (2007); column (5) gives the projected distance from the galactic center; columns (6) and (7) give the net counts and the error; columns (8) and (9) give the flux and luminosity in the 0.3–8 keV band, derived using the energy conversion factor described in Sect. 3.2 below; columns (10)–(15) give the hardness ratio HR, the C21 and C32 colors defined above, together with the respective error determined at a significance level.
3.1 Spectral properties and optical identification
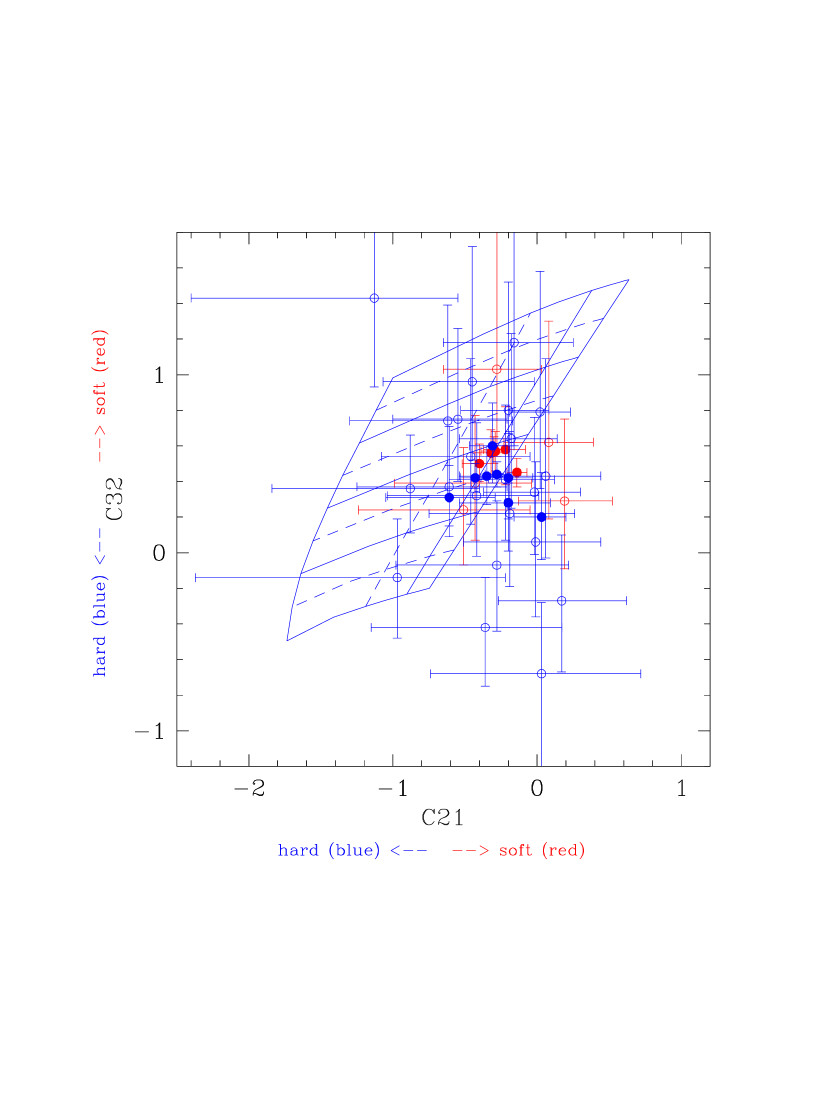
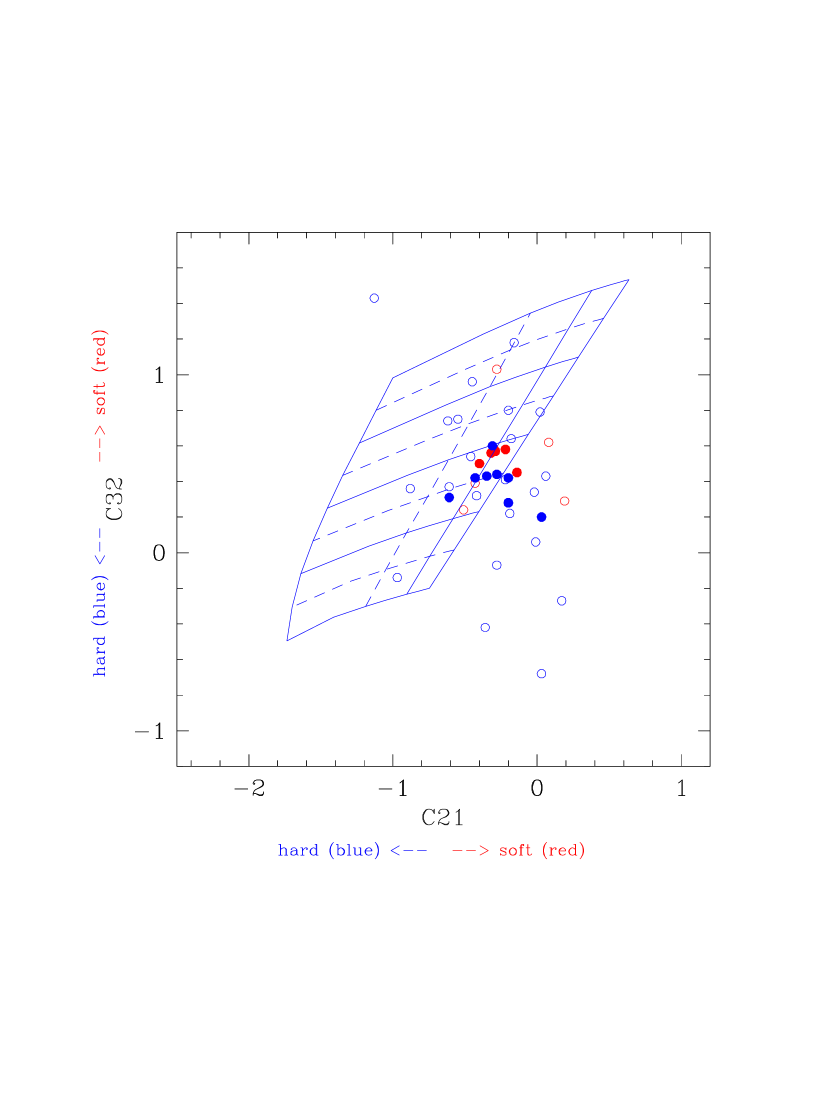
Figure 2 shows the C32 – C21 distribution of the point source population; the grid gives the location of spectra described by power laws with given values of the photon index and intrinsic column density . In agreement with previous spectral studies of LMXB populations (e.g., Kim, Fabbiano & Trinchieri 1992; Irwin, Athey & Bregman 2003, Fabbiano 2006), most well-defined colors fall near a typical spectrum, with no intrinsic absorption.
Three of the sources in Tab. 3 have been detected with a number of net counts sufficiently high for a specific spectral analysis (they are marked in Tab. 3). We performed such analysis, extracting from the merged event file the spectra for these sources, using an extraction radius of ; this radius was chosen to avoid contamination from nearby fainter sources. Instrumental response files, weighted by the exposure time of each individual observation, were also generated; the background spectrum was derived from a source-free region outside the optical body of the galaxy. The results of the spectral analysis (Tab. 4, Fig. 3) confirm that these sources are well described by power laws with low-to-moderate intrinsic absorption, as typical for the LMXB population. Their intrinsic 0.3–8 keV luminosities are 4.1, 6.9 and 8.9 erg s-1.
With the aid of WFPC2 images, we then investigated possible associations of our detected point sources with LMXBs belonging to the galactic field or to globular clusters (GC). Kundu & Whitmore (2001) studied the globular cluster population of NGC 821 using WFPC2 images in the (F555W) and (F814W) filters; these optical images cover a large fraction (%) of the D25 ellipse of NGC821. Kundu & Whitmore (2001) identified 105 GC candidates, whose positions, magnitudes and colors were kindly provided to us by A. Kundu (2007, private communication). This list of GCs was cross-correlated with the X-ray source list of Tab. 3, in order to look for GC/X-ray source coincidences. After correction for a small shift of the optical image (see Sect. 4.2 for more details), 6 matches were found well within the 95% uncertainty radius of the X-ray position; another potential match has quite a distorted shape and uncertain magnitude in the optical (CXOU J020817.7105907), since it is located at a chip edge, and another one has an offset of 1.24 times the X-ray positional uncertainty. These 8 sources are marked in Tab. 3 (see also Fig. 8). From a – diagram of the whole sample of 105 GC candidates, one can see that LMXBs are preferentially found in the brightest clusters (4 matches reside in the 5 brightest GCs, and 6 in the 12 brightest ones), following a general trend already reported (e.g., Sarazin et al. 2003, Kim E. et al. 2006) that is explained as the probability of hosting a LMXB increasing with the GC luminosity. The LMXBs of NGC821 also tend to be associated with the redder GCs, in agreement with previous works (e.g., Kundu et al. 2007), even though the small number of sources here does not make this result statistically significant.
From the WFPC2 images above, in the overlap region with the D25 ellipse, 17 X-ray sources have no optical counterpart, at a 50% completeness limit of 24.1 V-mags (A. Kundu 2007, private communication111This V-magnitude value together with those quoted in Sect. 4.2 have been computed by Kundu & Whitmore (2001) assuming the Burstein & Heiles (1982) reddening.); these can be considered field LMXB candidates, and are marked in Tab. 3. In the following we further limit the analysis to sources located at radii larger than , to avoid possible completeness problems near the galactic center (see Sect. 3.2 below). Then, it turns out that % of the X-ray sources lie in GCs. From studies this fraction is known to increase with the GC specific frequency of the galaxy, or the morphological type (e.g., Sarazin et al. 2003), and goes from % in S0s to 30–50% in Es (e.g., Fabbiano 2006 and references therein). The fraction estimated here for NGC821 is therefore close to what expected, given also its morphological type (E6). The fraction of GCs that host an X-ray source is %, a value broadly consistent with what typically observed previously from studies (3–5%, Sarazin et al. 2003, Kim, E. et al. 2006; see also Kundu et al. 2007), but somewhat higher, likely because of the larger depth of our X-ray observation compared to the previous analyses. Finally, there is no statistically significant difference between GC and field LMXBs. The present sample of X-ray sources is too small to investigate other statistical properties, such as the X-ray spectral difference between LMXBs in red and blue GCs or the role of galactocentric distance.
3.2 The LMXB X-ray Luminosity Function
For the point sources falling within the D25 ellipse we estimated an XLF, that in differential form can be expressed as:
| (1) |
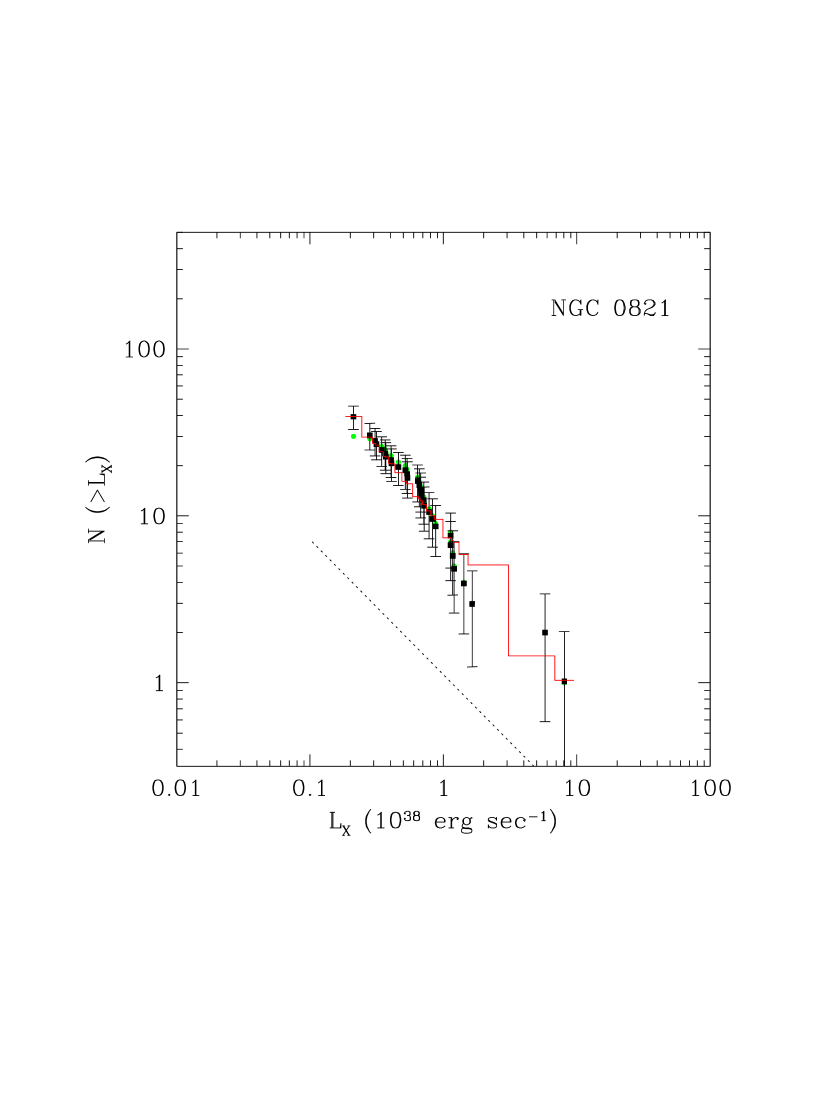
To construct the XLF, we calculated fluxes and luminosities of the point sources in the 0.3–8 keV band with an energy conversion factor (ECF) corresponding to an assumed power law spectral shape with and Galactic (see Fig. 2 for a justification of this assumption). The ECF was calculated with the arf (auxiliary response file) and the rmf (redistribution matrix file) generated for each source in each observation. As done for the colors, we took into account the temporal QE variation by calculating the ECF in each observation and then taking an exposure-weighted mean ECF. The ECF over the 0.3–8 keV band varied by % between 2002 and 2005. We then corrected the XLF to eliminate biases and incompleteness effects, which could affect the lowest luminosity range, causing an artificial break (Kim & Fabbiano 2003, 2004; Kim et al. 2006). Our procedure for correcting XLFs derived from data was developed and first applied to NGC1316 by Kim & Fabbiano (2003; see the Appendix therein, where the method is discussed in detail), and was then applied to a sample of early-type galaxies by Kim & Fabbiano (2004). A similar procedure had also been used to correct the XLF of the Antennae galaxies (Zezas & Fabbiano 2002). In brief, we simulated point sources, added them one by one to the observed image, and then run to determine whether the added source was detected. With this procedure we correct simultaneously for incompleteness near the detection threshold, Eddington bias (Eddington 1913) and source confusion. In the simulations, we assumed a typical XLF of differential slope of ; however, the adopted slope does not affect the results significantly, and neither does the assumed radial distribution of point sources (which we assume to follow the optical light, as observed in many elliptical galaxies, see Fabbiano 2006). We excluded central sources with in Tab. 3, because of the large photometric error caused by confusion with other overlapping sources, and by the possible presence of some diffuse emission; these conditions make the incompleteness corrections uncertain. With the above procedure, we established the 90% completeness limit (i.e., the luminosity at which 10% of sources would not be detected inside the D25 ellipse, excluding the central 10′′) to be erg s-1 (or erg cm-2 s-1) in the 0.3–8 keV band. We can reliably correct the XLF to a luminosity of of the 90% limit. The resulting cumulative XLF [i.e., the number of sources ] is shown in Fig. 4. From the log N – log S relation derived for the ChaMP plus CDF data (Kim et al. 2007), we then estimated that the number of expected cosmic background sources (mostly AGN) falling within the D25 ellipse and brighter than the 90% completeness limit is 3, corresponding to a source contamination of 7%.
To establish the functional form of the XLF, we fitted the bias-corrected differential XLF [eq. (1)] with single power-laws, using both the Cash and statistics in the CIAO modeling and fitting application. We found that a single power-law represents well the XLF, with a best fit slope , compatible with other power-law fits of LMXB XLFs (Kim & Fabbiano 2004; Kim et al. 2006) and a best fit amplitude . Even without the correction for incompleteness, that is significant only at the point corresponding to the faintest fluxes ( erg s-1), a single power law is a good fit all the way down to erg s-1. Figure 4 may suggest a low luminosity break around erg s-1. This break was suggested to be a universal feature of LMXB populations (Gilfanov 2004), but is not observed in all cases (Kim et al. 2006). For NGC821 there is no compelling evidence for such a break, given the size of the error bars, and the good fit with a single power-law model. The combined LMXB XLF (Kim & Fabbiano 2004; Gilfanov 2004) shows a high luminosity break at erg s-1, that may originate from the presence of neutron star and black hole binary populations. We cannot constrain here the high luminosity shape of the XLF because of the small number of luminous sources (only 2 sources have erg s-1).
In contrast to the uniform slope, the amplitude of the XLF varies widely from galaxy to galaxy, reflecting the varying content of LMXBs per unit galactic luminosity. For their sample of early type galaxies, from integration of the XLF above erg s-1, Kim & Fabbiano (2004) estimate the total due to LMXBs and the average ratio erg s-1 . For NGC821 this ratio is erg s-1 (see Sect. 5.5), lower than the mean value by . This ratio is known to correlate with the total specific frequency of globular clusters, but this quantity unfortunately is not available for NGC821. Based on the ratio, we would expect NGC821 to have a relatively poor GC population.
4 The central region of NGC821 – resolved sources
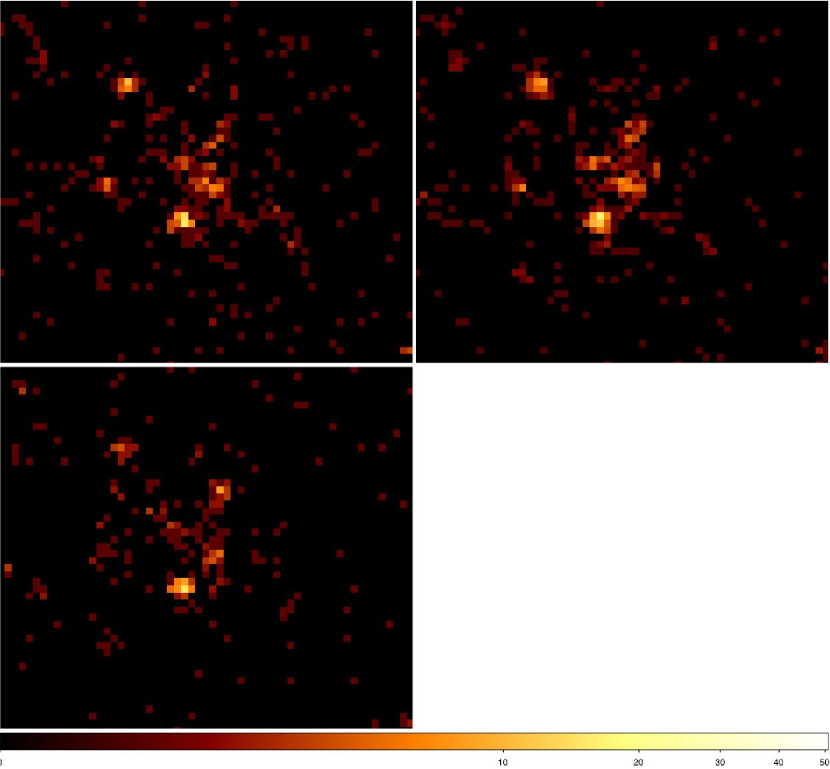
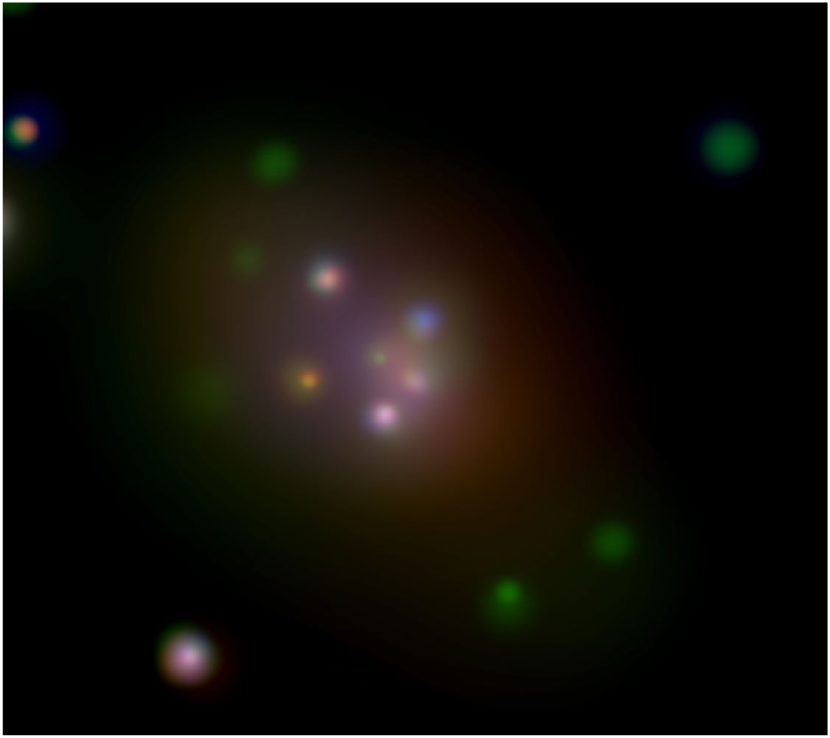
Figure 5 shows the central region of the image obtained from the merged data, in three spectral bands (0.3–1 keV, 1–2 keV and 2–4 keV) that cover the energy range where most of the counts are detected. From these three images in different spectral bands we also obtained an adaptively smoothed (using the CIAO task ‘csmooth’) color image (Fig. 6), where the data were smoothed using scales ranging from 1 to 20 pixels (). Given the small extent of the region considered, no exposure correction was needed. Figure 6 shows diffuse emission at the center, that follows the optical shape of the galaxy: it is elongated in the NW-SE direction, roughly aligned with the optical major axis (see also Tab. 1, Fig. 1 and Fig. 8 below). Most of the diffuse emission is concentrated well within one (that is , while the size of Fig. 6 is ). Its color indicates emission mostly in the soft (red) and medium (green) energy bands. Harder emission from a few central point-like sources is also visible.
Below we concentrate on the X-ray analysis of the sources detected in the central region; in Sect. 5 we report the analysis of the diffuse emission, for the central region and the whole galaxy.
4.1 Detection and spatial properties
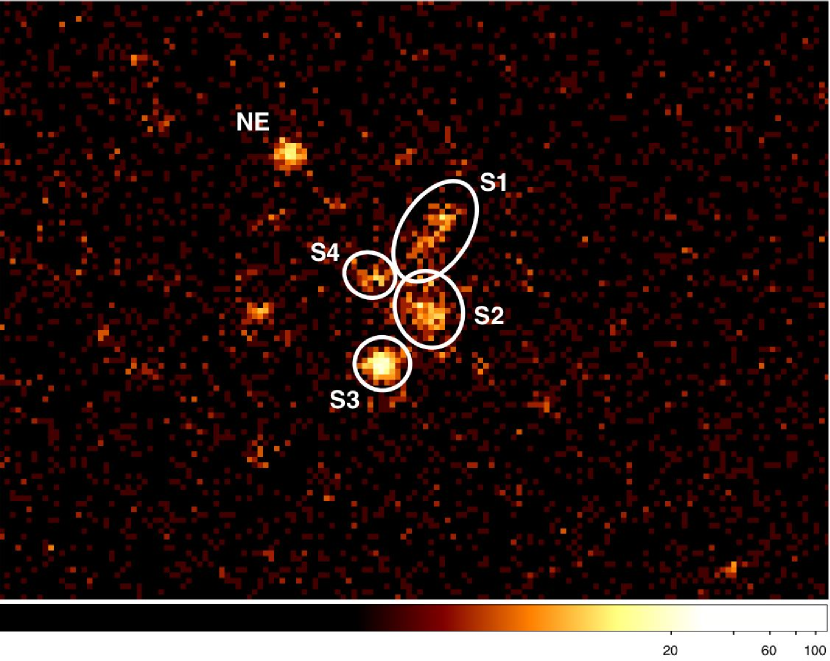
We can now establish with higher significance than in F04 the morphology of the central X-ray emission. In particular, F04 had identified three possibly connected extended central emission regions (that they called S1 through S3) and a point-like source to the north-east of this grouping (labelled NE source). detects all these emission regions in the merged data, plus another source that we call S4 (Fig. 7). F04 had found the spatial distribution of photons of the S1–S3 sources to be more extended than expected for point-like sources seen through the mirrors, and suggested that they may be part of an S-shaped jet or filament, possibly connected with low-level or past nuclear activity. With the longer exposure, it is apparent (Fig. 7) that the emission of S3 may be point-like, suggesting that this source is a luminous LMXB, but the other sources are more extended.
In order to establish the spatial properties of S1–S4, following F04 we compared the spatial distribution of their counts with that of the on-axis image of the quasar GB 1508+5714, a hard point-like source (Siemiginowska et al. 2003). GB 1508+5714 gives a good representation of the ACIS-S PSF for our analysis, since it lies at the same distance from the aimpoint as S1–S4 and is similarly hard (see Sect. 4.3 below). The image of GB 1508+5714 contains 5,300 counts within 2′′ of the centroid of the count distribution; the ratio of counts within the 1′′–2′′ annulus to those in the central circle of 1′′ radius is =0.043 (1). The isolated NE source in this central field (Fig. 7) has a total of 173 source counts and =0.1230.083, a value consistent with that of our reference quasar, within the 1 error.
The total number of source counts for S1–S4 are 184, 250, 326 and 84 respectively; the analogous ratios for the background-subtracted counts, around the centroids determined by , are = 0.590.11, =0.770.10, =0.200.06, and =0.800.15. Therefore the spatial distribution of the counts from S1–S4 is extended, when we compare it with that of the quasar. If, more conservatively, we use as a benchmark the NE source, we find that S3 is point-like, while S1, S2 and S4 are all significantly more extended than the NE source (at 3.5, 4.6 and 4 respectively). Although the significance of the NE source is such that its is less well determined than that of the quasar, this source would be affected by similar small amounts of smearing in the merging process as the S1–S4 sources. [Note that in F04 the NE source had a =0.057, consistent within the errors with the value we find here, although the nominal value is smaller; this justifies using NE as a benchmark.]
In conclusion, excluding source S3, the counts of S1, S2 and S4 cannot come entirely from a point source. While the previous observation was suggestive of a central emission feature intrinsically elongated, possibly mostly due to diffuse emission (F04), the present imaging analysis suggests a cluster of extended sources. With these data it remains possible that each source is truly extended or produced by several point-like components, or alternatively due to a point-like component embedded in truly diffuse emission.
4.2 Position of the nucleus - S2
From the Two Micron All Sky Survey (2MASS, Skrutskie et al. 2006), the center of NGC821 is at RA= .14, Dec= (J2000), with an uncertainty of (at 95% confidence), as reported in the NASA/IPAC Extragalactic Database (NED). Considering also the aspect uncertainty222The absolute astrometric accuracy is discussed at http://cxc.harvard.edu/cal/ASPECT/celmon/ (the uncertainty circle has a radius of , and the circle of ), this position agrees with that of the extended source S2 determined by , that is RA= .10, Dec= , with an offset of just .
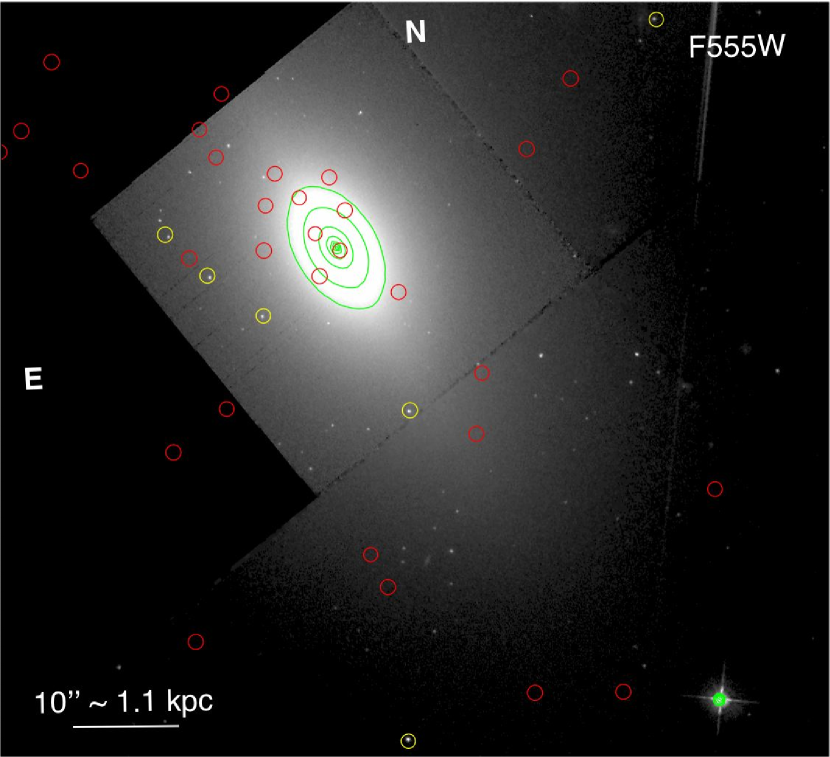
In addition, we compared the and positions by using the archival WFPC2 F555W and F814W filter images (also used by Kundu & Whitmore 2001, Sect. 3.1). First we improved the astrometry of the WFPC2 images, re-fitting the coordinate grid to all sources with positional errors in the 2MASS All-Sky Catalog of Point Sources (Cutri et al. 2003) and the USNO-B1.0 Catalog (Monet et al. 2003). We found 5 coincidences between the WFPC2 and the USNO-B1.0 sources, two of which are also 2MASS sources; with these, we improved the absolute astrometry to in the nuclear region. We then compared the recalibrated WFPC2 images with the image, and identified eight sources with optical/X-ray coincidences, not including the nuclear source S2 (Fig. 8). Of these, seven lie inside the D25 ellipse and have been already picked up in Sect. 3.1 as associated with globular clusters, with an offset smaller than the uncertainty in the X-ray position (Tab. 3); however, for the present astrometric analysis, we excluded one of them (CXOU J020817.7105907) located almost at a chip edge. The remaining six coincidences are shown with yellow circles in Figure 8. They have nearly pointlike appearance, as expected for GCs at the distance of NGC821, and their V-magnitudes range from 20.9 to 22.4, i.e., they are among the brightest GCs of NGC821 (Kundu & Whitmore 2001, as also discussed in Sect. 3.1). The eighth source with optical/X-ray coincidence is much brighter (by almost one magnitude in the V-band) than the brightest GC, and lies outside the D25 ellipse (it is located at RA= .72, Dec= ); it is unresolved and could be a background AGN, as there is a higher chance of a background source outside the optical image.
There is no systematic shift or rotation between the revised and positions. For each of the seven coincidences, the displacement between the optical and X-ray positions is , and the root-mean-square displacement for the whole sample is . The relative uncertainty between and is therefore good to , which suggests that the Chandra pointing was in fact very accurate. In the recalibrated WFPC2 image the optical nucleus is located at RA= .13, Dec= , that is within of the 2MASS position. As shown by Fig. 9, the WFPC2 nucleus is off the center of S2, a displacement larger than the average offset, which can be attributed to the fact that S2 is an extended source. In conclusion, within the accuracy of the best relative astrometry available, S2 is coincident with the optical center.
4.3 Spectral analysis of sources S1–S4
We extracted the spectra of sources S1–S4 from the merged event file, using the extraction regions shown in Fig. 7; the background spectrum was derived from a source-free region outside the optical body of the galaxy but still inside the ACIS-S3 chip. We also generated instrumental response files, weighted by the exposure time of each individual observation. Prior to fitting, we binned the spectra in order to have at least 20 total counts per energy bin, with the exception of the weakest source (S4) that was rebinned at 10 counts per energy bin333When grouping with different criteria, or using the Cash statistics instead of the one, the spectral results for this source do not change significantly.. We then fitted the spectra with an absorbed power-law model [XSPEC model: wabs(powerlaw)] and an optically thin thermal model corrected for absorption [XSPEC model: wabs(apec), with abundance Z=0.5 in solar units, and the solar abundance values of Anders & Grevesse 1989]; the absorption was let to be a free parameter. The low number of counts did not allow for fits with composite spectral models. The results are summarized in Table 5.
The spectral analysis indicates a hard spectral shape (thermal emission of keV or power law emission with ), with little or no intrinsic absorption. The resulting column densities are consistent with the Galactic value ( cm-2) for most of the fits in Table 5; if is fixed to be Galactic, the best fit spectral parameters are substantially unchanged within the uncertainties. The spectra of S1–S4 along with their best fit power law models are shown in Fig. 10. The spectral properties of S1–S4 are overall consistent with those typical of LMXBs (see, e.g., Sect. 3.1), even though these sources look extended (Sect. 4.1). The source at the nucleus (S2) seems to be harder than the other sources.
Table 5 lists the source luminosities calculated from the best fit parameters. S2 has a luminosity of about 6; since it is extended, a nuclear point source, if contributes to the emission of S2, will have a smaller luminosity. Since we have now established that S2 is coincident with the nucleus (Sect. 4.2), it is reasonable that a fraction of the S2 emission originates from the MBH. However, an estimate of this fraction would not be unique, because it will require some model assumptions (e.g., one could model S2 as a point source plus some extended emission in various ways). F04 derived a 3 upper limit for the nuclear luminosity of in the 0.3–10 keV band; they assumed that all of the detected emission in the central S-shaped feature (Sect. 4.1) was truly extended, and calculated the limit from the largest emission found in a sliding cell moved across this feature. In order to avoid model dependent results, we adopt as upper limit to the MBH emission the value derived with the same procedure used in F04, with the cell slid over and around S2. This gives a upper limit of in the 0.3–8 keV band, and in the 2–10 keV band.
5 The diffuse emission and the hot ISM contribution
Estimating the amount of gaseous emission in NGC821 is important, because this hot gas could be a source of fuel for the nuclear MBH (see Sect. 1). The ACIS-S adaptively smoothed mapped color image of the NGC 821 field (Fig. 6) shows diffuse emission at the center, roughly aligned with the major axis of the galaxy. However, this diffuse emission is not by itself proof of the presence of a hot ISM, since an important contaminant in a galaxy like NGC821, that has a low hot gas content (Sect. 1), is the undetected portion of the LMXB population (see for example the case of NGC1316, Kim & Fabbiano 2003); another contaminant could be the emission of normal stars (first discussed for this type of galaxies in Pellegrini & Fabbiano 1994).
In this Section we report the results of the analysis of this diffuse emission. First, we analyze the merged data to estimate its spatial and spectral properties (Sections 5.1 and 5.2). Since our deep data allow for an accurate characterization of the LMXB population (Section 3), we then use these results to estimate how much of the diffuse emission could come from unresolved LMXBs below the detection threshold, comparing: (1) the shape of the radial profiles observed for the diffuse emission, the resolved point sources and the stellar optical light (Sect. 5.3); (2) the radial profile of the soft emission contributed by LMXBs and the total observed soft profile (Sect. 5.4); (3) the total luminosity of the diffuse emission with that expected from unresolved LMXBs, using the XLF derived in Sect. 3.2 (Sect. 5.5). Finally, in Sect. 5.6, we derive the expected contribution from other types of stellar sources.
5.1 Radial profile
After having excluded all the detected sources, we derived a radial profile of all the remaining counts, in the 0.3–6 keV energy band; at energies keV the background contribution becomes dominant and the addition of these photons would only increase the errorbars. The profile was centered on the nucleus, and included 30 circular annuli (each wide). The resulting radial profile is shown in Figure 11, where the presence of emission is evident as far as from the nucleus ( kpc at the galaxy distance). The flattening at larger radii is consistent with the expected background level. Therefore, diffuse emission is detected out to a radius that lies well within the optical extent of the galaxy, even within one effective radius (Tab. 1).
5.2 Spectral analysis of the diffuse emission
We analyzed the spectra of three circles centered on the galactic center, of progressively larger radius: and , to investigate the gas presence in the circumnuclear region, and , that is the outermost radius at which diffuse emission is detected. Prior to their extraction, we removed regions including detected sources. The background was estimated from a source-free circular area of radius, located outside the galaxy. We fitted the spectra with single component models, such as a power law (XSPEC model ) as expected from the integrated LMXB emission, and a thermal APEC model (XSPEC model wabs*apec), to account for the emission of a hot gas component; we then used a composite power-law and APEC model (wabs(apec+pow)). The results are summarized in Tab. 6; errors quoted below give the 68% confidence interval for one interesting parameter.
The spectrum of a central circle of radius is well fitted by a single absorbed power law model, with a photon index and consistent with the Galactic value, which is in good agreement with the spectral parameters of LMXBs (Sect. 3.1). The thermal model also gives an acceptable fit, provided that the temperature is high ( keV at the best fit), which again is what is expected for LMXBs (Fabbiano 2006). Next we attempted the wabs(apec+pow) spectral model, to probe for the presence of a hot gas component, in addition to the LMXB emission that is clearly dominant. was fixed at the Galactic value and the abundance to the solar value, that is an average for the stellar population in the central galactic region (Proctor et al. 2005). At the best fit, and keV; however, this fit does not represent a statistically significant improvement with respect to the simple power law model, as was established via a ”calibration” of the F-test through simulations, following the prescriptions444The basic steps of the procedure consist of fitting the observed data with the simple (pow) and composite (apec+pow) models, getting the F-statistic for these fits, simulating a large number spectra for the simple best fit pow model with XSPEC, fitting each of the simulated data sets with both the simple and the composite model and recording the F-statistic, getting the distribution of the simulated F-statistic to compute a -value (Protassov et al. 2002) that establishes whether the addition of the thermal spectral component is significant or not. discussed in Protassov et al. (2002; their Sect. 5.2). The analysis of the spectrum of a central circle of 10′′ radius gave similar results (Tab. 6). This spectrum is well described by a power law consistent with the average spectrum of LMXBs ( and Galactic ), and again a thermal component is not statistically required.
We then analyzed the spectrum of the diffuse emission from the whole galaxy (i.e., from within a radius of ). Again, a simple power law model gives an acceptable fit, with . If a thermal component is added, with solar abundance and Galactic , then and keV; however, this thermal component is not required statistically. The 68% confidence upper limit on its luminosity is L(0.3–8 keV) erg s-1. Based on the shallower pointings of 2002, David et al. (2006) estimated a 90% confidence upper limit on L(0.5–2 keV) of erg s-1, for a thermal component.
In the analysis above the presence of a small amount of thermal emission confined to the central region might be overwhelmed by the emission of unresolved LMXBs along the line of sight. Therefore we also attempted the deprojection of the spectral data by using the technique implemented within XSPEC, where the spectra extracted from annuli centered on the nucleus are compared with the spectra expected from the superposition along the line of sight of the emission coming from the corresponding spherical shells [as successfully done for the Sombrero bulge, Pellegrini et al. (2003b)]. The central region was therefore divided in an inner circle of radius, a surrounding annulus with outer radius of 10′′, and another surrounding annulus of outer radius of . The spectra of each of these regions were jointly fitted with the spectral models used above. Unfortunately, the outermost annulus did not have enough counts to add meaningful spectral information, therefore only the two inner regions were deprojected. The simple power law model (projct*wabs*powerlaw), with the photon index constrained to be the same in the two regions, gives an acceptable fit for and cm-2 (inner region) and cm-2 (outer region). The addition of a thermal component [XSPEC model projct*wabs(apec+pow), with solar abundance and Galactic ] gives a best fit , and temperatures of keV for the outer annulus, and keV for the inner circle. The latter value is too small to be meaningful, therefore the fit was repeated with a fixed (typical of LMXBs, Sect. 3.1). The outer temperature remained unchanged and a more meaningful temperature was obtained for the inner circle ( keV), but it was basically unconstrained. Again, the addition of the thermal component was not statistically significant. At the best fit, the luminosity of the thermal component is % and % that of the power law, respectively for the inner and outer regions.
In summary, the analysis of the projected regions and of the central deprojected regions never requires the presence of a soft thermal component at a statistically significant level. The luminosity of a soft thermal component inserted in the fit is much lower than that of the power law ( at the best fit) for the spectra of the , and circles.
5.3 Radial profiles of detected sources, diffuse emission and galactic optical emission
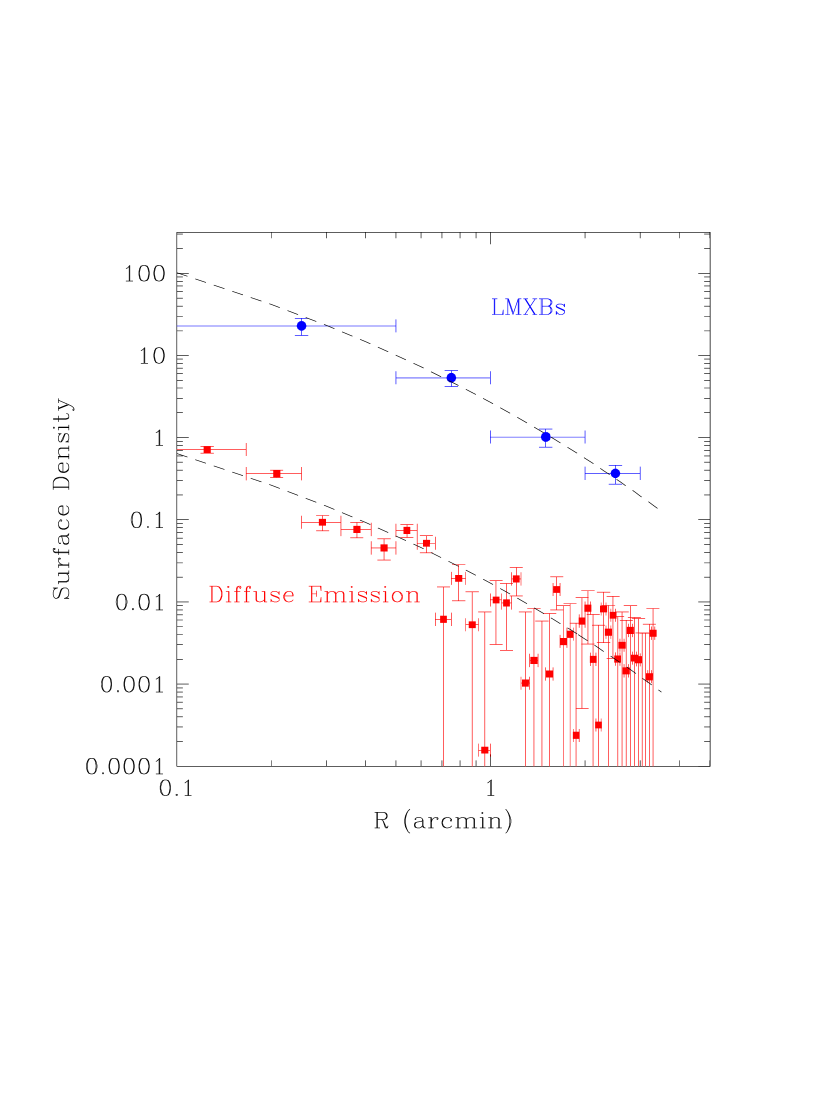
Figure 12 shows the comparison of the radial profiles of three quantities: (1) the background-subtracted diffuse emission in the 0.3–6 keV band, (2) the number density of resolved point sources, (3) the R-band emission of NGC821. The latter, that gives the distribution of the stellar surface brightness, is well described by a de Vaucouleurs (1948) law , where is in arcseconds (Soria et al. 2006b).
All three profiles follow the same radial trend. The agreement between the radial profile of resolved point sources and that of the stellar light is not surprising (see, e.g., Kim & Fabbiano 2003, Fabbiano 2006). The similarity of these profiles with that of the diffuse emission provides instead support to (or at least is consistent with) the idea that also the diffuse emission mostly comes from undetected LMXBs.
5.4 Simulated (LMXB) and observed soft radial profiles
If the diffuse emission is mostly due to unresolved LMXBs, as suggested by the analysis of the previous two Sections 5.2 and 5.3, we would expect its spectrum to have a power-law shape typical of the LMXB population, at all radii. Any deviation is suggestive of a localized additional hot ISM component.
In order to further check the lack of a soft thermal component indicated by the previous analysis at all radii, we made the following test. We derived from observations the radial profile of the diffuse hard emission in the 1.5–6 keV band; in the hypothesis that it is produced by a distributed source whose spectrum is a power law of and Galactic , we then used it to derive a ”simulated” radial profile in the 0.3–1.5 keV band. The chosen spectrum represents the emission of unresolved LMXBs, in accordance with the results of Sects. 3.1. In Figure 13 we compare the simulated soft profile with the observed profile of the diffuse emission in the same energy band. The agreement between the two profiles is good, consistent with the idea that the observed soft emission is due substantially to unresolved binaries. Only within the central circle of radius an additional contribution from a soft source could be present, but is not revealed by the spectral analysis (Sect. 5.2).
5.5 The unresolved emission implied by the XLF
The emission from undetected LMXBs can be recovered from the XLF derived in Sect. 3.2 specifically for NGC821, as the difference between the total luminosity expected from LMXBs based on the XLF, (total), and the luminosity due to all detected sources, (detected). In the 0.3–8 keV band, (detected) erg s-1 for the sources falling within the D25 ellipse. For the same region, (total) is not just given by an integration of the XLF, since the XLF was derived for the D25 ellipse with a central circle of radius excluded (Sect. 3.2). (total) for the whole D25 ellipse is then obtained rescaling the luminosity resulting555This integration assumes that the differential XLF has the same slope () down to erg s-1, and is done over the range erg s-1. Given the slope value, sources of luminosities below erg s-1 do not contribute significantly to the result; for example, decreasing the lower boundary by a factor of two would increase the resulting total luminosity by %. In addition, a low luminosity break in the XLF is also expected (e.g., Kim et al. 2006). from the XLF by the ratio between the luminosity of detected sources in the two regions (i.e., the D25 ellipse and this ellipse without the central circle). This procedure relies on the assumptions that (1) the XLF for and is the same, and (2) (total)/(detected) is also the same in these two regions. While (1) is reasonable, (2) is less valid, since more sources would be hidden in the inner region. Therefore, both (total) and (undetected)=(total) – (detected) are actually lower limits. For the D25 ellipse, (total) is erg s-1, and (undetected) erg s-1.
It is interesting now to compare the unresolved LMXBs emission with the luminosity of the diffuse emission derived from the spectrum of a central circle of radius (i.e., 1.4 erg s-1, Sect. 5.2). Therefore we repeated the procedure above to calculate (undetected) for this circle, and it turned out that (undetected)= erg s-1. This value is slightly lower than the spectral luminosity of the diffuse emission; however, as noted above, it is likely an underestimate of the true value. Also, considering the uncertainty in the normalization of the XLF (, Sect. 3.2), (undetected) can be as large as erg s-1.
In summary, for the same circle of , the spectral luminosity of the diffuse emission and the XLF-based unresolved luminosity are close, and they agree within the uncertainties.
5.6 Other stellar sources
Since we are constraining the origin of the diffuse emission in NGC821 better than it has been possible so far in previous analyses of low ellipticals, we check also for the amount of diffuse emission that can be accounted for by stellar sources other than LMXBs. In the old stellar population of an elliptical galaxy these include coronae of late type main sequence stars, RS Canum Venaticorum (RS CVn) systems and supersoft X-ray sources (Pellegrini & Fabbiano 1994). The latter are characterized by black body emission with effective temperatures of 15–80 eV, X-ray luminosities up to few erg s-1 and are more frequent in late type and irregular galaxies (Kahabka & van den Heuvel 1997; Di Stefano & Kong 2004). NGC4697 is the only elliptical where they have been identified so far (Sarazin et al. 2001). In the X-ray color-color plot of NGC821 (Fig. 2), supersoft sources would fall in the upper right corner, and there is no such source with counts; one or two sources with less than 30 counts have a high C32 color, but with a large error. The contribution of supersoft sources will not be considered further here.
Stellar coronae of main sequence stars are all sources of thermal X-ray emission ( erg s-1) indicative of coronal plasmas at temperatures of K (e.g., Schmitt et al. 1990). These luminosities are faint in comparison to accretion powered stellar sources, but main sequence stars of spectral types G, K and M are present in a very large number (hereafter respectively , and ). These can be recovered from the initial stellar mass function (IMF) (Salpeter 1955), where the scale-factor , with in , for a 12 Gyrs old stellar population with a 0.5 solar metallicity (Maraston 2005), as suitable for NGC821 (Proctor et al. 2005). Then , where and are respectively 0.7 and the main sequence turn-off mass of 0.9 (as appropriate for NGC821, Maraston 2005) for G stars; 0.5 and 0.7 for K stars; and 0.1 and 0.5 for M stars. Integration gives , and , therefore the collective M dwarf X-ray emission is by far the most important, because the average X-ray luminosity of a G, K and M star (hereafter ) are comparable (Kuntz & Snowden 2001). Taking erg s-1 in the 0.3–8 keV band666The sign comes from assuming thermal emission of keV when converting in the band (Kuntz & Snowden 2001) to the 0.3–8 keV band. The proper spectral description consists of two thermal components: one with K and the other with K; the latter usually has larger (and often much larger) emission measure (Giampapa et al. 1996)., the collective M dwarfs emission in NGC821 is then erg s-1. From a central circle of radius, for the de Vaucouleurs optical profile of Sect. 5.3, the M dwarfs emission is erg s-1, that is % of the luminosity derived from the spectrum of the diffuse emission from the same region (Sect. 5.2). However, recent claims favor an IMF flatter than the Salpeter one at the low mass end, as for the Kroupa (2001) IMF, which is for . In this case the scale-factor (Maraston 2005), the integration gives , and the collective M dwarfs emission becomes erg s-1 for the whole galaxy, and erg s-1 for a circle of radius. Therefore, it can account for % of the luminosity of the diffuse emission.
RS CVn systems are chromospherically active objects, consisting of a G or K giant or subgiant, with a late type main sequence or subgiant companion (Linsky 1984). They are the most X-ray luminous late type stars ( erg s-1), and their spectra can be well modeled by a thermal plasma with two temperatures (of average keV and keV, Dempsey et al. 1997). From Dempsey et al.’s Fig. 3, the average 0.3–8 keV luminosity of a system is777Again the sign comes from assuming that most of the emission is due to the higher temperature component. erg s-1. The number of RS CVn systems is a fraction of the number of giants and subgiants (respectively and ) expected to be present in NGC821, which is888 and are the product of the time spent by stars in such evolutionary phases by the specific evolutionary flux for a 12 Gyr old stellar population (which is fairly independent of the IMF; Maraston 2005) and by . Low mass metal rich stars spend yrs in the G/K-subgiant phase, and Gyr on the red giant branch (e.g., Renzini 1989). . Taking half this number for those giants or subgiants that are also in binary systems, and another factor () for those that become RS CVn, then the collective contribution is erg s erg s-1. This is erg s-1 for the whole galaxy, and erg s-1 from a circle of radius, that is % of the total diffuse emission within the same region. A somewhat higher percentage (%) is derived in the 2–10 keV band when adopting the emissivity per unit stellar mass of these sources in the Galactic plane (Sazonov et al. 2006), and assuming an average stellar mass-to-light ratio in the B-band of (Sect. 6.1). This higher percentage could be in part the result of a higher emissivity in the Milky Way, due to younger stellar ages than estimated for NGC821 (see above).
In conclusion, the collective emission of stellar sources other than LMXBs from the whole galaxy is erg s-1; as expected, this is much smaller than the collective LMXB’s emission (7.6 erg s-1, Sect. 5.5), but it is even smaller than its unresolved fraction [i.e., (undetected)= erg s-1, Sect. 5.5]. Also, these sources can contribute up to % of the diffuse emission detected within a radius of (Sect. 5.2).
5.7 Conclusions on hot gas presence
All the different lines of investigation undertaken in this Section consistently indicate a largely dominating LMXB contribution to the diffuse X-ray emission. Its spectrum does not require soft thermal emission, that is limited to erg s-1 (% of the total diffuse luminosity) at 68% confidence. The observed radial profiles of the stellar light, the resolved point sources and the diffuse emission agree within the errors, suggesting that the diffuse emission has a stellar origin. The observed radial profile in the soft band is consistent with that expected from the sources (the LMXB population) producing the hard emission, except perhaps for the innermost () region. Finally, the luminosity of undetected sources derived from the bias-corrected XLF agrees with the spectral luminosity of the diffuse emission, within the uncertainties. A fraction of the diffuse emission (%) can also come from stellar sources other than LMXBs.
6 Discussion
In the previous Sections we have reported the results of the analysis of a deep pointing (for a total exposure of nearly 230 ks) aimed at detecting the nuclear emission and setting stringent constraints on the presence of hot gas both on the circumnuclear and the galactic scale. The deep image revealed a significant portion of the LMXB population, for which the X-ray Luminosity Function was derived. This, together with a spectral and imaging analysis of the diffuse emission, severely constrained the presence of a hot ISM (Sect. 5). At the galactic center, in addition to diffuse emission (which we can explain as predominantly due to unresolved LMXBs), we find four sources of erg s-1. We have been able to establish that one of these sources (S2) is coincident with the galactic center. Three of these source, including S2, are extended, with one of them as long as (S1; Fig. 7). These sources could be truly extended, or made of one or more point-like components, possibly also embedded in truly diffuse emission. Their spectral shape is consistent with that of LMXBs, but in NGC821 there are only 2 other sources as bright as these, outside the central circle of radius (Fig. 4). This supports the idea that more than one LMXB is contributing to the emission of each source. An alternative possibility is that they belong to a continuous complex feature, made of LMXBs (that may also lie there due to a projection effect), a nucleus (possibly with associated extended emission) and an outflow/jet. S1, in particular, has a linear structure suggestive of a jet (Fig. 7). Our VLA observations (Sect. 1) help better address these possibilities, and are presented in the companion paper (Pellegrini et al. 2007), together with a discussion on whether/how accretion proceeds in this nucleus, based on all the available observational evidence. We estimated here a upper limit to the 0.3–8 keV emission of a point-like source associated with the MBH of , which makes this one of the quietest MBH studied with (e.g., Pellegrini 2005b), with .
In the following we discuss the possibility that there may be undetected hot gas in NGC 821 (Sect. 6.1). Hidden hot gas on the nuclear scale could be a source of fuel for the MBH; furthermore, we check whether the lack of detection on the galactic scale agrees with expectations for the evolution of the ISM in this elliptical.
6.1 Is there hot undetected gas?
The present analysis does not detect hot gas available for accretion at the nucleus; coupled with the absence of interstellar medium observed at other wavelenghts (Sect. 1), the lack of fuel for the MBH could be the simplest explanation for the very low levels to which the nuclear emission has been constrained. However, an aging stellar population continuously returns gas to the ISM, via stellar mass losses (e.g., Ciotti et al. 1991, David et al. 1991); as a mimimum, the circumnuclear region should be replenished with this fuel. Below we discuss the possible presence of this ISM.
The lack of detection of hot gas on the galactic scale can be expected from simple energetic considerations, comparing the energy made available per unit time by type Ia supernova explosions () with the energy required to steadily extract from the galactic potential well the stellar mass losses produced per unit time (; Ciotti et al. 1991), for the whole galaxy lifetime. comes directly from the observed SNIa’s explosion rate in ellipticals (Cappellaro et al. 1999) rescaled for in Tab. 1; this rate was higher in the past (e.g., Greggio 2005). derives from the stellar mass loss rate and the galactic mass profile, that can be well modelled by the superposition of two Hernquist (1990) density profiles999This model gives a very good approximation of the de Vaucouleurs (1948) law, that fits the light profile of NGC821 (Sect. 5.3). The radial distribution of the dark haloes of ellipticals is not well constrained by the observations. Theoretical arguments favor a peaked profile (Ciotti & Pellegrini 1992; Evans & Collett 1997). High resolution numerical simulations (Navarro, Frenk, & White 1996) produce a central density distribution equal to that of the Hernquist model., one for the stars with total mass , and one for the dark matter with mass . This model is then tailored onto NGC821 taking the observed , , central stellar velocity dispersion (Tab. 1) and ratio. Anisotropic Jeans models reproducing the observed velocity dispersion profiles of stars and planetary nebulae out to 5 constrain the range of to be 13–17 (Romanowsky et al. 2003). For a plausible stellar mass-to-light ratio (Gerhard et al. 2001, Napolitano et al. 2005) one derives . Finally, the stellar mass loss rate is distributed as the stars, and derives by summing the mass ejected by each star as a function of its mass (Renzini & Ciotti 1993) for a Kroupa IMF, scaled for NGC821 as described in Sect. 5.6; this produces a total mass loss rate of 0.25 yr-1 after 12 Gyrs, in good agreement with the values estimated for ellipticals from observations (Athey et al. 2002). The resulting during the galaxy lifetime, with at present; therefore type-Ia SNe have always provided the heating to drive the stellar mass losses in a galactic wind (neglecting the effect of radiative cooling that is not expected to be important for very low gas densities typical of a wind).
However, this is a global energetic calculation, and the galaxy may host regions with and regions with . For centrally peaked mass distributions like those described above, numerical simulations of hot gas evolution showed that this is indeed the most frequent case (Pellegrini & Ciotti 1998): the ISM is driven out of the outer galactic regions in a wind, while it is inflowing within a stagnation radius that can be largely different from galaxy to galaxy. To explore whether this situation applies to NGC 821, we ran hydrodynamical simulations specific for the galaxy model described above, plus the additional gravitational attraction contributed by its central MBH (see Pellegrini & Ciotti 2006 for more details on the numerical code and the time-evolving input quantities). The central grid spacing was set to 5 pc to allow for a better sampling of the inner regions and the gas flow evolution was followed for Gyrs, an age comparable with the stellar age of NGC 821 (Proctor et al. 2005). The flow kept in a partial wind all the time, and at the end its total few erg s-1 in the 0.3–8 keV band, well below our observational limit on the hot gas. The bulk of the hot gas was outflowing, and directed towards the center from within a radius of pc. At the smallest radius at which the flow is well resolved (10 pc) the mass inflow rate is fewyr-1; the gas density is cm-3, one third of the density value calculated from the emission measure of the ”best fit” thermal component for the central circle, in the deprojected analysis of the diffuse emission (this component is not statistically required, Sect. 5.2). Note however that the inflowing region is very small and fully included within the extent of the S2 source (Sect. 4.1). By varying the ratio, the SNIa’s rate, the age of the galaxy and the stellar mass loss rate within the limits imposed by observational uncertainties, the value of keeps within the range yr-1. The implications for the nuclear emission coming from this estimate of are discussed in Pellegrini et al. (2007). Here we just note that ranges from to few yr-1 in the past Gyrs, and its integration over this time gives a total mass accreted at the center of , that is of the observed MBH mass (Tab. 1). Therefore, accretion of stellar mass losses was not effective in building this MBH mass.
Finally, we comment on the fact that, by using observations, the mass accretion rate of galactic nuclei is customarily estimated from the analytic formula of Bondi (1952), valid for spherically symmetric accretion from a nonrotating polytropic gas with given density and temperature at infinity (e.g., Loewenstein et al. 2001, Soria et al. 2006a). Infinity is replaced with an accretion radius (Frank et al. 2002), where the sound speed is calculated as close as possible to the MBH. Even in those cases where can be observed close to the galactic center, so that one can be confident to derive an approximate estimate of , there are additional ingredients that must be considered in the estimate of the mass accretion rate, which were not included in the Bondi (1952) treatment: 1) the presence of mass and energy sources (i.e., stellar mass losses and SNIa’s heating); 2) the presence of cooling; 3) the fact that is not a true ”infinity” point, since the gas here experiences a pressure gradient. The simulations described here take into account all these aspects, and should give a more reliable mass accretion rate than the Bondi theory. However, they have some limits too. At these very low values, and very small inflowing regions, the detailed shape of the galactic mass profile becomes important. In the case of NGC821, the observed profile is steeper than modelled here at the very center (Gebhardt et al. 2003), which should produce a larger . The true accretion rate could be somewhat higher than also if even the stellar mass losses within the innermost radius resolved by the simulations are to be accreted. But further pursuing the flow behavior closer to the MBH with the simulations used here runs into a problem: the discrete nature of the stellar distribution becomes important, since the accretion time ( yrs from 10 pc, in the simulations) becomes comparable to (or lower than) the time required for the stellar mass losses to mix with the bulk flow (Mathews 1990), and the time elapsing between one SNIa event and the next.
7 Summary
We have observed the nearby, inactive elliptical galaxy NGC821, known to host a central MBH, with deep pointings, in order to put strong constraints on its nuclear emission and the presence of gas available for accretion. Our results can be summarized as follows:
-
1.
We detect 41 sources within the optical size (D25) of the galaxy; excluding 4 particular sources at the center, these represent the LMXB population of NGC 821. Their X-ray colors, and the spectral analysis of the three brightest ones, are consistent with spectral shapes described by power laws of photon index in the range , without significant intrinsic absorption. There is no clear evidence for supersoft sources.
-
2.
In the overlap region between D25 and the field of view of previously taken WFPC2 images, there are six clear associations of LMXBs with globular clusters, plus two additional marginal matches. These LMXBs reside in the brightest GCs of the galaxy. Excluding the two marginal matches, % of the X-ray sources lie in GCs, and % of the GCs have a LMXB, broadly in agreement with the percentages found for ellipticals in previous works.
-
3.
The XLF of these sources is well fitted by a simple power law down to erg s-1 (or to erg s-1 after completeness correction), with a slope () similar to that found previously for other ellipticals. The ratio between the total due to LMXBs and the galactic is lower than the average found for early-type galaxies, but still within the observed scatter.
-
4.
At the position of the galactic center a source (S2) is detected for the first time. Its spectral shape is quite hard (), without intrinsic absorption. S2 is however slightly extended, and a 0.3–8 keV upper limit of erg s-1 is derived for a point-like nuclear source, one of the smallest established with .
-
5.
Three other sources, with a spectral shape typical of LMXBs, are detected in the central galactic region; they are as bright as the brightest sources in the XLF. Only one (S3) is consistent with being pointlike; the other two (S1 and S4) are extended, and could be due to the superposition of few LMXBs and/or truly diffuse emission. The morphology of S1 resembles a jet-like feature.
-
6.
Diffuse emission is detected out to a radius of . A few independent lines of investigation, exploiting the spectral and imaging capabilities of , consistently indicate that this diffuse emission is due to unresolved LMXBs, and provide no evidence for hot gas, either close to the center or on a larger scale. The spectral analysis gives a () limit of L(0.3–8 keV) erg s-1 on any soft thermal component within a radius of .
-
7.
Other unresolved stellar sources (mostly M dwarfs and RS CVn systems) could contribute to the diffuse emission by %. The general scaling of their collective with the galactic was also derived.
-
8.
Numerical simulations of the hot gas evolution for a galaxy model tailored on NGC 821 show that the bulk of the gas is driven out in a wind for the whole galaxy lifetime, due to the heating provided by type Ia supernovae. While this may have been expected based on simple energetic calculations, the simulations also show that the gas is accreting towards the center from within a very small inner region. This gas flow pattern is expected to be common in low ellipticals, due to their cuspy central mass distribution. Gaseous accretion alone at the rates given by the simulations cannot have formed the nuclear MBH of NGC821.
In a companion paper (Pellegrini et al. 2007), we present further observational results for the central region of NGC 821, obtained with and the VLA, and discuss various possibilities for the nature of the accretion process in this very low luminosity nucleus.
References
- (1) Anders, E., Grevesse, N. 1989, Geochim. Cosmochim. Acta 53, 197
- (2) Athey, A., Bregman, J., Bregman, J., Temi, P., Sauvage, M. 2002, ApJ 571, 272
- (3) Bender, R., Saglia, R. P., Gerhard, O. E. 1994, MNRAS 269, 785
- (4) Bondi, H. 1952, MNRAS, 112, 195
- (5) Burstein, D., Heiles, C. 1982, AJ 87, 1165
- (6) Cappellaro, E., Evans, R., Turatto, M. 1999, A&A 351, 459
- (7) Ciotti L., D’Ercole A., Pellegrini S., Renzini A. 1991, ApJ 376, 380
- (8) Ciotti, L., Pellegrini, S. 1992, MNRAS 255, 561
- (9) Ciotti, L., & Ostriker, J.P. 2001, ApJ, 551, 131
- (10) Cutri, R. M., Skrutskie, M. F., van Dyk, S., et al. 2003, The IRSA 2MASS All-Sky Point Source Catalog, NASA/IPAC Infrared Science Archive. http://irsa.ipac.caltech.edu/applications/Gator/
- (11) David, L.P., Forman, W., Jones, C. 1991, ApJ 369, 121
- (12) David, L.P., Jones, C., Forman, W., Vargas, I.M., Nulsen, P. 2006, ApJ 653, 207
- (13) Dempsey, R.C., Linsky, J.L., Fleming, T.A., Schmitt, J.H.M.M., 1997, ApJ, 478, 358
- (14) de Vaucouleurs G., 1948, Ann.Ap., 11, 247
- (15) de Vaucouleurs G., de Vaucouleurs A., Corwin Jr. H.G., Buta R.J., Paturel G., Fouque P., 1991, Third Reference Catalogue of Bright Galaxies, (New York: Springer Verlag) (RC3)
- (16) Dickey, J. M., Lockman, F. J. 1990, ARA&A 28, 215
- (17) Di Matteo, T., Allen, S.W., Fabian, A.C., Wilson, A.S., & Young, A.J. 2003, ApJ, 582, 133
- (18) Di Stefano, R., Kong, A. 2004, ApJ 609, 710
- (19) Eddington, A.S. 1913, MNRAS 73, 359
- (20) Evans, N. W., Collett, J. L. 1997, ApJ 480, L103
- (21) Fabbiano, G., Elvis, M., Markoff, S., Siemiginowska, A., Pellegrini, S., Zezas, A., Nicastro, F., Trinchieri, G., & McDowell, J. 2003, ApJ 588, 175
- (22) Fabbiano, G., Baldi, A., Pellegrini, S., Siemiginowska, A., Elvis, M., Zezas, A., & McDowell, J. 2004, ApJ, 616, 730 (F04)
- (23) Fabbiano, G. 2006, ARA&A 44, 323
- (24) Fabian, A.C., & Canizares, C.R. 1988, Nature, 333, 829
- (25) Ferrarese, L., Ford, H. 2005, Space Science Reviews 116, 523
- (26) Frank, J., King, A., & Raine, D. 2002, Accretion Power in Astrophysics, Cambridge: CUP
- (27) Gebhardt, K., Richstone, D., Tremaine, S., et al. 2003, ApJ, 583, 92
- (28) Gerhard O., Kronawitter, A., Saglia, R. P., Bender, R. 2001, AJ 121, 1936
- (29) Giampapa, M. S., Rosner, R., Kashyap, V., Fleming, T. A., Schmitt, J. H. M. M., Bookbinder, J. A. 1996, ApJ 463, 707
- (30) Gilfanov, M. 2004, MNRAS 349, 146
- (31) Greggio, L., 2005, A&A 441, 1055
- (32) Hernquist L.E., 1990, ApJ, 536, 359
- (33) Ho, L.C. 2005, Ap&SS 300, 219
- (34) Irwin, J., Athey, A., Bregman, J. 2003, ApJ 587, 356
- (35) Kahabka, P., van den Heuvel, E. 1997, ARA&A 35, 69
- (36) Kim D.W., Fabbiano G., Trinchieri G. 1992, ApJ 393, 134
- (37) Kim, D.W., & Fabbiano, G. 2003, ApJ, 586, 826
- (38) Kim, D.W., & Fabbiano, G. 2004, ApJ, 611, 846
- (39) Kim, D.W., Wilkes, B., Green, P., et al. 2004, ApJ, 600, 59
- (40) Kim, D.W., Fabbiano, G., Kalogera, V., et al. 2006, ApJ 652, 1090
- (41) Kim, M., Wilkes, B.J., Kim, D.W., Green, P.J., Barkhouse, W.A., Lee, M.G., Silverman, J.D., Tananbaum, H.D. 2007, ApJ 659, 29
- (42) Kim, E., Kim, D.W., Fabbiano, G., Lee, M.G., Park, H.S., Geisler, D., Dirsch, B. 2006, ApJ 647, 276
- (43) Kroupa, P. 2001, MNRAS 322, 231
- (44) Kundu, A., Whitmore, B.C. 2001, AJ 121, 2950
- (45) Kundu, A., Maccarone, T.J., Zepf, S.E. 2007, in press on ApJ (astro-ph/0703092)
- (46) Kuntz, K.D., Snowden, S.L. 2001, ApJ 554, 684
- (47) Lauer T.R., et al. 2005, AJ 129, 2138
- (48) Linsky, J.L., 1984. In Cool Stars, Stellar Systems and the Sun, eds. S.L. Baliunas and L. Hartmann (Berlin: Springer Verlag), p.244
- (49) Loewenstein, M., Mushotzky, R.F., Angelini, L., Arnaud, K.A., & Quataert, E. 2001, ApJ, 555, L21
- (50) Maraston, C. 2005, MNRAS 362, 799
- (51) Mathews, W. 1990, ApJ 354, 468
- (52) Monet, D. G., Levine, S.E., Canzian, B., et al. 2003, AJ 125, 984
- (53) Napolitano, N. R., Capaccioli, M., Romanowsky, A. J., et al. 2005, MNRAS 357, 691
- (54) Navarro, J.F., Frenk, C.S., White, S.D. M. 1996, ApJ 462, 563
- (55) Omma, H., Binney, J., Bryan, G., & Slyz, A. 2004, MNRAS, 348, 1105
- (56) O’Sullivan, E., Forbes, D.A., Ponman, T.J. 2001, MNRAS 328, 461
- (57) Park, T., Kashyap, V.L., Siemiginowska, A., van Dyk, D.A., Zezas, A., Heinke, C., Wargelin, B.J. 2006, ApJ 652, 610
- (58) Pellegrini S., Fabbiano, G. 1994, ApJ 429, 105
- (59) Pellegrini S., Ciotti L. 1998, A&A 333, 433
- (60) Pellegrini S., Venturi, T., Comastri, A., Fabbiano, G., Fiore, F., Vignali, C., Morganti, R., Trinchieri, G. 2003a, ApJ 585, 677
- (61) Pellegrini S., Baldi, A., Fabbiano, G., Kim, D.W. 2003b, ApJ 597, 175
- (62) Pellegrini, S. 2005a, ApJ, 624, 155
- (63) Pellegrini, S. 2005b, MNRAS 364, 169
- (64) Pellegrini, S., Ciotti, L. 2006, MNRAS 370, 1797
- (65) Pellegrini, S., Siemiginowska, A., Fabbiano, G., Elvis, M., Greenhill, L., Soria, R., Baldi, A., Kim, D.W. 2007, in press on ApJ
- (66) Pinkney, J., Gebhardt, K., Bender, R., et al. 2003, ApJ 596, 903
- (67) Proctor, R. N., Forbes, D. A., Forestell, A., Gebhardt, K. 2005, MNRAS 362, 857
- (68) Protassov, R., van Dyk, d.A., Connors, A., Kashyap, V.L., Siemiginowska, A. 2002, ApJ 571, 545
- (69) Rees, M. 1984, ARA&A 22, 471
- (70) Renzini, A., 1989. In Evolutionary Phenomena in Galaxies, ed. J. Beckman, and B. Pagel (Cambridge University Press), p. 422
- (71) Renzini, A., Ciotti, L. 1993, ApJ 416, L49
- (72) Romanowsky, A. J., Douglas, N. G., Arnaboldi, M., et al. 2003, Science 301, 1696
- (73) Salpeter, E.E. 1955, ApJ 121, 161
- (74) Sansom A.E., O’Sullivan E., Forbes D., Proctor R.N., Davis D.S. 2006, MNRAS 370, 1541
- (75) Sarazin, C., Irwin, J., Bregman, J. 2001, ApJ 556, 533
- (76) Sarazin, C., Kundu, A., Irwin, J., Sivakoff, G.R., Blanton, E., Randall, S.W. 2003, ApJ 595, 743
- (77) Sarzi, M., Falcon-Barroso, J., Davies, R.L., et al. 2006, MNRAS 366, 1151
- (78) Sazonov, S., Revnivtsev, M., Gilfanov, M., Churazov, E., Sunyaev, R. 2006, A&A 117, 128
- (79) Schmitt, J., Collura, A., Sciortino, S., Vaiana, G., Harnden, F.R., Rosner, R. 1990, ApJ 365, 704
- (80) Siemiginowska, A., Smith, R. K., Aldcroft, T. L., Schwartz, D. A., Paerels, F., Petric, A.O. 2003, ApJ 598, L15
- (81) Skrutskie, M.F., Cutri, R.M., Stiening, R. et al. 2006, AJ 131, 1163
- (82) Smith, R.M., Martinez, V.J., Graham, M. J. 2004, ApJ 617, 1017
- (83) Soria, R., Fabbiano, G., Graham, A., Baldi, A., Elvis, M., Jerjen, H., Pellegrini, S., Siemiginowska, A. 2006a, ApJ 640, 126
- (84) Soria, R., Graham, A., Fabbiano, G., Baldi, A., Elvis, M., Jerjen, H., Pellegrini, S., Siemiginowska, A. 2006b, ApJ 640, 143
- (85) Springel, V., Di Matteo, T., Hernquist, L. 2005, ApJ 620, L79
- (86) Tonry, J.L., Dressler, A., Blakeslee, J.P., et al. 2001, ApJ, 546, 681
- (87) Vikhlinin, A., Schulz, N., Tibbetts, K., Edgar, R. 2003, Corrections for Time Dependence of ACIS Gain, http://cxc.harvard.edu/contrib/alexey/tgain/tgain. html
- (88) Weisskopf, M., Tananbaum, H., Van Speybroeck, L., & O’Dell, S. 2000, Proc. SPIE, 4012, 2
- (89) Zezas, A., Fabbiano, G. 2002, ApJ 577, 726
| TypeaaType, and size from de Vaucouleurs et al. (1991; RC3). The size gives the major and minor axis of the D25 ellipse, that is the 25.0 B-mag/square arcsec isophote. The position angle is (RC3). | BaaType, and size from de Vaucouleurs et al. (1991; RC3). The size gives the major and minor axis of the D25 ellipse, that is the 25.0 B-mag/square arcsec isophote. The position angle is (RC3). | DbbDistance D from Tonry et al. (2001). | log | SizeaaType, and size from de Vaucouleurs et al. (1991; RC3). The size gives the major and minor axis of the D25 ellipse, that is the 25.0 B-mag/square arcsec isophote. The position angle is (RC3). | ReccEffective radius Re in the R-band (from Soria et al. 2006b; see also Sect. 5.3). | ddEffective stellar velocity dispersion (averaged over ) from Pinkney et al. (2003). | NHeeGalactic hydrogen column density (Dickey & Lockman 1990). | ffGebhardt et al. (2003) report a value of 3.7, later revised to the value given here (Richstone et al., astro-ph/0403257) that is considered more reliable (Gebhardt, K. 2006, private communication). | 1′′ |
|---|---|---|---|---|---|---|---|---|---|
| (mag) | (Mpc) | () | (arcmin) | (′′,kpc) | (km s-1) | (cm-2) | () | (pc) | |
| E6 | 11.72 | 24.1 | 10.27 | 2.57x1.62 | 43.9, 5.1 | 209 | 6.2 | 8.5 | 117 |
| Obs ID | Date | Exposure (ks) |
|---|---|---|
| 4408 | 2002, Nov 26 | 25.3 |
| 4006 | 2002, Dec 01 | 13.7 |
| 5692 | 2004, Dec 04 | 28.0 |
| 6314 | 2005, Jun 20 | 40.1 |
| 6310 | 2005, Jun 21 | 32.4 |
| 6313 | 2005, Jun 22 | 50.1 |
| 5691 | 2005, Jun 23 | 40.1 |
| CXOU Name | RA | DEC | R | cnt | err | HR | err | C21 | err | C32 | err | |||
|---|---|---|---|---|---|---|---|---|---|---|---|---|---|---|
| (1) | (2) | (3) | (4) | (5) | (6) | (7) | (8) | (9) | (10) | (11) | (12) | (13) | (14) | (15) |
| J020821.4105946aaThe position of this source is coincident with that of a candidate globular cluster found in the /WFPC2 images, see Sect. 3.1; the offset between the optical and X-ray position is always well within , except for the first of these 8 sources (J020821.4105946) that has an offset of 1.24. | 2 8 21.4 | 10 59 46.5 | 0.40 | 6.24 | 20.6 | 6.1 | 8.0 | 0.56 | 0.52 | (0.74 0.27) | 0.19 | (0.13 0.52) | 0.29 | (0.09 0.75) |
| J020820.7105937bbThis is a field LMXB candidate (see Sect. 3.1). | 2 8 20.7 | 10 59 37.7 | 0.40 | 6.75 | 29.2 | 8.5 | 11.3 | 0.79 | 1.00 | (1.00 0.68) | 0.24 | (0.00 0.46) | 0.52 | ( 0.07 1.34) |
| J020821.2105948bbThis is a field LMXB candidate (see Sect. 3.1). | 2 8 21.2 | 10 59 48.4 | 0.39 | 6.95 | 21.0 | 6.1 | 8.1 | 0.56 | 0.52 | (0.74 0.27) | 0.43 | (0.99 0.04) | 0.39 | (0.07 0.77) |
| J020821.6105941bbThis is a field LMXB candidate (see Sect. 3.1). | 2 8 21.6 | 10 59 41.5 | 0.21 | 7.16 | 77.2 | 10.5 | 29.9 | 2.08 | 0.53 | (0.63 0.43) | 0.19 | (0.36 0.11) | 0.58 | (0.46 0.78) |
| J020821.6105945bbThis is a field LMXB candidate (see Sect. 3.1). | 2 8 21.6 | 10 59 45.7 | 0.40 | 8.16 | 20.3 | 6.1 | 7.9 | 0.55 | 0.36 | (0.60 0.10) | 0.51 | (1.24 0.05) | 0.24 | (0.07 0.59) |
| J020821.5105948b,cb,cfootnotemark: | 2 8 21.5 | 10 59 48.7 | 0.15 | 9.44 | 164.9 | 14.3 | 63.9 | 4.44 | 0.59 | (0.64 0.51) | 0.27 | (0.38 0.20) | 0.58 | (0.48 0.67) |
| J020821.6105935aaThe position of this source is coincident with that of a candidate globular cluster found in the /WFPC2 images, see Sect. 3.1; the offset between the optical and X-ray position is always well within , except for the first of these 8 sources (J020821.4105946) that has an offset of 1.24. | 2 8 21.6 | 10 59 35.3 | 0.42 | 9.53 | 20.4 | 7.4 | 7.9 | 0.55 | 0.56 | (0.90 0.24) | 0.53 | (1.44 0.09) | 0.84 | (0.38 1.85) |
| J020822.0105939aaThe position of this source is coincident with that of a candidate globular cluster found in the /WFPC2 images, see Sect. 3.1; the offset between the optical and X-ray position is always well within , except for the first of these 8 sources (J020821.4105946) that has an offset of 1.24. | 2 8 22.0 | 10 59 39.1 | 0.43 | 12.74 | 20.6 | 6.0 | 8.0 | 0.55 | 0.31 | (0.54 0.05) | 0.02 | (0.37 0.30) | 0.34 | (0.01 0.76) |
| J020822.1105940bbThis is a field LMXB candidate (see Sect. 3.1). | 2 8 22.1 | 10 59 40.7 | 0.49 | 14.21 | 15.5 | 5.3 | 6.0 | 0.42 | 0.64 | (0.87 0.36) | 0.62 | (1.30 0.17) | 0.74 | (0.32 1.39) |
| J020821.9105950bbThis is a field LMXB candidate (see Sect. 3.1). | 2 8 21.9 | 10 59 50.2 | 0.36 | 14.51 | 25.3 | 6.6 | 9.8 | 0.68 | 0.79 | (0.96 0.57) | 0.02 | (0.19 0.23) | 0.79 | (0.36 1.58) |
| J020820.7105926aaThe position of this source is coincident with that of a candidate globular cluster found in the /WFPC2 images, see Sect. 3.1; the offset between the optical and X-ray position is always well within , except for the first of these 8 sources (J020821.4105946) that has an offset of 1.24. | 2 8 20.7 | 10 59 26.6 | 0.45 | 16.39 | 23.8 | 7.3 | 9.2 | 0.64 | 1.00 | (1.00 0.94) | 0.46 | (0.99 0.12) | 1.23 | (0.76 2.10) |
| J020822.2105942aaThe position of this source is coincident with that of a candidate globular cluster found in the /WFPC2 images, see Sect. 3.1; the offset between the optical and X-ray position is always well within , except for the first of these 8 sources (J020821.4105946) that has an offset of 1.24. | 2 8 22.2 | 10 59 42.9 | 0.67 | 16.53 | 8.2 | 4.3 | 3.2 | 0.22 | 1.00 | (1.00 0.90) | 0.16 | (0.65 0.25) | 1.18 | (0.60 2.12) |
| J020822.0105952bbThis is a field LMXB candidate (see Sect. 3.1). | 2 8 22.0 | 10 59 52.8 | 0.41 | 17.38 | 19.9 | 5.9 | 7.7 | 0.54 | 0.58 | (0.78 0.34) | 0.22 | (0.61 0.12) | 0.41 | (0.07 0.83) |
| J020820.2105930bbThis is a field LMXB candidate (see Sect. 3.1). | 2 8 20.2 | 10 59 30.1 | 0.35 | 17.60 | 34.1 | 8.6 | 13.2 | 0.92 | 0.35 | (0.51 0.08) | 0.05 | (0.36 0.23) | 0.30 | (0.14 0.72) |
| J020821.9105956 | 2 8 21.9 | 10 59 56.2 | 0.44 | 18.42 | 42.0 | 10.5 | 16.3 | 1.13 | 0.53 | (0.70 0.38) | 0.43 | (0.83 0.14) | 0.54 | (0.31 0.79) |
| J020821.8105926 | 2 8 21.8 | 10 59 26.5 | 0.57 | 18.43 | 10.4 | 6.2 | 4.0 | 0.28 | 0.14 | (0.76 0.45) | 0.26 | (1.43 0.51) | 0.06 | (0.67 0.50) |
| J020819.9105951bbThis is a field LMXB candidate (see Sect. 3.1). | 2 8 19.9 | 10 59 51.3 | 0.48 | 20.05 | 11.7 | 6.1 | 4.5 | 0.31 | 1.00 | (1.00 0.64) | 0.12 | (0.32 0.56) | 0.70 | (0.06 1.93) |
| J020820.2105924bbThis is a field LMXB candidate (see Sect. 3.1). | 2 8 20.2 | 10 59 24.4 | 0.55 | 21.45 | 13.0 | 6.7 | 5.0 | 0.35 | 1.00 | (1.00 0.58) | 0.13 | (0.72 0.33) | 0.50 | (0.01 1.47) |
| J020822.2105922ccA specific spectral analysis has been done for this source (Sect. 3.1 and Tab. 4). | 2 8 22.2 | 10 59 22.4 | 0.15 | 24.76 | 214.2 | 16.1 | 83.0 | 5.76 | 0.45 | (0.51 0.38) | 0.45 | (0.53 0.35) | 0.42 | (0.35 0.50) |
| J020822.8105948 | 2 8 22.8 | 10 59 48.9 | 0.43 | 25.46 | 25.1 | 7.4 | 9.7 | 0.68 | 0.28 | (0.49 0.02) | 0.31 | (0.96 0.10) | 0.15 | (0.07 0.42) |
| J020819.6105957bbThis is a field LMXB candidate (see Sect. 3.1). | 2 8 19.6 | 10 59 57.9 | 0.35 | 27.17 | 26.6 | 7.4 | 10.3 | 0.72 | 0.01 | (0.25 0.21) | 0.85 | (2.11 0.31) | 0.12 | (0.05 0.49) |
| J020820.9105912bbThis is a field LMXB candidate (see Sect. 3.1). | 2 8 20.9 | 10 59 12.9 | 0.58 | 28.80 | 13.7 | 8.1 | 5.3 | 0.37 | 0.36 | (0.77 0.02) | 0.54 | (0.01 1.39) | 0.37 | (1.25 0.26) |
| J020823.1105952ccA specific spectral analysis has been done for this source (Sect. 3.1 and Tab. 4). | 2 8 23.1 | 10 59 52.6 | 0.14 | 31.95 | 301.0 | 18.6 | 116.7 | 8.10 | 0.44 | (0.49 0.39) | 0.27 | (0.35 0.22) | 0.43 | (0.37 0.50) |
| J020820.8105909bbThis is a field LMXB candidate (see Sect. 3.1). | 2 8 20.8 | 10 59 09.9 | 0.51 | 32.01 | 19.2 | 8.6 | 7.4 | 0.52 | 0.70 | (0.86 0.37) | 0.48 | (0.14 0.94) | 0.09 | (0.44 0.77) |
| J020822.9105959 | 2 8 22.9 | 10 59 59.1 | 0.27 | 32.30 | 44.6 | 8.7 | 17.3 | 1.20 | 0.62 | (0.74 0.45) | 0.21 | (0.47 0.03) | 0.55 | (0.37 0.92) |
| J020823.3105950 | 2 8 23.3 | 10 59 50.6 | 0.30 | 33.26 | 43.3 | 8.0 | 16.8 | 1.17 | 0.54 | (0.63 0.35) | 0.03 | (0.16 0.20) | 0.18 | (0.04 0.39) |
| J020819.1110003aaThe position of this source is coincident with that of a candidate globular cluster found in the /WFPC2 images, see Sect. 3.1; the offset between the optical and X-ray position is always well within , except for the first of these 8 sources (J020821.4105946) that has an offset of 1.24. | 2 8 19.1 | 11 00 03.6 | 0.47 | 37.02 | 11.4 | 5.9 | 4.4 | 0.31 | 0.10 | (0.45 0.68) | 0.01 | (1.03 0.87) | 0.35 | (1.14 0.17) |
| J020823.0110008 | 2 8 23.0 | 11 00 08.9 | 0.35 | 39.19 | 30.8 | 7.7 | 11.9 | 0.83 | 0.31 | (0.42 0.02) | 0.95 | (2.23 0.39) | 0.24 | (0.09 0.49) |
| J020822.0105904bbThis is a field LMXB candidate (see Sect. 3.1). | 2 8 22.0 | 10 59 04.6 | 0.44 | 39.42 | 29.0 | 7.5 | 11.2 | 0.78 | 1.00 | (1.00 0.73) | 0.31 | (0.67 0.02) | 0.77 | (0.37 1.55) |
| J020818.7105919bbThis is a field LMXB candidate (see Sect. 3.1). | 2 8 18.7 | 10 59 19.3 | 0.43 | 41.70 | 26.4 | 7.4 | 10.2 | 0.71 | 0.56 | (0.81 0.29) | 0.02 | (0.34 0.27) | 0.52 | (0.13 1.21) |
| J020819.9105900bbThis is a field LMXB candidate (see Sect. 3.1). | 2 8 19.9 | 10 59 00.0 | 0.54 | 45.41 | 17.1 | 6.6 | 6.6 | 0.46 | 0.20 | (0.61 0.21) | 0.57 | (1.67 0.06) | 0.41 | (0.02 1.02) |
| J020820.7105855aaThe position of this source is coincident with that of a candidate globular cluster found in the /WFPC2 images, see Sect. 3.1; the offset between the optical and X-ray position is always well within , except for the first of these 8 sources (J020821.4105946) that has an offset of 1.24. | 2 8 20.7 | 10 58 55.4 | 0.30 | 46.64 | 52.8 | 9.2 | 20.4 | 1.42 | 0.46 | (0.59 0.32) | 0.40 | (0.68 0.16) | 0.57 | (0.37 0.78) |
| J020819.3105900ddThis X-ray source may correspond to a faint background galaxy, from an inspection of the images discussed in Sect. 3.1 (A. Kundu, private communication). | 2 8 19.3 | 10 59 00.2 | 0.53 | 49.23 | 13.6 | 6.1 | 5.3 | 0.37 | 0.66 | (0.20 0.84) | 0.26 | (0.65 1.34) | 0.69 | (1.81 0.14) |
| J020824.1110007 | 2 8 24.1 | 11 00 07.8 | 0.31 | 51.53 | 43.6 | 8.5 | 16.9 | 1.17 | 0.19 | (0.35 0.03) | 0.56 | (1.06 0.22) | 0.26 | (0.13 0.47) |
| J020817.7105907aaThe position of this source is coincident with that of a candidate globular cluster found in the /WFPC2 images, see Sect. 3.1; the offset between the optical and X-ray position is always well within , except for the first of these 8 sources (J020821.4105946) that has an offset of 1.24. | 2 8 17.7 | 10 59 07.7 | 0.28 | 60.28 | 60.9 | 9.6 | 23.6 | 1.64 | 0.72 | (0.82 0.60) | 0.36 | (0.54 0.20) | 0.68 | (0.51 0.93) |
| J020820.2110041ddThis X-ray source may correspond to a faint background galaxy, from an inspection of the images discussed in Sect. 3.1 (A. Kundu, private communication). | 2 8 20.2 | 11 00 41.1 | 0.35 | 61.17 | 24.4 | 7.2 | 9.5 | 0.66 | 1.00 | (0.66 1.00) | 0.30 | (1.39 0.36) | 0.49 | (0.95 0.15) |
| J020822.5110044 | 2 8 22.5 | 11 00 44.1 | 0.48 | 65.73 | 15.0 | 6.4 | 5.8 | 0.41 | 0.24 | (0.29 0.72) | 0.73 | (2.06 0.09) | 0.11 | (0.27 0.57) |
Note. — Units of rigth ascension are hours, minutes and seconds, and units of declination are degrees, arcminutes and arcseconds. Units of (the positional uncertainty) and (the distance from the galactic center) are arcseconds. The positional uncertainty is based on the statistical error of the X-ray data alone (Sect. 3), while the absolute positional error is discussed in Sect. 4.2. Units of are erg s-1 cm-2 and those of are erg s-1; both quantities have been absorption-corrected for the Galactic column density and refer to the 0.3–8 keV band. See Sect. 3 for more details (e.g., on the definitions of the hardness ratio HR and the colors C21 and C23, and the calculation of their errors).
| J020821.5105948 | J020822.2105922 | J020823.1105952 | |
|---|---|---|---|
| : | |||
| NH (1021 cm-2) | |||
| dof | 8.1/4 | 5.2/7 | 7.6/11 |
| Flux ( erg cm-2 s-1) | 4.5 | 9.7 | 10.9 |
| Luminosity ( erg s-1) | 4.1 | 6.9 | 8.9 |
| S1 | S2 | S3 | S4 | |
|---|---|---|---|---|
| Net counts | 178 | 246 | 324 | 82 |
| : | ||||
| NH (1021 cm-2) | ||||
| dof | 7.3/6 | 11.5/9 | 15.8/12 | 2.1/5 |
| Flux ( erg cm-2 s-1) | 5.8 | 8.6 | 9.1 | 2.3 |
| Luminosity ( erg s-1) | 4.7 | 6.0 | 9.0 | 1.9 |
| : | ||||
| NH (1021 cm-2) | ||||
| (keV) | ||||
| dof | 7.0/6 | 11.9/9 | 18.4/12 | 1.9/5 |
| Flux ( erg cm-2 s-1) | 5.7 | 8.1 | 9.7 | 2.4 |
| Luminosity ( erg s-1) | 4.3 | 5.6 | 7.6 | 1.7 |
| Radius | Net counts | F(0.3–8 keV) | L(0.3–8 keV) | kT | F(0.3–8 keV) | L(0.3–8 keV) | dof | |
|---|---|---|---|---|---|---|---|---|
| ( erg cm-2 s-1) | ( erg s-1) | (keV) | (10-15 erg cm-2 s-1) | ( erg s-1) | ||||
| 5′′ | 166 | 8.4 | 6.7 | – | – | – | 8.6/9 | |
| 8.6 | 6.7 | 0.37 | 0.44 | 7.4/7 | ||||
| 10′′ | 175 | 9.8 | – | – | – | 25.0/19 | ||
| 10.0 | 0.69 | 21.9/17 | ||||||
| 30′′ | 581 | 17.9 | – | – | – | 78.2/64 | ||
| 16.9 | 1.06 | 71.9/62 |
Note. — The values are in addition to the Galactic one. Fluxes are observed values, luminosities are corrected for absorption, and are calculated for the 0.3–8 keV band. Errors give the 68% confidence interval for one interesting parameter. See also Sect. 3.1.
Note. — The values are in addition to the Galactic one. Fluxes are observed values, luminosities are corrected for absorption, and are calculated for the 0.3–8 keV band. Errors give the 68% confidence interval for one interesting parameter.
Note. — is fixed at the Galactic value of cm-2 (Tab. 1); in the spectral model, the abundance is fixed at the solar value.
Fluxes are observed, luminosities are intrinsic.
Errors give the 68% confidence range for one interesting parameter.