A new superwind galaxy: XMM-Newton observations of NGC 6810
Abstract
We present the first imaging X-ray observation of the highly inclined () Sab Seyfert 2 galaxy NGC 6810 using XMM-Newton, which reveals soft X-ray emission that extends out to a projected height of kpc away from the plane of the galaxy. The soft X-ray emission beyond the optical disk of the galaxy is most plausibly extra-planar, although it could instead come from large galactic radius. This extended X-ray emission is spatially associated with diffuse H emission, in particular with a prominent 5-kpc-long H filament on the north-west of the disk. A fraction % of the total soft X-ray emission of the galaxy arises from projected heights kpc. Within the optical disk of the galaxy the soft X-ray emission is associated with the star-forming regions visible in ground-based H and XMM-Newton Optical Monitor near-UV imaging. The temperature, super-Solar -element-to-iron abundance ratio, soft X-ray/H correlation, and X-ray to far-IR flux ratio of NGC 6810 are all consistent with local starbursts with winds, although the large base radius of the outflow would make NGC 6810 one of the few “disk-wide” superwinds currently known. Hard X-ray emission from NGC 6810 is weak, and the total – 10 keV luminosity and spectral shape are consistent with the expected level of X-ray binary emission from the old and young stellar populations. The X-ray observations provide no evidence of any AGN activity. We find that the optical, IR and radio properties of NGC 6810 are all consistent with a starburst galaxy, and that the old classification of this galaxy as a Seyfert 2 galaxy is probably incorrect.
keywords:
Galaxies: halos – Galaxies: individual: NGC 6810 – Galaxies: Seyfert – Galaxies: starburst – X-rays: galaxies.1 Introduction
NGC 6810 is a early-type spiral galaxy (morphological type Sab(s):sp, Tully 1988) also classified as a Seyfert 2 (NASA Extragalactic Database111NED: http://nedwww.ipac.caltech.edu/; see also Kirhakos & Steiner, 1990b). Despite being relatively nearby ( Mpc, see below) it has not been the target of much observational study. What little literature on NGC 6810 exists suggests that a powerful galactic-scale outflow (or superwind, Heckman et al. 1990) emanates from it. Hameed & Devereux (1999) present a H image of NGC 6810 as part of a study of star formation rates in early type spirals, but do not comment on the kpc-long emission line filament rising at an angle of out of the plane of the galaxy that is visible in their image. Coccato et al. (2004) observed NGC 6810 in a survey of ionized gas along the minor axes of spiral galaxies, noting that the high minor axis velocity dispersion and kinematics were suggestive of an outflow. The moderately high inclination222We derive an inclination for NGC 6810 of based on the optical angular size parameter D25 and R25 values given in Tully (1988). The minor to major axis angular size ratio , from which follows the inclination where for type Sab galaxies (Haynes & Giovanelli, 1984). of NGC 6810, , is advantageous for studies of extra-planar emission and is similar to other galaxies with well-studied superwinds such as NGC 253, NGC 3079 and M82 ( respectively, using averages of the values given in Strickland et al. 2004).
Superwinds may play important roles in galaxy formation and evolution (see e.g. Heckman, 2003; Veilleux et al., 2005, and references therein), but examples of starburst-driven winds that are nearby, bright enough and have suitable inclinations for detailed study are moderately rare333Within a distance of Mpc there are approximately 14 galaxies with inclinations with known or suspected superwinds, excluding NGC 6810. In order of increasing distance these are NGC 253, NGC 1482, NGC 1511, NGC 1569, NGC 1808, NGC 2146, M82 (NGC 3034), NGC 3044, NGC 3079, NGC 3628, NGC 4631, NGC 4666, NGC 4945 and NGC 5775.. The existence and properties of AGN-driven superwinds are even less well constrained (Colbert et al., 1996; Levenson et al., 2001b; Colbert et al., 2005). Given its proximity and Seyfert 2 classification we judged that NGC 6810 deserved investigation.
All currently known superwinds display extended soft diffuse X-ray emission from gas at a temperature , commonly in close spatial proximity to the warm ionized gas at (Dahlem et al., 1998; Strickland et al., 2004; Tüllmann et al., 2006). If there is a superwind in NGC 6810 there should be a 5 – 10 kpc-scale soft X-ray halo around the galaxy. The presence of the Seyfert nucleus should also be clear in the hard X-ray energy band, either via direct AGN X-ray emission or by a reflection component and fluorescent iron line emission.
2 Observations and data analysis
To test these hypotheses NGC 6810 was observed with XMM-Newton for ks starting on 2004 April 25 (Observation ID 0205220101).
We processed the data using version 6.5 of the XMM-Newton SAS software, rerunning the EPIC MOS and PN and Optical Monitor (OM) analysis pipelines with the latest calibration data. Heasoft version 5.3.1 and Ciao 3.2 were also used during data reduction. The recommended standard event grade filters and proton flare screening was applied to each dataset. After filtering the remaining exposure times in the XMM observation were 25.5 ks and 44.1 ks for PN and each MOS instruments respectively.
Spectra and response files were created using SAS and the methods described in the on-line SAS Data Analysis Threads444See http://xmm.vilspa.esa.es/sas/new/documentation/threads/. Spectral fitting was performed using Xspec (version 11.3.1t).
Simultaneous broad-band optical imaging in V, B, U, UVW1 ( 245 – 320 nm) and UVM2 ( 205 – 245 nm) bands was obtained using the OM in standard imaging mode (Mason et al., 2001). These observations achieved typical limiting magnitudes for a detection of 19.5 (V), 20.7 (B), 20.1 (U), 20.1 (UVW1) and 19.4 (UVM2). Regions of the images near to NGC 6810 are marred by elliptical stray light features caused by internal reflections within the OM telescope.
Copies of the R-band and continuum-subtracted H images of NGC 6810 presented in Hameed & Devereux (1999) were obtained from the NASA Extragalactic Database. Astrometric solutions for these images were calculated based on the V-band OM images, which match up with Digital Sky Survey images to within . Pointing offsets during the OM observations were typically also .
NGC 6810 is not bright enough an X-ray source to provide useful X-ray spectra with the grating spectrometers on XMM-Newton (the RGS). The RGS data are not discussed further.
3 X-ray results
3.1 The spatial distribution of the X-ray emission
Images in – 1.1, 1.1 – 2.8 and 2.8 – 8.0 keV energy bands were created from the EPIC PN and MOS data. These energy bands were chosen based on the X-ray spectrum of NGC 6810 discussed below. The images from each MOS detector were combined for the purposes of further image analysis. In each energy band the background intensity was estimated as the mean surface brightness on the same CCD chip as NGC 6810, after excluding the data within a radius of of any detected point-like X-ray source or within of NGC 6810. A simple uniform-level background subtraction is appropriate given the relative compactness and brightness of the X-ray emission from NGC 6810.
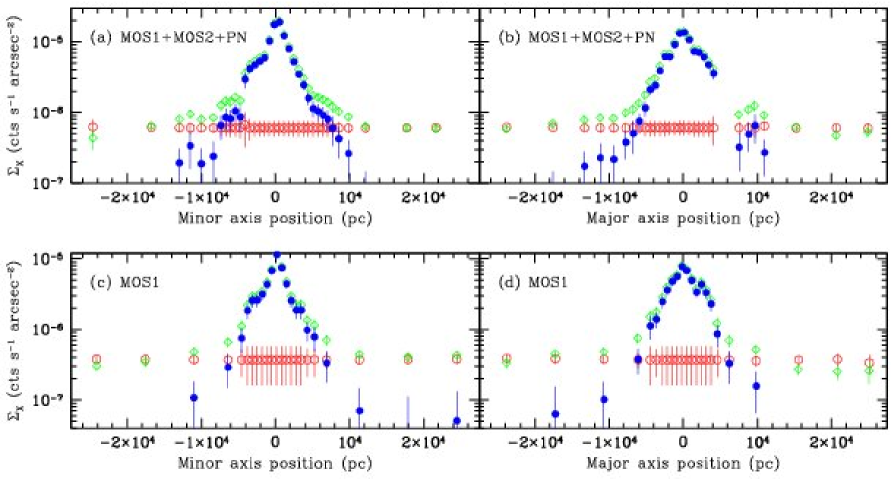
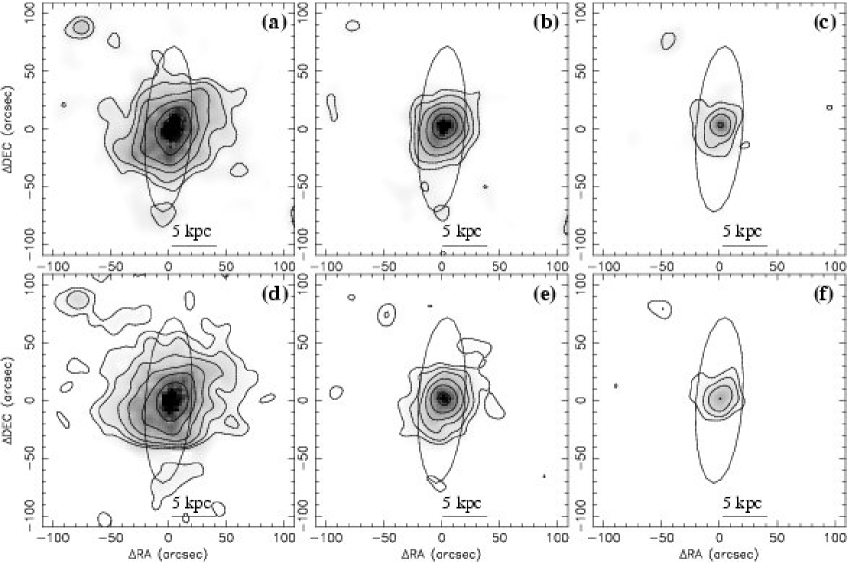
Figure. 1 shows adaptively smoothed PN and combined MOS images of NGC 6810 overlaid with surface brightness iso-contours from images smoothed with a Gaussian mask. Displaying the PN and combined MOS images separately is helpful when studying faint extended emission in that it allows us to ascertain whether certain features of interest are genuine and which may be statistical or smoothing artifacts. The lowest contour levels displayed in these images are between 3 – 4.7 above the background, given the uniform smoothing (see Hardcastle, 2000).
In these smoothed images the soft extended X-ray emission can be traced out to a projected angular separation of – ( – 9 kpc) from the plane of NGC 6810. The emission appears to arise from within the optical disk interior to a radius of (6.5 kpc) from the center of the galaxy. The centroid of the soft X-ray emission is slightly offset to the north west of the center of the galaxy. In the hard X-ray band ( – 8.0 keV) a single point-like region of emission, roughly coincident with the center of NGC 6810, is visible.
Smoothing will artificially increase the apparent extent of the X-ray emission. To better quantify the projected size of the soft X-ray emission 1-dimensional profiles of the X-ray surface brightness along the major and minor axes of NGC 6810 were created (see Fig. 2), excluding the emission from X-ray sources not obviously associated with NGC 6810.
The profiles display the total surface soft X-ray brightness, the surface brightness of the expected background (both the genuine X-ray and particle background) and the background-subtracted emission associated with NGC 6810. A version of the SAS processing task edetect_chain, altered to correctly treat the presence of diffuse emission in and around NGC 6810, was used to detect X-ray sources and create maps of the total background and exposure time over the entire field of view of each of the MOS1, MOS2 and PN instruments. The surface brightness profiles were creating using this location-specific background and exposure time information, excluding statistically significant X-ray sources (other than NGC 6810 itself) and detector-specific chip-gaps, bad CCD pixels and bad columns. The values of the MOS and PN backgrounds produced by this method is within % of the average local background values used for the images displayed in Fig. 1 and the X-ray spectra discussed in § 3.4. Each bin in the surface brightness profiles was initially the sum of the data in a region of width parallel to the axis of interest and total length perpendicular to that axis. Subsequently consecutive bins were rebinned with the aim of achieving a minimum of 20 counts per final bin.
In an effort to maximize the signal-to-noise for the faintest emission the data from the PN and both MOS detectors was combined, and it is these combined profiles that are shown in the top panels of Fig. 2. In general the surface brightness profiles produced from the PN, MOS1 and MOS2 detectors individually were very similar to each other (with the PN and MOS2 profiles being the most similar to each other), justifying their combination. The profiles from the MOS1 detector were the most different, and are shown in the lower panels of Fig. 2, but still display the same general features.
The soft X-ray minor and major axis surface brightness profiles for NGC 6810 are similar in form to the diffuse emission profiles found in Chandra X-ray observations of highly-inclined starburst galaxies (Strickland et al., 2004), although note that in the XMM-Newton data we can not robustly remove X-ray emission from the point sources in NGC 6810. The surface brightness drops rapidly with increasing distance from the nucleus of the galaxy along both minor and major axes. The minor axis profiles also clearly show the asymmetry in the soft extended emission between the east and west sides of the disk, presumably caused by absorption within the disk of NGC 6810.
No obvious end or edge to the this extended soft X-ray emission can be discerned from this data. At low signal-to-noise the emission appears to extends out to projected distances of or 10 – 15 kpc ( – ) from the center of the galaxy. However it is possible that, rather than genuine emission from these locations, we are instead seeing emission from the bright central regions of NGC 6810 in the very extended, but low surface brightness, wings of the XMM-Newton PSF. However, at intermediate distances from the nucleus the extended emission must predominantly be genuine, as the central core of the PSF is too compact (FWHM , Half Energy Width ) to be responsible for the diameter region of bright soft X-ray emission (e.g. Fig. 1 or Fig. 2).
With no clear edge and the effect of the PSF it is impossible to quantify the size of the extended soft X-ray emission in a manner that is not observation-specific. In common with observations of extra-planar radio emission from spiral galaxies (e.g. Dahlem et al., 1995, 2006) we will quote the extent as the observed size at a fixed statistical significance, here evaluated as the size at in the background-subtracted surface brightness profiles. Under this definition the – 1.1 keV emission extends to projected heights of (west) and kpc (east) along the minor axis, and along the major axis to projected radii of (north) and kpc (south).
3.2 Comparison to UV and optical images
If we compare the X-ray images to ground-based optical and near-UV images from the Optical Monitor it becomes apparent that the soft diffuse X-ray emission is closely associated with the strongest star forming regions in the disk, and with warm-ionized gas such as the H filament that projects beyond the optical disk of the galaxy (Fig. 3).
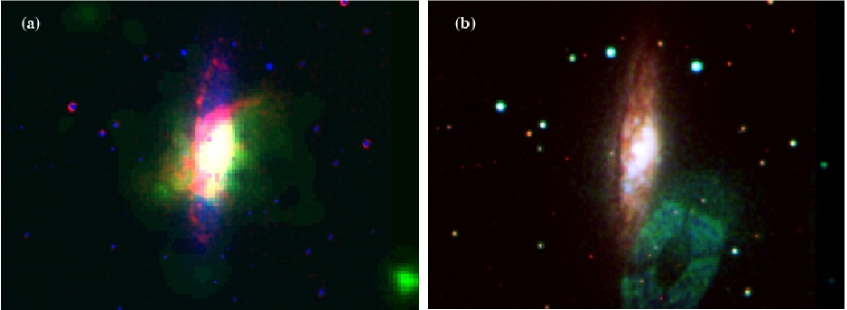
The most intense soft X-ray emission occurs at the region of brightest optical and near-UV emission. This region is slightly offset, by , to the NNW of the nuclear position from the 2MASS near-IR observations (2MASS Extended Objects. Final Release, shown as the white cross in panels a to c of Fig. 3). This offset is larger than the accuracy of the OM, optical and 2MASS IR image astrometry. Strong dust lanes throughout the optical disk of the galaxy are visible in the 3 color composite image shown in Fig. 4, and even more so in an archival F606 HST WFPC2 image which partially covers the nuclear region of NGC 6810. Thus the offset of the optical and UV nucleus from the IR may be due to obscuration. Alternatively the 2MASS position might be in error, in which case the true nucleus of NGC 6810 lies at 19:43:34.3, -58:39:17.3 () (J2000.0).
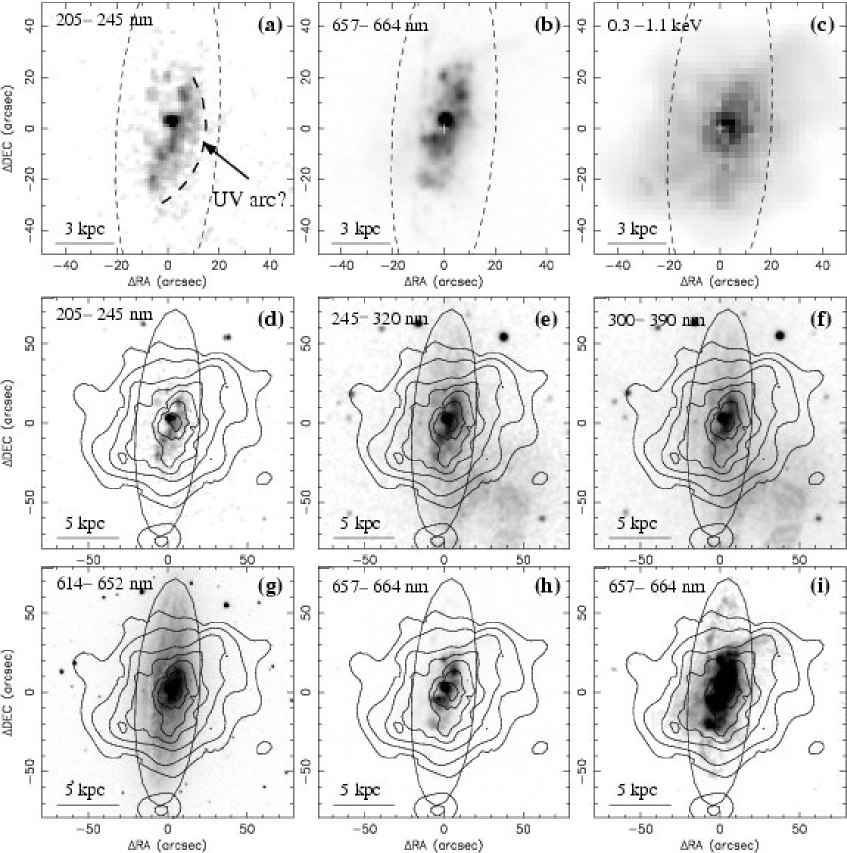
With respect to the nucleus or the nearby UV/H/X-ray central peak the larger-scale UV emission is the most asymmetrically distributed. What appears to be a UV-bright arc partially cups the nuclear emission to the west and south, with a total major-axis diameter of , with scattered fainter UV sources at slightly larger radius. In the H image the UV arc and exterior fainter UV sources appear to all be part of a roughly rectangular H-bright region along Position Angle , (offset from the PA of the optical disk by ) and of total length . The north western edge of this region is the base of the most prominent H filament, which extends at least ( kpc) from the plane of the galaxy (see Fig 3i).
At low surface brightness the outer edge of the optical disk sports a ring of Hii regions coincident with an optical dust lane (Fig. 4). This ring is not visible in the soft X-ray images, even though X-ray emission is detected at regions of similar H surface brightness outside of the optical disk.
The spatial resolution of the EPIC PN and MOS instruments is insufficient to allow X-ray emission from compact sources to be separated from truly diffuse emission. The extended soft X-ray emission we observe is likely to be mainly diffuse thermal emission but this can not be proven with the existing data. Observations with the Chandra X-ray Observatory would certainly allow a better separation of the extended emission into diffuse and point-like X-ray sources, in particular in and around the UV and H bright star forming regions.
3.3 Emission region geometry
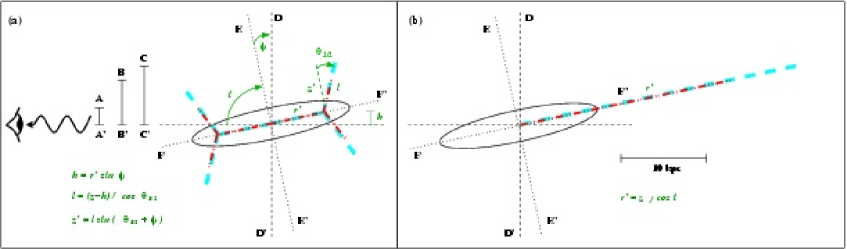
With an inclination of the exact location of the extended soft X-ray emission is ambiguous with respect to the true disk plane of NGC 6810. In particular the soft X-ray emission seen in projection beyond the optical disk of the galaxy may indeed be extra-planar emission at heights of several kiloparsecs along the minor axis, or it might be emission at large galactic radius but still within the plane of the galaxy. A scale diagram of these scenarios is shown in Fig. 5.
If much of the X-ray and H emission is associated with a starburst-driven wind then it can be seen from Fig. 5a that the apparent size of the emission features (i.e. seen in projection) is similar to but larger than their true vertical extent. In the example shown the true radius of the base of the outflow is assumed to be kpc. The true vertical extent of the X-ray emission kpc can be calculated given that the apparent projected height kpc is the sum of the projected extent of inclined disk (, where ) and the projected size of the edge of the outflow , where is the half opening angle in the truncated conical geometry we assume, and that .
In this case much of the soft X-ray emission ( keV) within the optical confines of the disk and beyond it is likely to be genuinely-diffuse thermal emission. Indeed fitting the EPIC PN and MOS spectrum of the entire galaxy confirms the presence of a soft thermal component (see below). Note that only a minor fraction of the soft X-ray emission comes from regions beyond the optical disk of the galaxy, and it should be noted that the total X-ray spectrum presented below is not necessarily representative of this (possibly) extra-planar X-ray emitting material.
If the emission seen at a projected height above the disk mid-plane is not actually extra-planar then it must lie at a large galacto-centric radius, , as shown in Fig. 5b. For the optically-derived inclination of for NGC 6810 then the north-western H filament, with a projected height of kpc, would actually extend out to kpc. The soft X-ray emission extends to a projected height of kpc, implying a true radial extent of kpc in this model. These values are large compared to the stellar radius of the galactic disk. Bright H and/or soft X-ray emission is not typically observed so far beyond the stellar disk of spiral galaxies unless it is extra-planar (Bland-Hawthorn et al., 1997; Read et al., 1997; Tyler et al., 2004).
The estimates of the true radial and vertical sizes are sensitive to the assumed geometry, in particular uncertainties in the inclination of the galaxy. For example, an error of only in our adopted inclination would change the radial extent of the X-ray emission in the second case given above by between 30 and 70% from the value estimated above.
As emission from large galactic radius is less likely than extra-planar emission we will assume for the remainder of the paper that the emission beyond the optical disk of NGC 6810 is extra-planar.
Note that with the existing data we can not prove unambiguously that this is the case. Sensitive high-spatial resolution X-ray observations with Chandra might be used to distinguish between the two scenarios. If the emission geometry is similar to that shown in Fig. 5a then we would expect to see evidence of additional absorption of the X-ray emission near the eastern optical edge of the disk, as the X-ray emission seen in projection in this region would need to pass through the intervening disk of NGC 6810 to reach us (an example of this effect can be seen in NGC 253, e.g. Pietsch et al. 2000). We would also need to know more about the Hi gas distribution in NGC 6810 before assessing whether such a test were feasible. Hi mapping would also be advantageous in providing more accurate determinations of the inclination angle of the disk.
One explanation for the position angle offset between the large-scale optical disk of NGC 6810 and the UV, H and soft X-ray bright innermost 6 kpc is that this is a stellar bar. The presence of bars, and their association with the base of the wind in superwind galaxies, has been remarked upon before (Strickland et al., 2004). However the existing data is equally consistent with the UV arc and H-bright region being partially obscured inner spiral arms or a circum-nuclear star forming ring.
For the purpose of comparing the presumed extra-planar emission with other highly inclined () star forming galaxies observed with Chandra and XMM-Newton an estimate of the fraction of the total (background-subtracted) X-ray count rate in the – 1.1 keV energy band arising at minor axis heights is given in Table 1. The total count rate was assessed in rectangular region of total width (along the major axis of the galaxy) and total (minor-axis) height () centered on the nucleus. Both MOS and PN data give a similar answer, with % of the soft band X-ray emission coming from the halo of NGC 6810. This halo fraction is not as accurate an estimate of the fraction of diffuse X-ray emission from the halo as might be obtained with Chandra, given the larger PSF wings of XMM-Newton, that we can not separate point source from diffuse emission, and can not correct for the probably higher absorption experienced by diffuse emission within the disk of the galaxy. Nevertheless it is lies within the range of halo diffuse flux fraction found for other starburst galaxies with superwinds (7 – 48%, Strickland et al. 2004), and supports the hypothesis that the soft X-ray emission in NGC 6810 extends from the disk into its halo.
| Parameter | Units | Count rate in each energy band | Halo count rate fraction | ||
|---|---|---|---|---|---|
| –2.0 keV | –10.0 keV | –10.0 keV | –1.1 keV | ||
| PN count rate | cts/s | ||||
| MOS1 count rate | cts/s | ||||
| MOS2 count rate | cts/s | ||||
3.4 Spectral analysis
We created X-ray spectra of NGC 6810 including all emission within a radius of of the nucleus. No attempt was made to create multiple spectra of different regions within NGC 6810 as the angular diameter of the X-ray emission from NGC 6810 is only of order several PSF widths, and as the X-ray emission from within the galactic disk is essentially unresolved.
Background spectra were created from a source-free circular region of radius centered at 19:43:30.1, -58:37:04.5, directly adjacent to the region the NGC 6810 spectra were extracted from, and also on the same CCD chips. The background-subtracted count rates for NGC 6810 in each EPIC instrument are given in Table 1.
Spectral models where fit simultaneously to the PN, MOS1 and MOS2 spectra, allowing for small cross-calibration uncertainties between the different detectors. The spectra were binned to ensure a minimum of 10 counts per bin to allow the use of fitting. As calibration uncertainties remain significant at low energies we adopt a conservative approach and only fit the spectral data in the E=0.5 – 10.0 keV energy band.
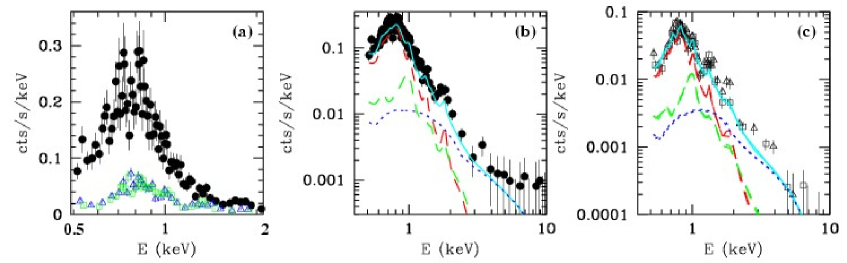
Inspection of the EPIC spectrum of NGC 6810 (Fig. 6) reveals soft thermal emission with line features at energies keV and a fainter featureless continuum for keV. This is typical of CCD spectra of star forming galaxies (see for e.g. Ptak et al., 1997; Dahlem et al., 1998; Strickland et al., 2004; Tüllmann et al., 2006). There is no sign of the scattered AGN continuum or strong Fe-K fluorescence that is commonly found in Seyfert 2 galaxies, including those with starbursts (Levenson et al., 2001a; Levenson et al., 2002).
A statistically satisfactory fit was obtained using a spectral model comprised of an absorbed collisionally ionized plasma (we used the APEC plasma code, Smith et al. 2001) to represent the diffuse hot gas, and an additional more-highly-absorbed power law to represent X-ray binaries and any low luminosity AGN component.
| Parameter | Units | Spectral model | |
|---|---|---|---|
| 1T + PL | 2T + PL | ||
| … | |||
| … | |||
| 10 (Fixed) | 2 (Fixed) | ||
| … | |||
| (d.o.f) | … | 1500.6 (3158) | 1492.6 (3156) |
Note:– The spectral models used were (in the terminology used within xspec) wabs*(vapec+wabs*po) and wabs*(vapec+vapec+wabs*po). Both thermal and power law components experience absorption by component , while the power law component experiences an additional column . The metal abundances (with respect to the Solar abundances of Anders & Grevesse (1989)) of both thermal components were assumed to be the same in the two-temperature hot plasma model. The APEC model normalization factor where the emission integral . The power law model normalization factor is the photon flux in units of photons measured at keV. Fluxes and luminosities are quoted in the energy band – 8.0 keV. The total observed flux is , i.e. no correction for absorption has been made. All other fluxes and luminosities were absorption-corrected to provide an estimate of the intrinsic flux emitted within NGC 6810. The confidence regions quoted for fluxes and luminosities are 68.3% confidence for one interesting parameter, all other confidence regions are 90% confidence for one interesting parameter. The error on the observed flux was calculated using the Xspec flux Monte Carlo method, all other flux and luminosity errors are more approximate as they are based on scaling the uncertainties in the model normalizations.
Using a hot plasma model with Solar abundance ratios (Anders & Grevesse, 1989) results in clear systematics in the spectral fit residuals. The systematics in the residuals disappeared once we fitted for the abundance of the elements (specifically the abundances of O, Ne, Mg, Si and Ar were constrained to be equal) and iron. We obtain an enhanced relative abundance of -elements to iron (best fit ), again characteristic of starburst galaxies (Strickland et al., 2004). Note that the absolute values of the X-ray derived elemental abundances with respect to hydrogen are ambiguous, given that we are fitting a simple spectral model to emission most probably coming from many spectrally-distinct regions within NGC 6810 (Dahlem et al., 2000; Weaver et al., 2000) and also because there are degeneracies in fitting CCD-spectral resolution X-ray spectra of -enhanced plasmas (Martin et al., 2002; Strickland et al., 2004). A two-temperature plasma model provides a marginally better fit than a single temperature model, but we would expect the need for a multi-temperature plasma model to become more apparent with higher signal-to-noise spectra. The best-fit spectral parameters for NGC 6810 are given in Table 2. To ease comparison to other galaxies observed with Chandra we present fluxes and luminosities in the – 8.0 keV energy band. The temperature of the dominant thermal component, , is typical of values found in fits to the total X-ray emission from starburst galaxies (Read et al., 1997; Ptak et al., 1997; Dahlem et al., 1998; Dahlem et al., 2003). We would expect that there is actually a range of temperatures present, with the extra-planar emission being on average cooler than the thermal emission from the disk.
The power law component best-fit photon index is again typical of a purely star forming galaxy. The dominance of the soft thermal component in the spectrum prevents us from constraining the absorption column toward the hard X-ray source or sources. We fixed this column density at , but equally good spectral fits could be obtained with . For the purposes of illustrating the effect this uncertainty has on the best-fit spectral parameters the best-fit single temperature hot plasma model plus heavily absorbed power law () is also shown in Table 2.
The similarity of the best-fit power law slope to binary emission from normal galaxies does not alone exclude the presence of an AGN, as Seyfert 1 galaxies also have hard continuum spectra with , but the hard X-ray luminosity of NGC 6810 (, 2–8 keV) is too low for an unobscured Seyfert galaxy.
| Property | Value | Note |
|---|---|---|
| Galaxy type | Sab(s):sp | 1 |
| 2 | ||
| Distance | 27.1 Mpc | 3 |
| at | 131.3 pc | |
| Major axis P.A. | 176 | 1 |
| 4 | ||
| , 18.9 kpc | 4 | |
| 5 | ||
| 6 | ||
| IRAS | 1.27 Jy | 7 |
| IRAS | 3.55 Jy | 7 |
| IRAS | 18.2 Jy | 7 |
| IRAS | 32.6 Jy | 7 |
| / | 0.56 | 7 |
| 1.87 | 8 | |
| 7 | ||
| 9 | ||
| mJy | 10 | |
| 2.57 | 11 | |
| 12 | ||
| /H | 0.63, 0.62 | 12, 13 |
| FWHM (H) | 13 | |
| FWHM () | 13 | |
| 12 | ||
| 9 | ||
| -3.77 – -3.60 | 14 |
-
1..
From Tully (1988).
-
2..
Recessional velocity from Sanders et al. (2003).
-
3..
Assuming Mpc-1.
- 4..
-
5..
The inclination-corrected rotational velocity is related to the W20 value given in Tully (1988): .
-
6..
Baryonic galactic mass (Bell & de Jong, 2001).
- 7..
-
8..
As defined in Condon & Broderick (1991) the mid-IR spectral slope .
-
9..
Star formation rates derived from the IR or H luminosity using the equations given in Kennicutt (1998), converted to a Salpeter IMF between mass limits of 1 and 100 . The SFR assuming a Kroupa IMF is 1.7 times larger.
-
10..
Radio flux density at 4.85 GHz from Wright et al. (1994).
-
11..
The Far-IR to radio flux ratio as defined in Condon & Broderick (1991).
-
12..
The extinction-corrected H flux is based on the H+[Nii] flux given in Hameed & Devereux (2005), corrected for [Nii] emission using the Nii/H flux ratio measured by Kewley et al. (2001). The Cardelli et al. (1989) extinction model was used to derive A(H) from the E(B-V) value found by Kewley et al. (2001).
-
13..
From Kirhakos & Steiner (1990b).
-
14..
Logarithm of the total thermal X-ray flux to the FIR flux defined as .
4 The nature of NGC 6810
The -kpc-scale extended soft X-ray emission discovered in the XMM-Newton observations, the previously-discovered kpc-scale H filament (Hameed & Devereux, 1999) and the minor-axis warm ionized gas kinematics (Coccato et al., 2004) are in combination convincing evidence for a galactic-scale superwind from NGC 6810.
Can we identify whether the outflow in NGC 6810 is a Seyfert 2-or-supernova-driven wind? It has already been mentioned that the effective temperature, apparent -element to iron abundance ratio and halo-to-total X-ray luminosity ratios of NGC 6810 are consistent with the other local starbursts with superwinds. Table 3 is a compilation of a variety of the pertinent parameters of NGC 6810 derived from the literature.
NGC 6810 should be classified as a starburst galaxy based on standard IR diagnostics using IRAS fluxes. The 60µm to 100µm flux ratio of 0.56 is typical of starburst galaxies (Lehnert & Heckman, 1996a, b). Of course a buried AGN might also elevate the mean dust temperature above that of a normal spiral galaxy, but we would then expect a lower mid-IR spectral slope . Again NGC 6810 has IR properties typical of normal starburst, , significantly higher than the typical value of of IRAS galaxies with AGN (Condon & Broderick, 1991).
With an total observed 4.85 GHz radio flux of mJy (Wright et al., 1994) and a radio to FIR flux ratio of , NGC 6810 falls on the radio/FIR correlation for normal and starburst galaxies (mean , see Condon & Broderick 1991). Forbes & Norris (1998) studied the central few arcseconds of NGC 6810, finding a low brightness temperature and a q-value consistent with starburst activity even in this nuclear region.
The star formation rate of NGC 6810 is – based on the galaxy’s H and IR luminosities (these rates assume a Salpeter IMF between mass limits of 1 and ). The core-collapse SN rate associated with this is approximately one-tenth of the star formation rate, but the associated kinetic energy input of – would be sufficient to power a superwind (the value comes from the Leitherer et al. (1999) starburst model for constant star formation rate, evaluated 30 Myr after the onset of star formation).
In local starbursts with superwinds the soft diffuse X-ray emission associated with the wind typically has a luminosity that is only several hundredths of a percent of the IR luminosity of the galaxy. The XMM-Newton observations of NGC 6810 lack the spatial resolution necessary to cleanly separate diffuse from point-like X-ray emission, but a reasonable approximation is to use the total estimated soft thermal X-ray luminosity as a proxy for the truly diffuse emission. The logarithm of the ratio of the thermal X-ray flux to the FIR flux is to -3.6 for NGC 6810 (see Tables 2 and 3). Again these numbers are consistent with local starbursts with superwinds, where the log of the soft diffuse X-ray flux to the FIR flux is (Strickland, 2004).
The soft X-ray luminosity, X-ray/FIR luminosity ratio and IRAS 60µm to 100µm flux ratio of NGC 6810 are extremely similar to those of NGC 1511, another starburst galaxy with a probable wind observed with XMM-Newton (Dahlem et al., 2003). This is despite their baryonic masses differing by close to an order of magnitude. It illustrates how strongly correlated the soft X-ray and FIR properties of star forming galaxies are, and (contrary to naïve expectation) how little effect large galactic mass appears to have on starburst-driven superwinds. Galaxy mass does appears to play a role in determining the critical star formation rate per unit disk area for creation of radio (and presumably hot gas) halos around spiral galaxies (Dahlem et al., 2006), but for a galaxy of the mass and size of NGC 6810 the transition between galaxies with and without radio halos occurs at a mean star formation rate per unit area approximately two orders of magnitude lower than that found in NGC 6810.
The X-ray emission not associated with the thermal components (i.e. the hard X-ray emission and the power law component, all presumably from compact objects) is also at the level we would expect from purely stellar processes with no additional AGN contribution required. Colbert et al. (2004) found an empirical relationship for the X-ray point source luminosity of galaxies from both young and old stellar populations. Given the stellar mass of NGC 6810 (, see Table 3) we would expect the point source X-ray luminosity from the old stellar population to be in the – 8.0 keV energy band. The expected X-ray emission from point sources associated with ongoing star formation is (we have corrected for the different IMFs used in the the SF rate given in Table 3 and Colbert et al. (2004)). The total predicted X-ray point source luminosity of is 2.5 times larger than the luminosity of the power law component in NGC 6810, but this is within the level of scatter expected from the Colbert et al. relationship.
The above mentioned galactic properties and the lack of any sign of AGN activity in the 0.5 – 10 keV energy band cast doubt on the classification of NGC 6810 as a Seyfert 2 galaxy. The original classification of NGC 6810 as a Seyfert 2 galaxy is due to Kirhakos & Steiner (1990b), based on follow-up optical spectroscopy of IRAS sources near to or within the HEAO-1 hard X-ray error boxes of previously unidentified X-ray sources (Wood et al., 1984; Kirhakos & Steiner, 1990a). Kirhakos & Steiner identified NGC 6810 as the counterpart to the HEAO-1 source 1H1930-589, even though NGC 6810 lies outside the 95% confidence error box of this source. This X-ray source had a – 10 keV X-ray flux of , which would correspond to a Seyfert-2-like luminosity of if the source lies at the distance of NGC 6810. NGC 6810 also satisfied their optical spectroscopic criteria for classification as an AGN: [Nii]/H and/or FWHM ( [Oiii] or H) , although just barely as only the [Oiii] line width satisfies their criterion (see Table 3).
A [Oiii] line width this large would be unusual in a normal galaxy, but not in a starburst galaxy with a superwind, where the velocity of warm ionized gas typically reaches 200 – (Heckman et al., 1990; Adelberger et al., 2003). Indeed Coccato et al. (2004) specifically discuss the large line width in NGC 6810 in terms of a possible outflow. Kewley et al. (2001) apply a variety of galaxy classification methods based on optical line fluxes to IRAS galaxies in the southern hemisphere. Of the eight methods they apply to NGC 6810 they classify it as a Hii galaxy six times, with one method giving ambiguous results and one method yielding a classification of extreme starburst / borderline LINER.
Forbes & Norris (1998) also suggest the NGC 6810 may have been misclassified as being a Seyfert 2 galaxy, based on its starburst-like radio properties and unpublished optical spectra. However they also point out that several Seyfert galaxies with nuclear star formation have radio and IR properties dominated by the star formation despite being bona fide Seyfert 2 galaxies.
As we have discussed the hard X-ray spectrum and luminosity of NGC 6810 are inconsistent with a Seyfert 2 classification. The identification of NGC 6810 with 1H1930-589 is most probably spurious. That NGC 6810 had a significantly higher X-ray luminosity in the early 1980’s is a less likely alternative, as there is no other evidence of NGC 6810 ever being a luminous hard X-ray source (Ward et al. (1978) place a upper limit on the – 10 keV luminosity of NGC 6810 of based on Ariel 5 data), nor would the optical classification of the galaxy suggest it to be, or have recently been, a Seyfert galaxy. The possibility remains that either a low luminosity AGN, or a more luminous but very heavily obscured AGN, is present in NGC 6810. Deep observations with the Hard X-ray Detector (HXD) on Suzaku would be needed to rule the second possibility out, but at present we conclude that NGC 6810 does not deserve classification as an active galaxy. Radio continuum observations of NGC 6810 would offer another method of searching for a low luminosity AGN, in addition to constraining the location of recent SN activity within the disk.
There is one respect in which the outflow from NGC 6810 may be less than typical, in that the wind appears to originate not in a compact ( kpc) nuclear starburst (as seen in “classic” superwind galaxies such as NGC 253, M82 and NGC 3079), but to have a large -kpc radius base. Such “disk-wide” superwinds are less common than the nuclear superwinds, although there are a handful of previously known examples such as NGC 4666 (Dahlem et al., 1997) and NGC 5775 (Tüllmann et al., 2006). The base radius of a superwind appears to match the region of active star-formation (see e.g. Strickland, 2004), and as we have mentioned earlier may be related to stellar bars (for unknown reasons). Indeed, one of the greatest current weaknesses of numerical models of superwinds is their failure to produce a wind base radius equal to the radius of the star formation region without imposing unphysical boundary conditions (Tenorio-Tagle & Muñoz-Tuñón, 1997; Strickland & Stevens, 2000).
Higher spatial resolution X-ray or optical narrow-band imaging of NGC 6810 would be advantageous in showing whether the extra-planar H filament and/or soft X-ray emission physically joins up with the disk at kpc, or whether this is an optical illusion caused by the projection of a hourglass-shaped nuclear outflow onto the background disk of the galaxy. Hi or CO mapping is required to confirm the presence of a bar, and would also better constrain the relative geometry of the hotter ionized gas.
5 Conclusions
An observation of NGC 6810 with XMM-Newton reveals the presence of extended soft X-ray emission within and beyond the optical disk of the galaxy. The emission seen above and below the plane of the galaxy might be emission seen in projection from large galactic radius ( kpc), but is more plausibly extra-planar emission extending to heights of kpc from the plane of the galaxy. This, along with previously known H filamentation and peculiar minor-axis ionized gas kinematics, strongly suggest that NGC 6810 is host to a galactic-scale superwind.
The soft X-ray emission seen in projection within the optical disk of the galaxy is closely associated with star-forming regions visible in ground-based H and XMM-Newton Optical Monitor near-UV imaging. The actively star forming regions, and apparently also the base of the hypothesized outflow, extend out to a radius of kpc from the nucleus, and are associated with either a stellar bar or a partially obscured star-forming ring. The apparently extra-planar soft X-ray emission is spatially associated with H emission, in particular with a prominent 5-kpc-long H filament on the north-west of the disk.
The soft diffuse X-ray emission is presumably thermal bremsstrahlung and line emission from a collisionally-ionized plasma, based on combined EPIC PN and MOS spectral fitting, and has an intrinsic luminosity of – in the – 8.0 keV energy band. The characteristic temperature keV, -element-to-iron abundance ratio , close soft X-ray/H spatial association and X-ray to far-IR flux ratio are all consistent with local galaxies hosting supernova-driven winds.
The apparently large base radius of the outflow ( kpc) makes NGC 6810 one of the few “disk-wide” superwinds currently known, as most local superwinds appear to arise in kpc-scale nuclear starburst regions.
Hard X-ray emission from NGC 6810 is weak. The total – 10 keV luminosity is and the spectrum best fit with a moderately-absorbed power law. Based on the stellar mass and star formation rate of NGC 6810 the observed hard X-ray emission can be fully accounted for with expected level of X-ray binary emission from from the old and young stellar population.
The X-ray observations provide no evidence of any AGN activity consistent with the previous classification of this galaxy as a Seyfert 2. We find that the X-ray, optical, IR and radio properties of NGC 6810 are all consistent with a starburst galaxy. The old classification of this galaxy as a Seyfert 2 galaxy is probably incorrect, and can be explained based on the mis-identification of an unrelated HEAO-1 X-ray source with NGC 6810 and the broader-than-normal optical emission lines caused by a supernova-driven outflow.
We conclude that NGC 6810 is an early-type spiral of roughly equivalent mass to the Milky Way, hosting a superwind with an intriguingly large base radius.
Acknowledgments
It is a pleasure to thank the referee, Michael Dahlem, for the constructive comments that improved the content of this paper. This work was funded by grant NNG04G181G from by NASA. This research has made use of the NASA/IPAC Extragalactic Database (NED) which is operated by the Jet Propulsion Laboratory, California Institute of Technology, under contract with the National Aeronautics and Space Administration.
References
- Adelberger et al. (2003) Adelberger K. L., Steidel C. C., Shapley A. E., Pettini M., 2003, ApJ, 584, 45
- Anders & Grevesse (1989) Anders E., Grevesse N., 1989, Geochim. Cosmochim. Acta, 53, 197
- Bell & de Jong (2001) Bell E. F., de Jong R. S., 2001, ApJ, 550, 212
- Bland-Hawthorn et al. (1997) Bland-Hawthorn J., Freeman K. C., Quinn P. J., 1997, ApJ, 490, 143
- Cardelli et al. (1989) Cardelli J. A., Clayton G. C., Mathis J. S., 1989, ApJ, 345, 245
- Coccato et al. (2004) Coccato L., Corsini E. M., Pizzella A., Morelli L., Funes J. G., Bertola F., 2004, A&A, 416, 507
- Colbert et al. (1996) Colbert E. J. M., Baum S. A., Gallimore J. F., O’Dea C. P., Christensen J. A., 1996, ApJ, 467, 551
- Colbert et al. (2004) Colbert E. J. M., Heckman T. M., Ptak A. F., Strickland D. K., Weaver K. A., 2004, ApJ, 602, 231
- Colbert et al. (2005) Colbert E. J. M., Strickland D. K., Veilleux S., Weaver K. A., 2005, ApJ, 628, 113
- Condon & Broderick (1991) Condon J. J., Broderick J. J., 1991, AJ, 102, 1663
- Dahlem et al. (2003) Dahlem M., Ehle M., Jansen F., Heckman T. M., Weaver K. A., Strickland D. K., 2003, A&A, 403, 547
- Dahlem et al. (1995) Dahlem M., Lisenfeld U., Golla G., 1995, ApJ, 444, 119
- Dahlem et al. (2006) Dahlem M., Lisenfeld U., Rossa J., 2006, A&A, p. in press
- Dahlem et al. (2000) Dahlem M., Parmar A., Oosterbroek T., Orr A., Weaver K. A., Heckman T. M., 2000, ApJ, 538, 555
- Dahlem et al. (1997) Dahlem M., Petr M. G., Lehnert M. D., Heckman T. M., Ehle M., 1997, A&A, 320, 731
- Dahlem et al. (1998) Dahlem M., Weaver K. A., Heckman T. M., 1998, ApJS, 118, 401
- Forbes & Norris (1998) Forbes D. A., Norris R. P., 1998, MNRAS, 300, 757
- Hameed & Devereux (1999) Hameed S., Devereux N., 1999, AJ, 118, 730
- Hameed & Devereux (2005) Hameed S., Devereux N., 2005, AJ, 129, 2597
- Hardcastle (2000) Hardcastle M. J., 2000, A&A, 357, 884
- Haynes & Giovanelli (1984) Haynes M. P., Giovanelli R., 1984, AJ, 89, 758
- Heckman (2003) Heckman T. M., 2003, in Avila-Reese V., Firmani C., Frenk C. S., Allen C., eds, Galaxy Evolution: Theory & Observations Starburst-Driven Galactic Winds. Revista Mexicana de Astronomía y Astrofísica Conference Series 17, p. 47
- Heckman et al. (1990) Heckman T. M., Armus L., Miley G. K., 1990, ApJS, 74, 833
- Kennicutt (1998) Kennicutt R. C., 1998, ARA&A, 36, 189
- Kewley et al. (2001) Kewley L. J., Heisler C. A., Dopita M. A., Lumsden S., 2001, ApJS, 132, 37
- Kirhakos & Steiner (1990a) Kirhakos S. D., Steiner J. E., 1990a, AJ, 99, 1435
- Kirhakos & Steiner (1990b) Kirhakos S. D., Steiner J. E., 1990b, AJ, 99, 1722
- Lehnert & Heckman (1996a) Lehnert M. D., Heckman T. M., 1996a, ApJ, 462, 651
- Lehnert & Heckman (1996b) Lehnert M. D., Heckman T. M., 1996b, ApJ, 472, 546
- Leitherer et al. (1999) Leitherer C., et al., 1999, ApJS, 123, 3
- Levenson et al. (2002) Levenson N. A., Krolik J. H., Życki P. T., Heckman T. M., Weaver K. A., Awaki H., Terashima Y., 2002, ApJ, 573, L81
- Levenson et al. (2001a) Levenson N. A., Weaver K. A., Heckman T. M., 2001a, ApJS, 133, 269
- Levenson et al. (2001b) Levenson N. A., Weaver K. A., Heckman T. M., 2001b, ApJ, 550, 230
- Martin et al. (2002) Martin C. L., Kobulnicky H. A., Heckman T. M., 2002, ApJ, 574, 663
- Mason et al. (2001) Mason K. O., et al., 2001, A&A, 365, L36
- Pietsch et al. (2000) Pietsch W., Vogler A., Klein U., Zinnecker H., 2000, A&A, 360, 24
- Ptak et al. (1997) Ptak A., Serlemitsos P., Yaqoob T., Mushotzky R., Tsuru T., 1997, AJ, 113, 1286
- Read et al. (1997) Read A. M., Ponman T. J., Strickland D. K., 1997, MNRAS, 286, 626
- Sanders et al. (2003) Sanders D. B., Mazzarella J. M., Kim D.-C., Surace J. A., Soifer B. T., 2003, AJ, 126, 1607
- Sanders & Mirabel (1996) Sanders D. B., Mirabel I. F., 1996, ARA&A, 34, 749
- Smith et al. (2001) Smith R. K., Brickhouse N. S., Liedahl D. A., Raymond J. C., 2001, ApJ, 556, L91
- Strickland (2004) Strickland D., 2004, in Bergmann T. S., Ho L., Schmitt H., eds, IAU 222: The interplay among Black Holes, Stars and ISM in Galactic Nuclei Winds from Nuclear Starbursts: Old Truths and Recent Progress on Superwinds. CUP, Cambridge, pp 249–254
- Strickland et al. (2004) Strickland D. K., Heckman T. M., Colbert E. J. M., Hoopes C. G., Weaver K. A., 2004, ApJS, 151, 193
- Strickland & Stevens (2000) Strickland D. K., Stevens I. R., 2000, MNRAS, 314, 511
- Tenorio-Tagle & Muñoz-Tuñón (1997) Tenorio-Tagle G., Muñoz-Tuñón C., 1997, ApJ, 478, 134
- Tüllmann et al. (2006) Tüllmann R., Pietsch W., Rossa J., Breitschwerdt D., Dettmar R.-J., 2006, A&A, 448, 43
- Tully (1988) Tully R. B., 1988, Nearby galaxies catalog. Cambridge University Press, Cambridge and New York
- Tyler et al. (2004) Tyler K., Quillen A. C., LaPage A., Rieke G. H., 2004, ApJ, 610, 213
- Veilleux et al. (2005) Veilleux S., Cecil G., Bland-Hawthorn J., 2005, ARA&A, 43, 769
- Ward et al. (1978) Ward M. J., Wilson A. S., Penston M. V., Elvis M., Maccacaro T., Tritton K. P., 1978, ApJ, 223, 788
- Weaver et al. (2000) Weaver K. A., Heckman T. M., Dahlem M., 2000, ApJ, 534, 684
- Wood et al. (1984) Wood K. S., Meekins J. F., Yentis D. J., Smathers H. W., McNutt D. P., Bleach R. D., Friedman H., Byram E. T., Chubb T. A., Meidav M., 1984, ApJS, 56, 507
- Wright et al. (1994) Wright A. E., Griffith M. R., Burke B. F., Ekers R. D., 1994, ApJS, 91, 111