Imaging of the Stellar Population
of IC 10
with Laser Guide Star
Adaptive Optics
and the Hubble Space Telescope
Abstract
We present adaptive optics (AO), near-infrared images of the central starburst region of the Local Group dwarf irregular IC 10. The Keck 2 telescope laser guide star facility was used to achieve near diffraction limited performance at and with Strehl ratios of % and %, respectively. The images are centered on the putative Wolf-Rayet (W-R) object [MAC92] 24. Photometry from AO images can be subject to large systematic errors ( mag.) due to uncertainties in the point spread functions (PSFs) and the associated encircled energy curves caused by Strehl variations. However, IC 10 presents a rich star field, and therefore we are able to use the Fourier power spectrum method of Sheehy, McCrady and Graham (ApJ, 647, 1517) to reconstruct the photometric curve of growth from the data themselves, and thereby reduce the magnitude of the systematic errors in our photometry to mag. We combine our ground-based images with an F814W image obtained with the Hubble Space Telescope. By comparing the versus [F814W] color-magnitude diagram for the IC10 field with theoretical isochrones, we find that the stellar population is best represented by at least two bursts of star formation, one Myr ago and one significantly older ( Myr). The young, blue stars are centered around and concentrated in the vicinity of [MAC92] 24. We suggest that this population represents the resolved components of an OB association with a half-light radius of about 3 pc. We resolve the W-R object [MAC92] 24 itself into at least six blue stars. Four of these components have near-IR colors and luminosities that make them robust WN star candidates. By matching the location of Carbon stars in the color-magnitude diagram with those in the SMC we derive a distance modulus for IC 10 of about mag and a foreground reddening of . We find a more precise distance by locating the tip of the giant branch in the F814W, , and luminosity functions for IC 10. We find a weighted mean distance modulus . The systematic error in this measurement, due to a possible difference in the properties of the RGB populations in IC 10 and the SMC, is mag.
Subject headings:
galaxies: individual (IC 10) – galaxies: starburst – galaxies: star clusters1. Introduction
Above the turbulence of the earth’s atmosphere, and able to record near-diffraction-limited images, instruments aboard the Hubble Space Telescope (HST) have provided data that have driven the field of high resolution imaging of starburst galaxies (see, e.g., Whitmore, 2000, and references therein). While most of the work with HST has been done at ultraviolet and visible wavelengths, which are ideal for tracing hot, young stars, imaging and spectroscopy in the near-infrared (near-IR) is invaluable when there is substantial foreground or internal extinction or a large population of red supergiants. Because angular resolution at the diffraction limit scales linearly with wavelength and inversely with telescope diameter, the 2.5-m aperture of HST restricts its effectiveness in the near-IR. With the advent of adaptive optics (AO) facilities at ground-based, 4-m and 8-m class telescopes, it is now possible to acquire near-IR images with angular resolution superior to those from HST and the NICMOS instrument.
AO observations require the presence of either an artificial or natural guide star in the field of view. Such guide stars provide input to the tip-tilt and wavefront sensors and, in the case of a natural guide star, a straightforward means of determining the point-spread function (PSF) of the system. Examples of extragalactic studies using an AO system employing natural guide stars can be found in Davidge (2003) and references therein. Nevertheless, care must taken when using a natural guide star in the field to avoid saturation, persistence, and scattered light problems. Furthermore, in general, extragalactic fields selected for stellar population studies tend not to contain bright isolated stars.
With the deployment of laser guide star (LGS) techniques, the requirement for a bright natural guide star within the isoplanatic patch (a severe constraint when attempting to observe individual extragalactic sources such as nearby starburst galaxies) can be removed. The need for a tip-tilt guide star ( 17 mag.) within the isokinetic angle () remains because, by Fermat’s principle, a monochromatic laser beacon cannot be used to sense wavefront tilt. However, this constraint is much more easily satisfied, even when observing sources out of the Galactic plane.
In this paper we report LGS AO near-IR images of the central region of IC 10 obtained with the NIRC2 camera at the Keck Observatory. IC 10 is a nearby irregular starburst galaxy, often characterized as a blue compact dwarf (Richer et al., 2001), located on the outskirts of the Local Group. The physical properties of IC 10 are summarized in the review by Mateo (1998). IC 10 lies at low Galactic latitude and reliable values of the foreground reddening and distance have been elusive, with estimates ranging from 0.47 to 2.0 mag. for and from 22 to more than 27 mag. for the distance modulus. A summary of distance and reddening estimates for IC 10 can be found in Sakai et al. (1999) and Demers et al. (2004).
IC 10 is remarkable for its high star formation rate, as evidenced by its large number of H II regions (Hodge & Lee, 1990), H luminosity (Mateo, 1998), and far-IR luminosity (Melisse & Israel, 1994). Normalized to its H2 surface density, IC 10 has much higher rate of star formation than most spirals or dwarfs (Mateo, 1998; Leroy et al., 2006). IC 10 has a large population of Wolf-Rayet (W-R) stars (Massey et al., 1992; Massey & Armandroff, 1995), and the highest surface density of W-R stars among all Local Group galaxies (Massey & Armandroff, 1995). Furthermore, the ratio of carbon-type W-R’s (WC stars) to nitrogen-type W-R’s (WN stars) in IC 10 is unusually high for its metallicity of approximately 0.2-0.3 solar (Skillman et al., 1989; Garnett, 1990). These characteristics suggest that IC 10 has experienced a brief but intense galaxy-wide burst of star formation within the last Myr.
One of the most conspicuous sites of recent star formation in IC 10 is the HII region [HL90] 111c (Hodge & Lee, 1990). This region also harbors the brightest putative W-R star in the galaxy, [MAC92] 24, whose precise spectral type is uncertain. Richer et al. (2001) identified [MAC92] 24 as a WN star from the broad He II 4686 emission (and the lack of C IV emission) in its optical spectrum. Based on its He II 4686 equivalent width, Massey & Holmes (2002) classified this [MAC92] 24 as a WN star blended with another object. However, [MAC92] 24 was not recovered by Royer et al. (2001) in their emission line survey of this galaxy, possibly because their narrow band filters dedicated to W-R detection were contaminated by [O III] 5007 from [HL90] 111c. Crowther et al. (2003) subsequently noted that there were three closely-spaced sources, [MAC92] 24-A, B, and C, all located within of each other, that might be contributing to the spectrum recorded by Massey & Holmes (2002). They also suggested that this object might be an O3If WN star, a WN+OB binary, or a stellar cluster containing a WN star. The high stellar density in the vicinity of [MAC92] 24 is apparent from the HST/WFPC2 images reported by Hunter (2001) and Crowther et al. (2003): [MAC92] 24 lies at, or near the center of the young stellar cluster [H2001] 4-1 visually identified by Hunter (2001). The richness of this field, combined with the large foreground reddening, makes IC 10 a highly attractive target for high resolution study with near-IR laser-guide-star adaptive optics imaging techniques.
Our observations and data reductions are presented in §2. The results are presented in §3 and discussed in §4. A summary is given in §5.
2. Observations and Data Reduction
2.1. Near-Infrared Data
Near-infrared and images of IC 10, centered on [MAC92] 24 and approximately 10 arc sec E and 18 arc sec S of [HL90] 111c, were acquired with the NIRC2 camera on the Keck 2 telescope on 2005 November 10. These observations were obtained using the laser-guide star adaptive optics facility (Wizinowich et al., 2006; van Dam et al., 2006). The NIRC2 pupil stop was in the LARGEHEX position and the camera was operated in the narrow field mode, which yields a scale of per pixel and a field of view of . The Nyquist frequencies with this pupil stop on Keck 2 at and are 65 and and 50 arc sec-1, respectively, and therefore the images are well sampled.
Observing conditions were photometric according to data from the Mauna Kea all-sky monitor CONCAM111http://nightskylive.net/mk/, and the natural seeing was measured to be full-width at half maximum (FWHM) at . Analysis of the AO wavefront sensor telemetry indicated that the Fried parameter was cm and the outer scale was m at 500 nm. The airmass during the observations was about 1.3. The Na I D2 589.0 nm laser guide star, with an equivalent brightness of mag., was projected at the center of the science camera field of view; a bright star222USNO B1.0 1492-0009059, mag located due west from the center of the field was used to perform tip/tilt corrections. The total exposure times were s in (1.63 m) and s in (2.12 m), broken into four and five dithered images, respectively. Each image in the dithering sequence was separated from the previous one by .
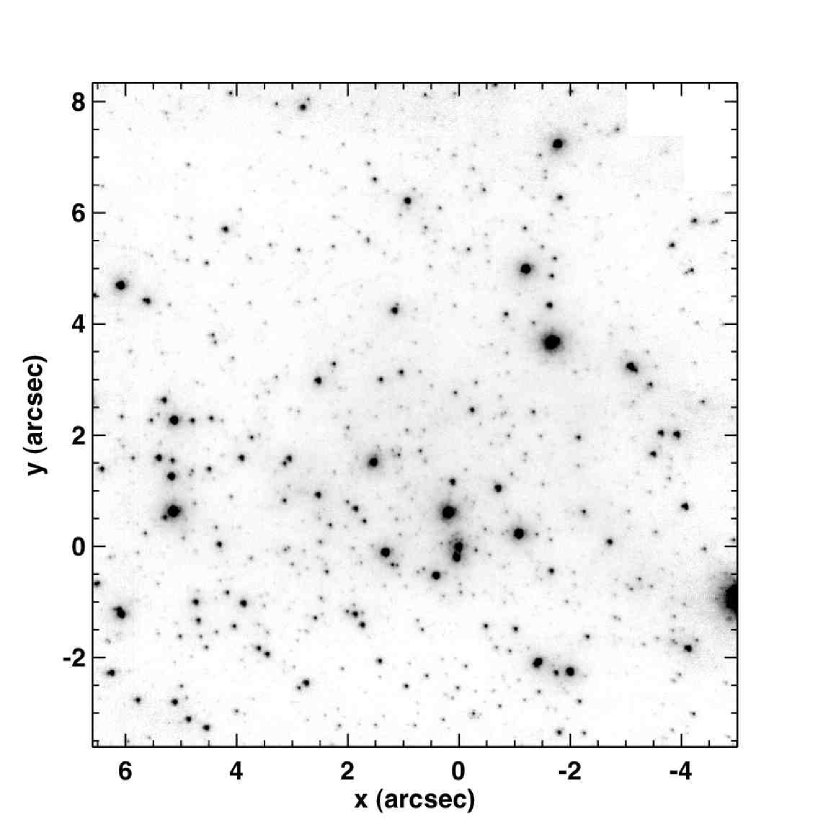
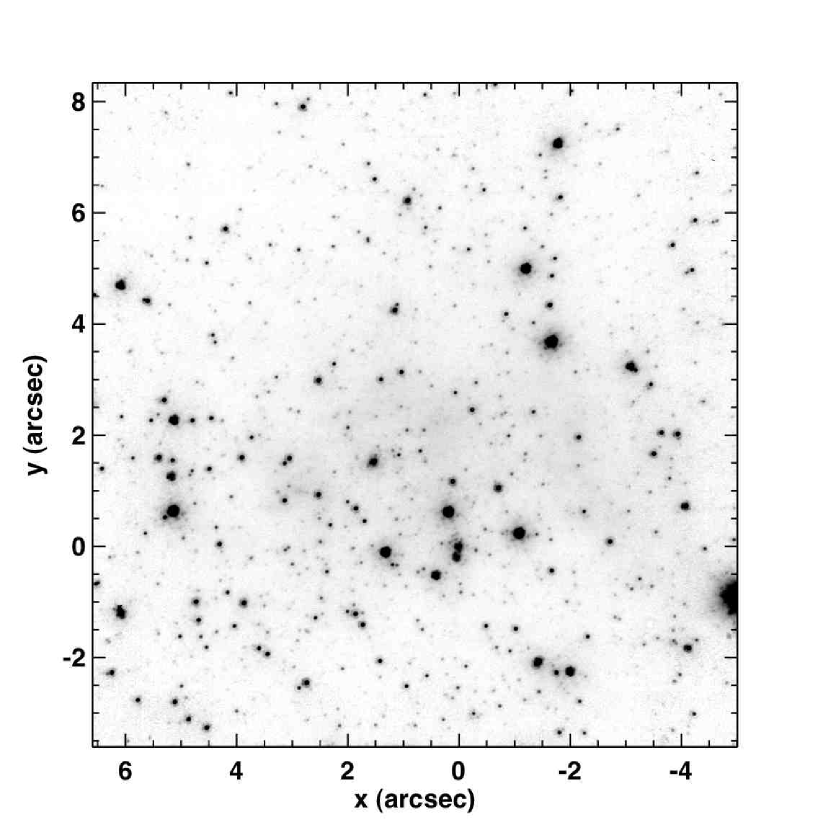
The raw images were reduced using our pipeline procedure for Lick and Keck near-IR AO imaging data, which is currently maintained at Berkeley by M. D. Perrin. The pipeline performs dark subtraction, flat fielding, bad pixel repair, and stacking of images to create the final mosaics. Flat-fields were generated from exposures of the interior of the dome obtained at the beginning of the night. Dome flats are preferable to twilight sky flats because they can be acquired with high signal-to-noise. The pupil illumination in the Keck 2/AO/NIRC 2 system is well controlled and comparison of dome and twilight sky flats shows only very small (negligible) differences, presumably due to color and polarization differences between the two sources. As the data are well sampled, bad pixels in each -s exposure were repaired by replacing them with interpolated values derived from their neighbors. The dark-subtracted, flat-fielded images were corrected for the known and previously mapped geometric distortion introduced by the NIRC2 camera, registered to a common coordinate frame, and combined. The resulting mosaic in each filter has a size of , and the image size is FWHM at and at . The final images are displayed in Figure 1.
Extracting photometry from the near-IR LGS AO images requires two distinct steps: 1) PSF-fitting, which establishes the relative brightness of stars; 2) analysis of the PSF to determine the photometric curve of growth. While conventional methods are satisfactory to establish relative photometry, measuring the photometric curve of growth needed to place AO measurements on an absolute scale requires special techniques. In a crowded field, relative photometry is best done using the narrow diffraction-limited core. However, this core may contain as little as 5–10% of the total light. The degree of AO correction is sensitive to the observing conditions (seeing, wind speed, brightness of the wavefront reference, etc.), and variations in these conditions causes variations in the amount of energy in the core of the PSF relative to the uncorrected seeing halo. This ratio, known as the Strehl ratio (), is exponentially sensitive to the variance of wavefront errors, and Strehl variations can be large; for moderate correction (Fitzgerald & Graham, 2006). As the fractional photometric error is approximately equal to , failure to measure and account for Strehl variations and the corresponding change in the curve of growth can introduce order of magnitude systematic errors in photometry. Therefore, it is desirable to estimate the PSF from the data themselves rather than from observations of a PSF star at another time. (This is a much more straightforward task in the case of natural guide star AO observations, when the guide star itself can be used to determine the PSF and measure the photometric curve of growth. See, e.g., Davidge & Courteau (1999); Davidge (2003).)
Sheehy et al. (2006) have shown that when the scene consists of a rich star field the photometric curve of growth for adaptively-corrected data can be extracted by modeling the power spectrum of the image. Modeling is performed in Fourier space and employs physical descriptions of the optical transfer functions (OTF) of the atmosphere, telescope, AO system, and science camera. Although the Fourier power spectrum of the image of a single star is proportional to , the power spectrum of a star field is given by the product of and the power spectrum of the spatial source distribution. Therefore, both the imaging system and the astronomical scene must be modeled. By comparing Keck 2 and HST/NICMOS data, Sheehy et al. (2006) established that this procedure reduces systematic errors in photometric measurements to the few percent level.
We have applied the OTF-fitting algorithms described in Sheehy et al. (2006) to the current data set with no modification. The fits to the and -band power spectra are shown in Figure 2. Note that the lowest wavenumbers are excluded from each fit in order to mitigate the effects of possible contamination of the power spectra by flat-fielding and sky subtraction errors, and extended (nebular) emission. Based on the uncertainties in the reconstruction of the photometric curves of growth (encircled energy curves), which are shown in Figure 3, we estimate that the systematic errors in the photometry are mag. in both bands. The reconstructed PSF implies that the Strehl ratios of the final mosaics are % in and % in .

We investigated PSF variations across the field of view by segmenting the final mosaics into a number of separate sub-regions, performing the analysis described above on each sub-region separately, and constructing the encircled energy curves for each region. Comparison of the results show variations of the aperture corrections of less than 5%. Furthermore, we find no systematic variation of the aperture correction with position in the field. These results agree with both visual inspection of the images, which reveals no significant astigmatism at the edges of the field, and other measurements of anisoplanatism in AO images obtained under typical seeing conditions at Mauna Kea (e.g., Davidge & Courteau, 1999; Davidge, 2003). Hence, we conclude that the isoplanatic angle was large for these observations and we neglected any PSF variations over the field of view in our analysis.

We established the photometric zero point using observations of the
UKIRT near-IR standard star FS6 (Hawarden et al., 2001), obtained
on the same night. We did not observe enough standards stars to
determine the atmospheric extinction coefficient from our data.
However, the and filters in NIRC2 are similar to those in use
at the IRTF, as they were produced as part of the Mauna Kea filter
consortium (see Tokunaga et al., 2002). Therefore, we have
used the nominal atmospheric extinction coefficients of 0.059 mag. airmass-1 and 0.088 mag. airmass-1 for and
respectively given on the IRTF web site333
http://irtfweb.ifa.hawaii.edu/$∼$nsfcam/hist/backgrounds.html;
see also
http://www.jach.hawaii.edu/UKIRT/astronomy/calib/phot_cal/cam_zp.html
to make the small corrections necessary to account for the small
difference in airmass between our science target and the standard
star.
We performed relative photometry by constructing an empirical PSF with a radius of from seven bright and relatively isolated stars in the field using DAOPHOT (Stetson, 1987). We then used the crowded field photometry package StarFinder (Diolaiti et al., 2000) to perform source detection and PSF fitting. Photometry resulting from PSF fitting returns the relative brightness and locations of the stars in the field of view, and therefore provides the information necessary to estimate the shape of the power spectrum of the source distribution.
We identified 661 stellar sources in the image and 585 sources in the image. For the brightest few stars, speckles in the PSF halo that lie outside the empirical PSF radius were erroneously identified as sources. As the location of speckles varies with wavelength, these spurious detections were easily identified and eliminated by hand. A variance map for each mosaic was constructed using the formulae given by Vacca et al. (2004) and supplied to StarFinder to calculate the internal photometric errors. The photometric errors returned by StarFinder are shown in Figure 4. Several discrete tracks are evident in this figure because the total exposure time, and hence the signal-to-noise ratio, is non-uniform across the mosaics. For example, the total exposure time for the central area of the five-point dither pattern was five times larger than that at the edges.
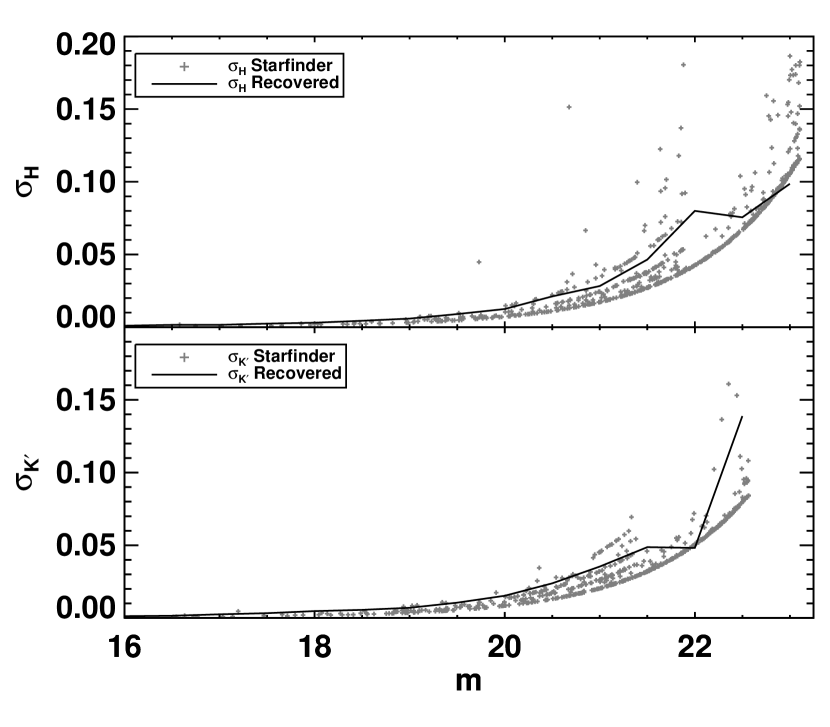
Photometric completeness limits were determined by inserting artificial stars of known magnitude into each mosaic and attempting to recover them. We performed this procedure for magnitudes between and in steps of mag. To accumulate good statistics without substantially increasing the crowding in the images, we restricted the number of stars inserted to and repeated the procedure five times for each magnitude bin. Figure 5 presents the resulting completeness as a function of magnitude. The limiting magnitudes are 22.3 and 21.5 in and , respectively, for a completeness threshold of 50% recovery. In order to test the photometric errors presented in Figure 4, we measured the difference between the input magnitudes and the recovered magnitudes for each artificial star. The width of the best-fit Gaussian to these residuals as a function of input magnitude is shown as the solid line in Figure 4. The agreement between the two error estimates is satisfactory.

We note that our near-IR photometry is substantially deeper and more accurate than that presented by Borissova et al. (2000). Our completeness limits are and mags deeper in and , respectively, and at any given magnitude, our internal errors are a factor of smaller. Of course, our field of view is considerably smaller ( arcmin2 vs. arcmin2).
2.2. HST Data
Optical imaging was obtained with the Wide Field Camera (WFC) of the Advanced Camera for Surveys (ACS) (Ford et al., 2003). Three F814W-band images were acquired as part of program GI-9683 (PI: Bauer) and were retrieved from the HST archives444ACS/WFC F435W and F606W images are also available in the archives as part of this program. We chose to use only the F814W data because the shorter wavelength images suffer from greater undersampling and greater sensitivity to foreground and internal extinction.. The total exposure time was 1080 s. We used the (calibrated individual exposure) and (calibrated, cosmic ray-split-combined image) files processed with the standard HST/ACS pipeline, which included corrections for the bias level, dark current, flat fielding, flux calibration and (for the files) cosmic ray rejection and image combining. The mean ACS/WFC pixel scale is approximately . Since the Nyquist frequency at this wavelength on HST is 30 arc sec-1, these data are undersampled.
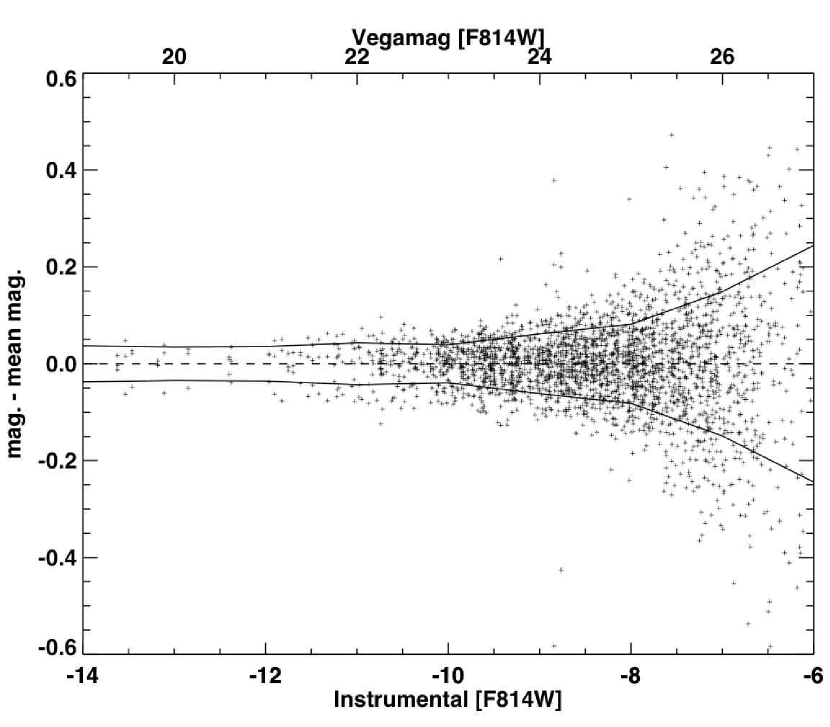
Photometry was performed using the software described by Anderson & King (2006). This code identifies sources on the images above a sky threshold, generates a spatially variable PSF for the specific filter, and fits it to each object detected on the image to yield a distortion-corrected instrumental magnitude and position. The PSF is normalized to have a flux of unity within a radius of 10 pixels, or . Although this code was developed for use on the images, we found only a small systematic difference (0.025 mag.) between the instrumental magnitudes derived from the images and those derived from the image. The latter has the advantage of eliminating many spurious sources due to detector artifacts and cosmic rays. Furthermore, this difference is well within the RMS error found by examining the scatter of the photometry derived from the three individual _flt images about the mean (Fig. 6). This comparison reveals that the uncertainties are mag. for objects brighter than mag.
Instrumental magnitudes were converted to a Vega-based system by adopting a zero-point of 25.501 mag. We shall refer to these as [F814W] magnitudes. We have not transformed these values to a ground-based system (e.g., Bessell & Brett, 1988). Restricting the analysis to stars within the NIRC2 field, we find sources brighter than mag. Our estimated 50% completeness limit is between 25 and 25.5 mag, for which we find sources.
Stars in the NIRC2 field were matched with stars in the ACS field using a nearest-neighbor algorithm. Detector coordinates of sources in the geometrically-distorted ACS frame were transformed into sky coordinates using the PyRAF555http://www.stsci.edu/resources/software_hardware/pyraf utility tran, and back into NIRC2 detector coordinates. As the pixel scale of the ACS/WFC is times coarser than that of the NIRC2 narrow camera and pixel mismatches may be large, we selected sources that had common centroids within a NIRC2 pixel radius (70 mas). To further prevent false associations in the automatically generated catalog, we restricted our matches to stars separated from one another by at least this distance in both individual catalogs. In the crowded region around [MAC92] 24 the threshold for matching was lowered and each potential match was inspected by hand before being added to the catalog. This procedure resulted in [F814W] colors for 380 stars.
3. Results
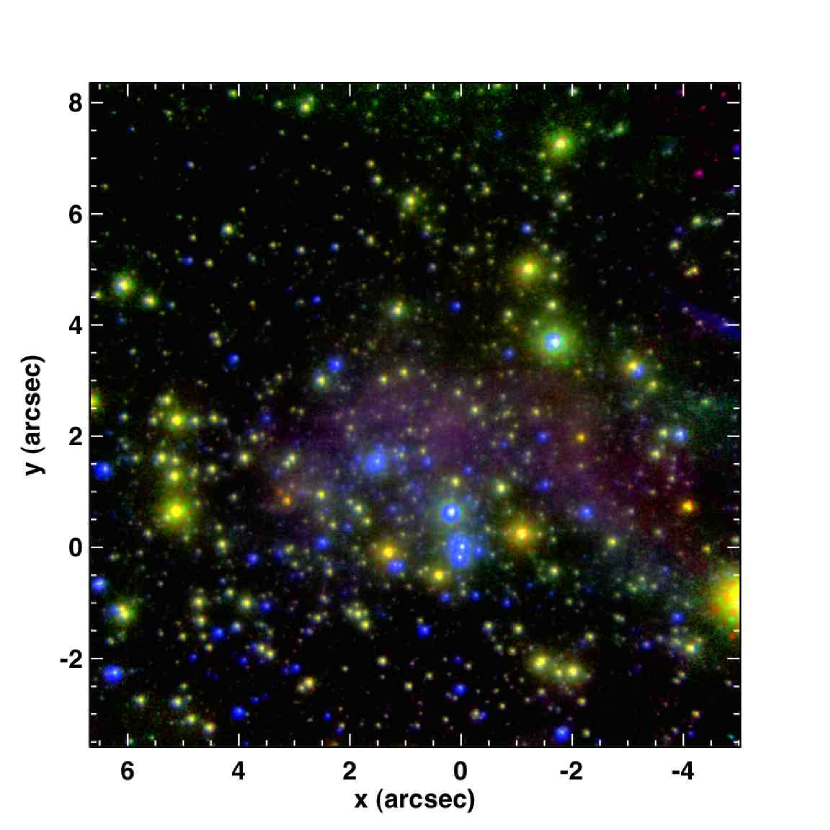
3.1. Three-Color Image
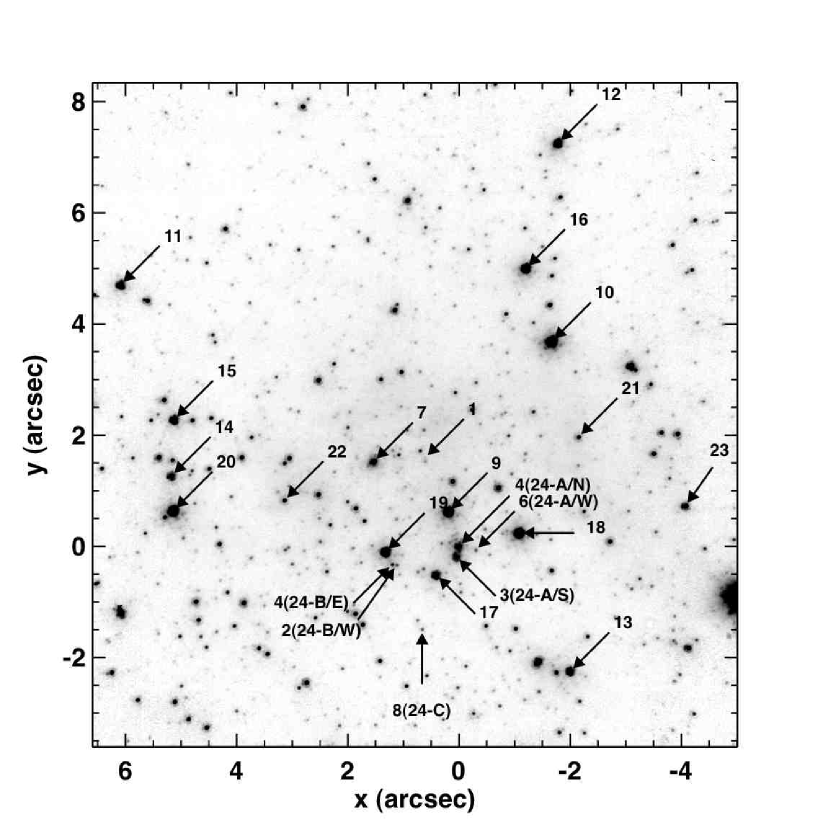
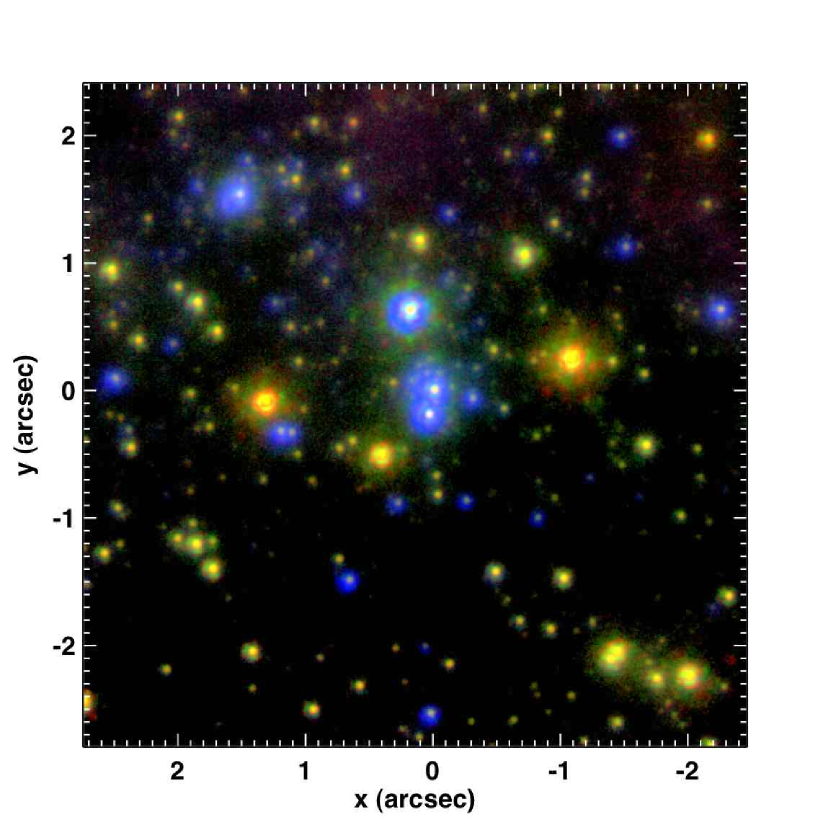
A three-color image of the IC 10 field, combining the F814W, , and data and produced using the algorithm described by Lupton et al. (2004), is shown in Figure 7. The Lupton et al. (2004) algorithm ensures that an object with a specified astronomical color has a unique color in the RGB image. The color image draws attention to the spatial distribution of the red and blue sequences that are evident in the color-magnitude diagram (CMD; see Fig. 10) and serves as a useful aid in the identification and discussion of individual sources. In Figure 8 we show an annotated version of the image of this field. We have labeled the brightest, bluest and reddest objects in the image, as well as other sources whose locations in the color-magnitude diagram are noteworthy. Photometry for these objects is listed in Table 1.
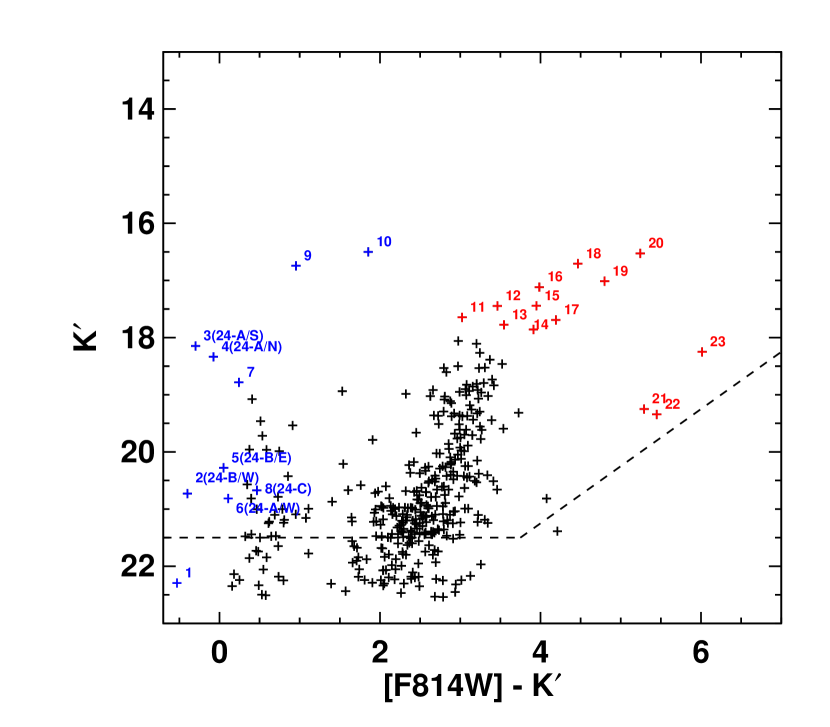
3.2. The Color-Magnitude Diagram
From our photometric catalog we generated the [F814W], , and luminosity functions as well as the versus [F814W] CMD. The former are shown in Figure 9 while the latter appears in Figure 10. Two distinct sequences are populated in the CMD: a vertical band of blue stars with [F814W] mag., which are most likely reddened main sequence objects, and a well-populated plume of red stars with in the range 2–3.5 mag. In addition there are several very red objects with [F814W] mag.
We estimated the contamination of foreground Galactic stars in our CMDs using the Galactic models of Cohen (1994). Although IC 10 is at low Galactic latitude, foreground contamination is not severe in such a small field. In band, we find that we expect about 0.01 stars arcsec-2 brighter than 18 mag., 0.025 stars arcsec-2 brighter than 20 mag., and 0.048 stars arcsec-2 brighter than 22 mag. These stellar surface densities correspond to 1, 4, and 7 stars, respectively, in our NIRC2 field. Similar values are found for the band. Thus, above our 50% completeness limit we suffer about 1% contamination. The contaminating stars are expected to be main sequence dwarfs, and therefore should have moderately red colors with in the range 0.8–2.2 mag. We do not expect that any of the blue stars ( mag.) or any of the extremely red stars ( mag.) are foreground objects. Two bright ( mag.) stars, labeled 9 and 10 in Figure 10, have the colors of foreground dwarfs. However, the close spatial association of star 9 with [MAC92] 24 suggests that it is a reddened supergiant in IC 10, with an initial main sequence mass of . The status of star 10 is uncertain.
We also investigated possible contamination by background galaxies. Based on the galaxy counts given by Kochanek et al. (2001) and Drory et al. (2001) and the size of our fields, we would expect to find less than one background galaxy in our band image down to our 50% completeness limit of 21.5 mag. This agrees with our finding that most of the objects in our image are point-like (see below).

The metallicity of the SMC is close to that of IC 10, and therefore this nearby system forms a natural template against which IC 10 can be compared. We used the 2MASS and DENIS photometric catalogs for the SMC provided by Zaritsky et al. (2002) for this task. We transformed the 2MASS magnitudes to the NIRC2/MKO system using the relations given in Carpenter (2001) along with an estimate of the conversion between and filter magnitudes as a function of color666. This relation was derived using the method of Wainscoat & Cowie (1992), based on the central wavelengths of our filters. We used the relations given by Sirianni et al. (2005) to convert Cousins band magnitudes given by Zaritsky et al. (2002) to HST/ACS/WFC [F814W]. Cioni et al. (2006) identify C-rich and O-rich asymptotic giant branch (AGB) stars in the SMC based upon their and photometry in the DENIS and 2MASS catalogs. Using their criteria for partitioning the versus CMD into regions of distinct stellar types, we identified AGB stars in the versus CMD of Zaritsky et al. (2002) and carried the divisions over to the versus CMD. The O-rich and C-rich AGB stars in the SMC sample are plotted in Figure 11 as magenta and red points, respectively. The rest of the SMC stars, including the red giant branch, are plotted as green points. We assumed a distance modulus to the SMC of mag. and a reddening of mag. for consistency with Cioni et al. (2000).
To compare the SMC and IC 10 CMDs directly (in the same figure), it is necessary to adopt a foreground reddening and a distance modulus for IC 10. After experimenting with a range of values found in the literature (see Demers et al., 2004), we found that a good match between the SMC and the IC 10 distributions could be achieved with a foreground reddening of mag. and a distance modulus of 24.5 mag. The reddening is determined primarily by matching the color of the red giant branch (cf. Sakai et al., 1999). If we focus on the less abundant blue stars, and attempt to match their location in the CMD with that of the very top of the main sequence in the SMC distribution, we find that a somewhat smaller reddening value of mag. is preferred. This estimate has a large uncertainty, however, given the small number of blue main-sequence stars above the completeness limits in both the IC 10 and SMC samples. We note that IC 10 has abundant molecular clouds (Leroy et al., 2006) and there is ample evidence for substantial internal reddening. The differential extinction between the blue and red stars may indicate that the blue stars lie on the front face of IC 10, in a region that has been cleared of gas and dust by the O-star winds and supernovae associated with the star formation activity evident in the vicinity of [HL90] 111c.
The comparison with the SMC indicates that the red population in IC 10 comprises both red giants and AGB stars. There are two branches of very red ( mag.) stars found in our IC 10 field. C-rich AGB stars comprise the bright branch. Highly evolved AGB stars with optically thick circumstellar dust envelopes populate the dim branch. Additional red stars between = 20 and 22 mag. are undoubtedly present, but the lower right corner of the CMD is unpopulated due to incompleteness in the F814W measurements.
We have identified red supergiants (RSGs) in the Zaritsky et al. (2002) catalog of SMC stars and plotted them on Figure 11. We began with the list of spectroscopically-confirmed Magellanic Clouds RSGs from Massey & Olsen (2003). Cross-correlation of the coordinates and and magnitudes of these RSGs with objects in the Zaritsky et al. (2002) catalog yielded their location in the [F814W] versus [F814W]- CMD. This exercise indicates that there are no unambiguous RSGs within our field of view, except for perhaps the bright star located on the southwest edge of the frame for which we did not attempt to perform photometry.
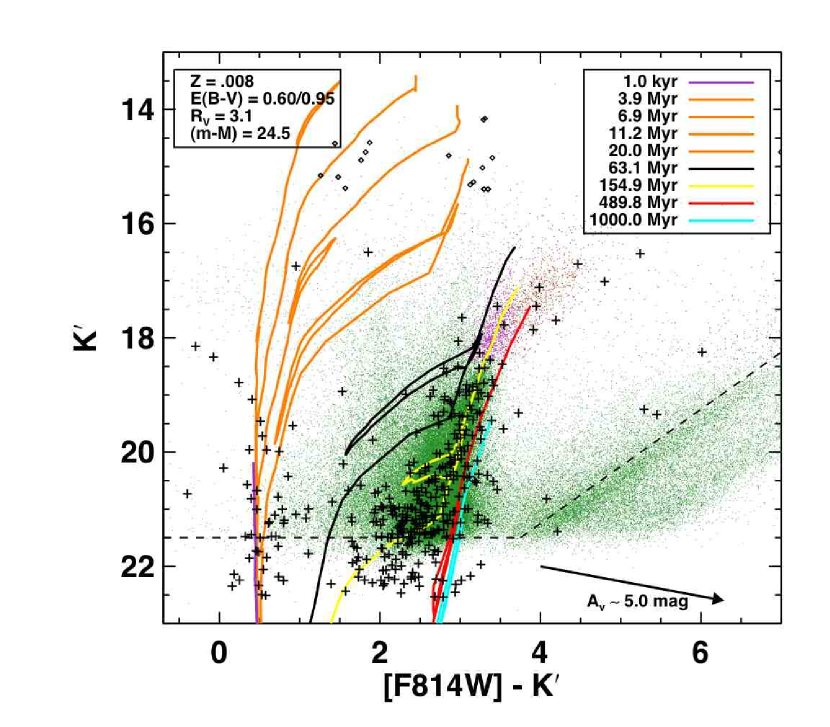
In Figure 11 we have overlaid theoretical stellar isochrones for from Lejeune & Schaerer (2001) on our observed CMD. The oxygen abundance in IC 10 in HII regions corresponds to () (Skillman et al., 1989; Garnett, 1990). Thus, one would expect that tracks of Lejeune & Schaerer (2001) would be most suitable for such a comparison. However, as found by Hunter (2001), the more metal-rich isochrones extend farther to the red than the isochrones do and so encompass the observed location of red supergiants. These tracks also better match the observed integrated colors of star clusters in IC 10 (Hunter, 2001). We converted the WFPC2 F814W magnitudes given by Lejeune & Schaerer (2001) to the ACS/WFC F814W band using the prescription given by Sirianni et al. (2005). The Bessell & Brett (1988) and band magnitudes given by Lejeune & Schaerer (2001) were converted to the NIRC2/MKO system using the transformations given by Carpenter (2001), along with the aforementioned correction between the an filter magnitudes as a function of color. We shifted the isochrones to correspond to a distance modulus of 24.5. We also reddened the isochrones, with the adopted reddening value dependent on the corresponding age of each isochrone. This was done in order to account for the differing reddening values found above for the red and blue stars. For ages of Myr, we found that a reddening value of mag. yields a good match between the theoretical main sequence given by the models and the location of the blue stars in the IC 10 CMD. This reddening value is somewhat lower than the foreground extinction of mag. recommended by Massey et al. (1992) and Richer et al. (2001), but is perhaps preferable given the large wavelength baseline afforded by the current measurements. In addition, it agrees well with the results found above for the respective reddenings of the blue and red stars determined from comparison of the IC 10 and SMC CMDs. For isochrones corresponding to ages older than 20 Myr we applied a reddening of mag., as determined from our comparison of the locations of the red stars in the SMC and IC 10 CMDs.
The comparison between our data and the isochrones indicates that the [MAC92] 24 region of IC 10 comprises two separate stellar populations: one group of blue main-sequence stars and a few blue supergiants, younger than about 10–20 Myr, and a second group of red giants and AGB stars with ages between 150 and 500 Myr. This dichotomy suggests that the recent starburst that produced the W-R stars in [MAC92] 24 sits atop an older field population. The comparison with the isochrones draws attention to several stars that are much redder than predicted by the theoretical models. As noted above, the bright objects are C-stars, while the fainter objects are probably highly evolved AGB stars close to their final luminosity, but extinguished by optically thick, dusty circumstellar envelopes.
3.3. Tip of the Red Giant Branch Distance
The qualitative comparison between the CMDs for the SMC and IC 10 indicates a distance modulus of about 24.5 mag (see §3.2). A quantitative approach to matching the two CMDs using the two-dimensional Kolmogorov-Smirnov test (Fasano & Franceschini, 1987) proved unsatisfactory because the results were strongly biased by the incompleteness of the two photometric catalogs. However, we can refine the distance estimate by using the tip of the red giant branch (TRGB) method (Lee et al., 1993). The TRGB marks a strong break in the luminosity function of the Magellanic Clouds at mag. and provides a readily identifiable fiducial point for distance measurements.
We adopted an empirical approach, comparing the TRGB brightness levels in the SMC and IC 10 data sets to derive a relative distance modulus between the two systems. We followed the method developed by Cioni et al. (2000) to estimate the location of the TRGB from the [F814W], , and luminosity functions in these two systems. The luminosity functions and their second derivatives, from which the location of the TRGB is determined, are shown in Figure 9. Considered individually, the second derivatives of the F814W], , and luminosity functions for IC 10 seem noisy, and the choice of which peak corresponds to the TRGB ambiguous. However, simultaneous consideration of all three wavelengths reveals that there is a common feature relative to the SMC TRGB (bottom panel of Fig. 9) corresponding to a unique relative distance modulus. Combining the differential distance moduli from the [F814W], , and luminosity functions, using a weighted mean, and correcting for the fact that the uncertainty in the extinction correction introduces covariance between these measurements, we find mag., where we have used the distance and reddening to the SMC adopted in §3.2. Because we adopted a large uncertainty in the reddening towards IC 10 ( mag.), the -band TRGB brightness is strongly weighted in this result. Since the -band TRGB brightness is sensitive to variations in age and metallicity, our distance estimate is subject to systematic errors resulting from any differences in the properties of the red stellar populations between IC 10 and the SMC. In order to estimate this systematic error, we used the results given by Montegriffo et al. (1998) for population II giants to determine the possible systematic uncertainty in the -band TRGB mag arising from the width of the [F814W] color of the red giant branch in our CMD for IC 10. Assuming that the bolometric luminosity at the TRGB is constant and adopting the calibration for population II giants of Montegriffo et al. (1998), we find that any differences in the the [F814W] color of the red giant branches between the SMC and IC 10 should produce a systematic error in the true distance modulus of no more than mag. This value includes the uncertainty in the reddening, .
We note that our reddening and distance estimates are in good agreement with those determined by Saha et al. (1996) and Wilson et al. (1996) from an analysis of Cepheid data. Our reddening estimate is about 20% smaller and our distance is 20% larger than the values estimated by Sakai et al. (1999), who also used Cepheids for their determinations.
3.4. Wolf-Rayet Stars and Young Clusters
An enlargement () of the region surrounding [MAC92] 24 is provided in Fig. 12. This figure can be compared directly with the WFPC2/F555W image shown by Crowther et al. (2003). Our observations resolve the W-R source [MAC92] 24-A into at least three components, two of which (24-A/N and 24-A/S) have nearly equal brightness and blue colors (); a third component, 24-A/W ( W and S of 24-A/N), is significantly fainter but is also blue (). The sources [MAC92] 24-A/N and S are the brightest blue objects in the versus [F814W]- CMD (Fig. 11). Their observed colors and magnitudes place them above and to the left of the reddened main sequence; their extinction-corrected near-IR colors ( mag.; mag.) and -band luminosities ( mag.) are consistent with their being late-type WN (WN7–9) stars (e.g., Crowther et al., 2006). If [MAC92] 24-A/N and S are indeed late-type WN stars, they should have relatively weak lines, which may explain both their absence from the emission-line survey of Royer et al. (2001) and the weakness of the He II emission detected by Massey & Holmes (2002) in the spectrum of the blended object observed under seeing-limited conditions. The W-R candidate [MAC92] 24-B is also resolved into two blue sources, oriented east-west. The individual components of [MAC92] 24-B have colors similar to those of [MAC92] 24-A/N and S, but are about 2 mag. dimmer, which makes them candidate early-type WN stars. Based on its color and magnitudes, [MAC92] 24-C appears to be a late O V star. High spatial resolution spectroscopy is needed to confirm our proposed spectral types for the various components of [MAC92] 24.
The abundance of W-R stars relative to O stars is a strong function of time; for an instantaneous burst of star formation and a Salpeter IMF extending to 100 , the W-R/O ratio is only between 3.8–4.7 Myr (Leitherer et al., 1999). Our W-R candidates are drawn from a list of 29 blue stars brighter than the mag expected for a B0V star at the distance and reddening of IC 10. Therefore, it would not be surprising if our four robust W-R candidates were confirmed spectroscopically to be WN stars. The corollary is that we can state with confidence that massive star formation in the [HL90] 111c region was active as recently as four Myr ago.
If our proposed W-R candidates are confirmed spectroscopically, the WC/WN ratio in IC 10 would drop from 1.2–1.3 (Massey & Holmes, 2002; Crowther et al., 2003) to . While this value is still anomalously high, given the low metallicity of IC 10, our results suggest that there may be a number of WN stars yet to be discovered in the rich stellar fields associated with the regions of recent star formation in this galaxy.
In addition to the stars we have discussed above, there is also a handful of fainter blue objects clustered within around [MAC92] 24-A/N. The concentration of luminous blue stars in the region suggests that the [MAC92] 24 complex could be considered a resolved stellar cluster, as originally suggested by Hunter (2001) based on inspection of WFPC2 data. Comparison of the relative spatial distributions of blue and red stars, as revealed by our F814W and near-IR data and shown in Fig. 13, considerably strengthens this proposal. In this figure we have divided the stellar population into “red” and “blue” samples based on their locations relative to the 10 Myr isochrone in the CMD (Figure 11). To account for photometric errors we also include in the blue sample those stars that lie redward of this isochrone within a swath of width equal to that of the uncertainty in the color.
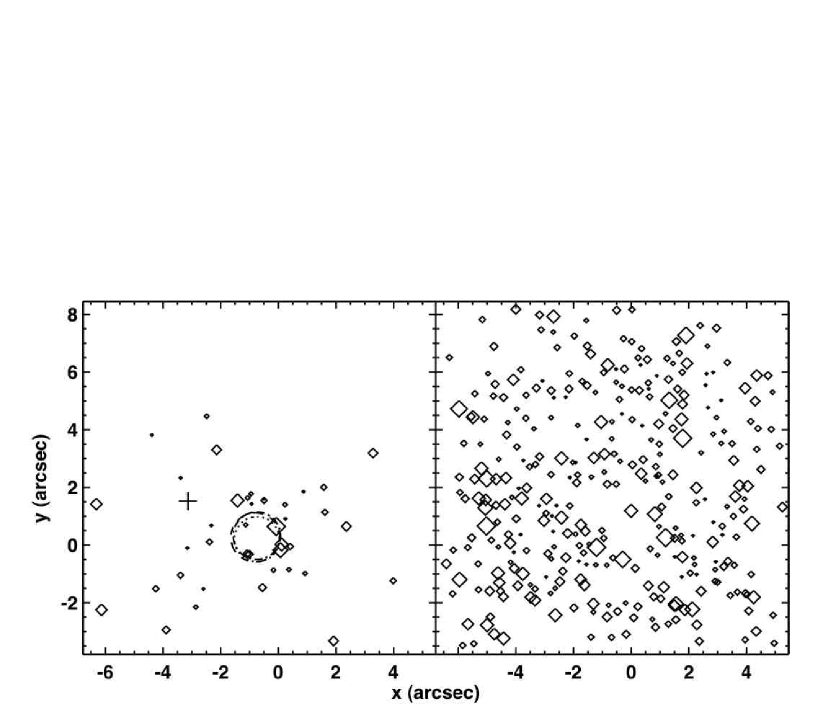
With this definition, the red stars appear to be far more uniformly distributed across the field than the blue stars, which are concentrated around a position centered near [MAC92] 24 A and clearly delineate a stellar cluster. For stars with ages Myr, the luminosity weighted centroid is located E of [MAC92] 24-A/N, and the half-light radius is (3.2 pc) in all three bands. The integrated magnitudes within the half-light radii of the cluster are [F814W] = 17.07 mag., = 16.71 mag., and = 16.48 mag. The half-light radius grows steadily with the age cut-off. For an age of Myr we find half-light radii of (4.7 pc) in F814W and an integrated magnitude of [F814W] = 16.47 mag., which is in good agreement with the measurements of Hunter (2001).
Based on PSF fitting, only one source in our field has a spatial profile that is significantly more extended than that of a point source. This object is identified as number 7 in Figures 8 and 10. From its deconvolved FWHM we infer a size of only (0.2 pc). It is therefore probably too small to qualify as a cluster and is more likely an unresolved association of a few massive stars.
3.5. Nebular Emission
The three-color image (Fig. 7) reveals a swath of diffuse emission, whose extent and location correlate extremely well with that seen in the archival WFPC2/F656N image of this field. As F656N traces H 6563 we believe that this extended component represents recombination emission from ionized gas. This suggestion is supported by the morphology of the emission, which appears to form an arc around [MAC92] 24. The emission in the and bands is likely a combination of free-free, bound-free and Brackett lines. Although the F814W filter excludes H 6563 and [NII] 6547, 6583, it does include [S II] 6716, 6731, [S III] 9069, 9532 and the series Paschen limit. We estimated the flux of this diffuse component from our star-subtracted images; we find fluxes of , , and mJy in the F814W, , and bands, respectively.
In ionization equilibrium the observed nebular flux is approximately proportional to the Lyman continuum flux and therefore can be used to place a constraint on the number of hot stars. In order to determine the conversion between the nebular emission and the Lyman continuum flux, we used the MAPPINGS 3 code (Sutherland & Dopita, 1993) to construct the nebular emission spectrum from an ionization-bounded HII region excited by a source with a color temperature of 30,000 K. We find that a source that produces ionizing photons per second at a distance yields equivalent flux densities of 6.8, 3.3 and 4.3 mJy in the F814W, and filters, respectively.
Our measurements imply a total ionizing flux of s-1, where we have adopted our previously measured extinction to the blue stars of mag. With the effective temperature and ionizing flux calibrations of Heap et al. (2006) for O stars in the SMC cluster NGC 346, we find that this ionizing flux corresponds to 50–100 SMC O6.5V stars. With an age of about 3 Myr and a metallicity of about one fifth solar, the young SMC cluster NGC 346 is an appropriate and useful analog for the [MAC92] 24 region. Conversion from to a total number of O stars requires assumptions about the age and initial mass function of the stellar population. We again used the results of Heap et al. (2006) for the O stars in NGC 346 and fit the ionizing flux as a function of evolutionary mass in order to estimate the ratio (see Vacca, 1994). For a Salpeter IMF with O star masses between 20 and 85 , we find that this ratio has a value of approximately 2. This indicates that 30–50 SMC-like main sequence O-type stars are needed to power the nebular emission seen in our image of the [MAC92] 24 region of IC 10. The ratio depends on the mass range used; if the upper mass limit is reduced to 40 , then the ratio drops to about unity. Fig. 10 reveals blue stars bright enough to be O8 stars or earlier ( mag.). Four of these stars are WN candidates. The correspondence between the expected and observed number of hot stars is satisfactory, given the potential for systematic errors in estimating the nebular emission from broad-band filters and the uncertainties in our analysis. This agreement suggests that we have identified the dominant source of the ionizing flux in the region.
4. Conclusions
We have combined ground-based laser guide star adaptive optics and Hubble Space Telescope imaging of the local group dwarf starburst galaxy IC 10 to yield a high resolution view of the stellar population. These data resolve the Wolf-Rayet candidate [MAC92] 24 into multiple components. The object [MAC92] 24A is found to be composed of at least three bright, blue sources while the object [MAC92] 24 B is similarly resolved into two blue sources. The luminosities and colors of these component sources are consistent with their being massive hot stars and we propose that there are at least four robust WN candidates in the field. Integral field AO spectroscopy will be necessary to confirm the status of these objects.
The versus CMD generated from our data exhibits a morphology similar to that found for the SMC, which has a similar metallicity. Comparison of the IC 10 CMD with theoretical isochrones indicates that star formation in the vicinity of [MAC92] 24 has generated two distinct stellar populations, one relatively young ( Myr) and one substantially older (150–500 Myr). A clear spatial segregation between the young blue stars (W-R stars and main-sequence OB stars) and the older, red stellar population is apparent in our images. The blue stars in our IC 10 field are clustered into a distinct OB association with a half light radius of about 3 pc. The ionizing flux from this resolved young population is responsible for a large fraction of the nebular continuum observed in this region. The red stars, comprising red giants, O- and C-rich asymptotic giant branch stars and highly evolved stars with thick circumstellar envelopes, are much more uniformly distributed. Spatial segregation also occurs along the light of sight, with a differential reddening of of about 0.4 mag. between the red and the blue populations. The column of neutral gas in IC 10 towards this direction is cm-2 (Wilcots & Miller, 1998; Leroy et al., 2006). Thus, the blue stars, with mag., appear to be on the front surface of IC 10, while the red stars, which have mag., probe a significant fraction of the column depth of the IC 10 interstellar medium.
Finally, comparison of the luminosity functions for red stars in IC 10 and the SMC yields a tip-of-the giant branch distance to IC 10 of mag. with a systematic uncertainty of mag.
References
- Anderson & King (2006) Anderson, J. & King, I. R. 2006, PSFs, Photometry, and Astrometry for the ACS/WFC (ISR 06-01) (Space Telescope Science Institute, Baltimore)
- Bessell & Brett (1988) Bessell, M. S. & Brett, J. M. 1988, PASP, 100, 1134
- Borissova et al. (2000) Borissova, J., Georgiev, L., Rosado, M., Kurtev, R., Bullejos, A., & Valdez-Gutiérrez, M. 2000, A&A, 363, 130
- Carpenter (2001) Carpenter, J. M. 2001, AJ, 121, 2851
- Cioni et al. (2006) Cioni, M.-R. L., Girardi, L., Marigo, P., & Habing, H. J. 2006, A&A, 452, 195
- Cioni et al. (2000) Cioni, M.-R. L., van der Marel, R. P., Loup, C., & Habing, H. J. 2000, A&A, 359, 601
- Cohen (1994) Cohen, M. 1994, AJ, 107, 582
- Crowther et al. (2003) Crowther, P. A., Drissen, L., Abbott, J. B., Royer, P., & Smartt, S. J. 2003, A&A, 404, 483
- Crowther et al. (2006) Crowther, P. A., Hadfield, L. J., Clark, J. S. Negueruela, I., & Vacca, W. D. 2006, MNRAS, 00, 000
- Davidge (2003) Davidge, T. J. 2003, PASP, 115, 635
- Davidge & Courteau (1999) Davidge, T. J. & Courteau, S. 1999, AJ, 117, 1297
- Demers et al. (2004) Demers, S., Battinelli, P., & Letarte, B. 2004, A&A, 424, 125
- Diolaiti et al. (2000) Diolaiti, E., Bendinelli, O., Bonaccini, D., Close, L., Currie, D., & Parmeggiani, G. 2000, A&AS, 147, 335
- Drory et al. (2001) Drory, N., Feulner, G., Bender, R., Botzler, C. S., Hopp, U., Maraston, C., Mendes de Oliveira, C., & Snigula, J. 2001, MNRAS, 325, 550
- Fasano & Franceschini (1987) Fasano, G. & Franceschini, A. 1987, MNRAS, 225, 155
- Fitzgerald & Graham (2006) Fitzgerald, M. P. & Graham, J. R. 2006, ApJ, 637, 541
- Ford et al. (2003) Ford, H. C., Clampin, M., Hartig, G. F., et al. 2003, in Future EUV/UV and Visible Space Astrophysics Missions and Instrumentation. Edited by J. Chris Blades, Oswald H. W. Siegmund. Proceedings of the SPIE, Volume 4854, pp. 81-94 (2003)., ed. J. C. Blades & O. H. W. Siegmund, 81–94
- Garnett (1990) Garnett, D. R. 1990, ApJ, 363, 142
- Hawarden et al. (2001) Hawarden, T. G., Leggett, S. K., Letawsky, M. B., Ballantyne, D. R., & Casali, M. M. 2001, MNRAS, 325, 563
- Heap et al. (2006) Heap, S. R., Lanz, T., & Hubeny, I. 2006, ApJ, 638, 409
- Hodge & Lee (1990) Hodge, P. & Lee, M. G. 1990, PASP, 102, 26
- Hunter (2001) Hunter, D. A. 2001, ApJ, 559, 225
- Kochanek et al. (2001) Kochanek, C. S., Pahre, M. A., Falco, E. E., Huchra, J. P., Mader, J., Jarrett, T. H., Chester, T., Cutri, R., & Schneider, S. E. 2001, ApJ, 560, 566
- Lee et al. (1993) Lee, M. G., Freedman, W. L., & Madore, B. F. 1993, ApJ, 417, 553
- Leitherer et al. (1999) Leitherer, C., Schaerer, D., Goldader, J. D., Delgado, R. M. G., Robert, C., Kune, D. F., de Mello, D. F., Devost, D., & Heckman, T. M. 1999, ApJS, 123, 3
- Lejeune & Schaerer (2001) Lejeune, T. & Schaerer, D. 2001, A&A, 366, 538
- Leroy et al. (2006) Leroy, A., Bolatto, A., Walter, F., & Blitz, L. 2006, ApJ, 643, 825
- Lupton et al. (2004) Lupton, R., Blanton, M. R., Fekete, G., Hogg, D. W., O’Mullane, W., Szalay, A., & Wherry, N. 2004, PASP, 116, 133
- Massey & Armandroff (1995) Massey, P. & Armandroff, T. E. 1995, AJ, 109, 2470
- Massey et al. (1992) Massey, P., Armandroff, T. E., & Conti, P. S. 1992, AJ, 103, 1159
- Massey & Holmes (2002) Massey, P. & Holmes, S. 2002, ApJ, 580, L35
- Massey & Olsen (2003) Massey, P. & Olsen, K. A. G. 2003, AJ, 126, 2867
- Mateo (1998) Mateo, M. L. 1998, ARA&A, 36, 435
- Melisse & Israel (1994) Melisse, J. P. M. & Israel, F. P. 1994, A&A, 285, 51
- Meurer et al. (1995) Meurer, G. R., Heckman, T. M., Leitherer, C., Kinney, A., Robert, C., & Garnett, D. R. 1995, AJ, 110, 2665
- Montegriffo et al. (1998) Montegriffo, P., Ferraro, F. R., Origlia, L., & Fusi Pecci, F. 1998, MNRAS, 297, 872
- Richer et al. (2001) Richer, M. G., Bullejos, A., Borissova, J., McCall, M. L., Lee, H., Kurtev, R., Georgiev, L., Kingsburgh, R. L., Ross, R., & Rosado, M. 2001, A&A, 370, 34
- Royer et al. (2001) Royer, P., Smartt, S. J., Manfroid, J., & Vreux, J.-M. 2001, A&A, 366, L1
- Saha et al. (1996) Saha, A., Hoessel, J. G., Krist, J., & Danielson, G. E. 1996, AJ, 111, 197
- Sakai et al. (1999) Sakai, S., Madore, B. F., & Freedman, W. L. 1999, ApJ, 511, 671
- Sheehy et al. (2006) Sheehy, C. D., McCrady, N., & Graham, J. R. 2006, ApJ, 647, 1517
- Sirianni et al. (2005) Sirianni, M., Jee, M. J., Benítez, N., Blakeslee, J. P., Martel, A. R., Meurer, G., Clampin, M., De Marchi, G., Ford, H. C., Gilliland, R., Hartig, G. F., Illingworth, G. D., Mack, J., & McCann, W. J. 2005, PASP, 117, 1049
- Skillman et al. (1989) Skillman, E. D., Kennicutt, R. C., & Hodge, P. W. 1989, ApJ, 347, 875
- Stetson (1987) Stetson, P. B. 1987, PASP, 99, 191
- Sutherland & Dopita (1993) Sutherland, R. S. & Dopita, M. A. 1993, ApJS, 88, 253
- Tokunaga et al. (2002) Tokunaga, A. T., Simons, D. A., & Vacca, W. D. 2002, PASP, 114, 180
- Vacca (1994) Vacca, W. D. 1994, ApJ, 421, 140
- Vacca et al. (2004) Vacca, W. D., Cushing, M. C., & Rayner, J. T. 2004, PASP, 116, 352
- van Dam et al. (2006) van Dam, M. A., Bouchez, A. H., Le Mignant, D., Johansson, E. M., Wizinowich, P. L., Campbell, R. D., Chin, J. C. Y., Hartman, S. K., Lafon, R. E., Stomski, Jr., P. J., & Summers, D. M. 2006, PASP, 118, 310
- Whitmore (2000) Whitmore, B. C. 2000, astro-ph/0012546
- Wilcots & Miller (1998) Wilcots, E. M. & Miller, B. W. 1998, AJ, 116, 2363
- Wilson et al. (1996) Wilson, C. D., Welch, D. L., Reid, I. N., Saha, A., & Hoessel, J. 1996, AJ, 111, 1106
- Wizinowich et al. (2006) Wizinowich, P. L., Le Mignant, D., Bouchez, A. H., Campbell, R. D., Chin, J. C. Y., Contos, A. R., van Dam, M. A., Hartman, S. K., Johansson, E. M., Lafon, R. E., Lewis, H., Stomski, P. J., Summers, D. M., Brown, C. G., Danforth, P. M., Max, C. E., & Pennington, D. M. 2006, PASP, 118, 297
- Zaritsky et al. (2002) Zaritsky, D., Harris, J., Thompson, I. B., Grebel, E. K., & Massey, P. 2002, AJ, 123, 855
| ID | Name | [F814W] | ||||
|---|---|---|---|---|---|---|
| (arcsec) | (arcsec) | (mag.) | (mag.) | (mag.) | ||
| 1 | +0.612 | +1.590 | 21.76 | 22.61 | 22.29 | |
| 2 | (24-B/W) | +1.121 | –0.337 | 20.33 | 20.89 | 20.73 |
| 3 | (24-A/S) | +0.041 | –0.194 | 17.85 | 18.38 | 18.15 |
| 4 | (24-A/N) | 0.000 | 0.000 | 18.26 | 18.51 | 18.34 |
| 5 | (24-B/E) | +1.204 | –0.326 | 20.33 | 20.35 | 20.28 |
| 6 | (24-A/W) | –0.301 | –0.070 | 20.92 | 20.80 | 20.81 |
| 7 | +1.531 | +1.528 | 19.02 | 19.03 | 18.78 | |
| 8 | (24-C) | +0.666 | –1.493 | 21.14 | 20.75 | 20.67 |
| 9 | +0.187 | +0.624 | 17.70 | 16.99 | 16.74 | |
| 10 | –1.671 | +3.687 | 18.35 | 16.73 | 16.50 | |
| 11 | +6.086 | +4.707 | 20.67 | 17.97 | 17.64 | |
| 12 | –1.788 | +7.255 | 20.91 | 18.01 | 17.45 | |
| 13 | –2.006 | –2.247 | 21.32 | 18.26 | 17.78 | |
| 14 | +5.171 | +1.269 | 21.77 | 18.45 | 17.86 | |
| 15 | +5.125 | +2.281 | 21.39 | 18.04 | 17.44 | |
| 16 | –1.207 | +5.004 | 21.10 | 17.62 | 17.12 | |
| 17 | +0.409 | –0.514 | 21.88 | 18.30 | 17.69 | |
| 18 | –1.082 | +0.241 | 21.17 | 17.51 | 16.71 | |
| 19 | +1.318 | –0.099 | 21.81 | 17.92 | 17.01 | |
| 20 | +5.136 | +0.643 | 21.77 | 17.20 | 16.53 | |
| 21 | –2.150 | +1.966 | 24.54 | 20.02 | 19.25 | |
| 22 | +3.142 | +0.829 | 24.79 | 20.23 | 19.34 | |
| 23 | –4.077 | +0.728 | 24.27 | 19.13 | 18.25 |