An X-ray investigation of Hickson 62
Abstract
We studied the X-ray properties of the Hickson Compact Group HCG 62, in order to determine the properties and dynamic and evolutionary state of its hot gaseous halo. Our analysis reveals that the X-ray diffuse halo has an extremely complex morphological, thermal and chemical structure. Two deep cavities, due to the presence of the AGN hosted by the central galaxy NGC 4778, are clearly visible in the group X-ray halo. The cavities appear to be surrounded by ridges of cool gas. The group shows a cool core associated with the dominant galaxy. In the outer regions the temperature structure is quite regular, while the metal abundance shows a more patchy distribution, with large () Si/O and Si/Fe ratios.
1 Introduction
Compact galaxy groups[1] are composed by a few () galaxies in close configuration, resulting in spatial densities comparable to those found in the core of rich clusters: they hence represent a link between poor galaxy groups and rich clusters. Compact groups show small dynamical timescales (a few yr), implying frequent interactions or complete merger of the member galaxies, which are hardly observed in the majority of them[1]. Such peculiar properties have cast doubts on the physical reality of these structures. Detailed spectroscopic and X-ray studies have now brought a general agreement that these are real systems. The implication is that a) significant evolution must have occurred in most of these objects; b) to justify their observed number, the dynamical timescales involved must be somehow diluted. One of the favored scenarios suggests that CG are embedded in extended dark matter halos which would significantly increase the dynamical timescales. Such halos have been revealed in several groups through extensive spectroscopic and X-ray surveys[2, 3].
HCG 62 is one of the nearest CGs, with a redshift of ( Mpc111 (, ), and it is composed of 4 early type galaxies. The group is dominated by the two S0 galaxies NGC 4778 and NGC 4776 with a projected separation of just 8 kpc. HCG 62 is embedded in a bright X-ray halo extending out to kpc with erg s-1. The discovery of two large cavities in its X-ray halo due to the presence of the AGN hosted by the central galaxy NGC 4778 [4], has recently drawn the attention of the astronomical community on this nearby galaxy group. Furthermore Spavone et al.(2006) have shown that this galaxy has a counter-rotating core and has thus experienced a recent accretion event, indicating a possible link between the AGN activity revealed by the Chandra X-ray observations and the merger event.
2 Morphological and Spectral Properties of the Diffuse Halo
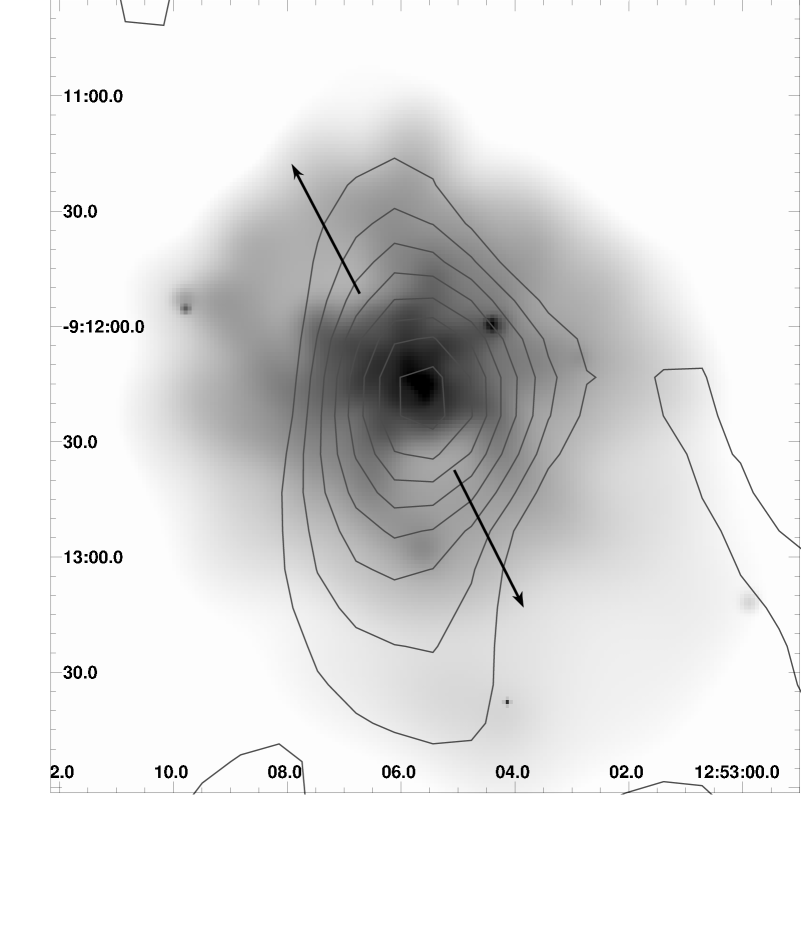
In Fig. 1 (left panel) we show
the adaptively smoothed X-ray image from the ACIS-S3 chip.
The diffuse X-ray halo shows a NE-SW elongation and reveals the
presence of two deep cavities in the hot gas located
symmetrically with respect of the bright central galaxy
NGC 4778[4].
These cavities closely resemble those
discovered by Chandra in many galaxy clusters,
produced by the relativistic radio-emitting jets produced by the AGNs hosted by the dominant
galaxy of the system [6, 7, 8].
The simplest spectral model which could approximate, although with large residuals (), the observed X-ray emission within a radius of arcmin, is an absorbed plasma emission model with two isothermal components. Both a MeKaL and an APEC model in fact require the presence of a low-temperature keV component with supersolar (but unconstrained) metallicity and a high-temperature component keV with subsolar () metallicity. Leaving as free parameters Fe, O and Si abundances while linking all other elements to Fe in their solar ratios (using double VMeKaL and VAPEC models), led to a measurable improvement in the model fitting, implying unusually high Si/O and Si/Fe ratios (). Results though show that both a single and a double temperature plasma model, weighted over the whole group, are not adequate to describe the properties of the diffuse emission, revealing a more complex temperature and metallicity distribution. Temperature and metal abundance profiles are shown in Fig. 2. The group temperature increases from kT in the innermost regions to at . Past we observe a temperature decrease, measurable out to (as found from ROSAT data). The metal abundance profile reveals instead a metal rich group core, within , but uncertainties, mainly due to the patchy abundance distribution in the central regions, are too large to be able to quantify the effect. The metallicity shows hints of a secondary peak at , then slowly decreases going to larger radii.
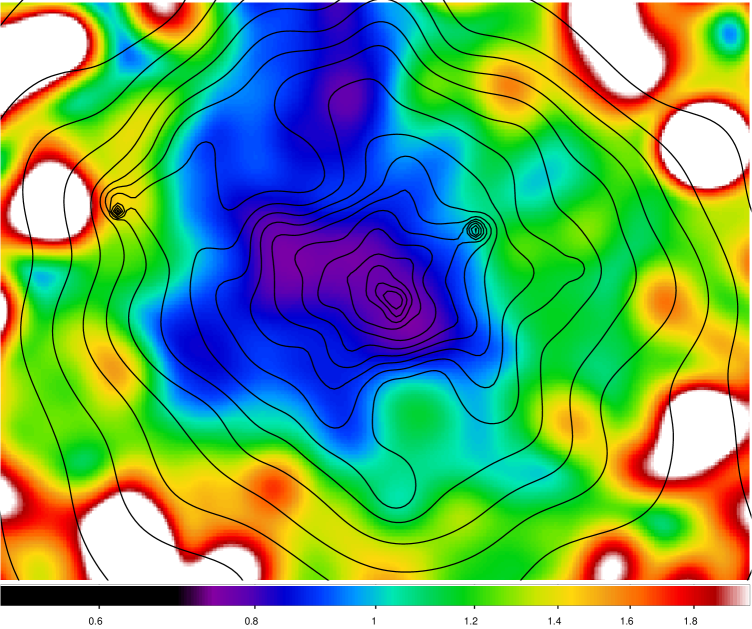
A more accurate description of the physical properties of the intragroup medium and of their spatial distributions has required a two-dimensional spectral analysis of the diffuse X-ray halo. In the right panel of Fig.1 is shown the resulting temperature map, where different shades of gray reflect the different temperatures; superposed are the logarithmically spaced csmoothed X-ray contours. The map was obtained fixing the hydrogen column density to the Galactic value, the redshift to the nominal group value, and using a single MeKaL model in each cell. The group shows a cool core associated with the dominant galaxy, in agreement with the temperature profiles discussed above. The cavities themselves appear to be surrounded by cooler gas, as already observed in several galaxy clusters [8]. In the outer regions the temperature structure is more regular, slowly increasing with the distance from the group center. The metal abundance shows instead a more patchy distribution.


3 Gas Mass and Total Gravitating Mass Distributions
We derived the radial density distribution of the hot gas from deprojection of the X-ray surface brightness profile, assuming spherical symmetry and under the hypothesis of hydrostatic equilibrium. We estimated the total gravitating mass profile both through non-parametric deprojection or modeling the surface brightness profile with a double -model. The resulting integrated gas mass and total gravitating mass profiles are shows in Fig. 3 (, ). The plot highlights that the assumption of isothermality leads to underestimate the total group mass. In the right panel we compare the observed mass density profile with two analytical models: the NFW and Moore’s model, which have a central density cusp proportional to r-1 and r-1.5, respectively. We found that the steeper Moore’s profile provides a better fit to the data.


4 Conclusions
We analyzed the complex morphological, thermal and chemical structure of the HCG 62 X-ray halo. The halo shows a cool core with nearly solar abundances and hotter outskirts with subsolar metallicities. Our spectral analysis also suggest large () Si/O and Si/Fe ratios. Interactions with the radio-emitting plasma has created two deep cavities in the X-ray diffuse halo; the cavities are surrounded by ridges of cool gas, as already noticed in richer galaxy structures. A steep Moore’s profile provides a better fit to the inner regions of the total mass density profile. Our results are supported by the independent analysis by Morita et al.(2006).
References
- [1] Hickson, P. 1997, ARA&A, 35, 357
- [2] Zabludoff A. I. & Mulchaey, J. S. 1998, ApJ, 496, 39
- [3] Mulchaey, J. S. & Zabludoff, A. I. 1998, ApJ, 496, 73
- [4] Vrtilek, J. M. et al. 2000, in ”Constructing the Universe with Clusters of Galaxies”
- [5] Spavone, M., Iodice, E., Longo, G., Paolillo, M., & Sodani, S. 2006, A&A, 457, 493
- [6] Bîrzan, L., Rafferty, D. A., McNamara, B. R. et al. 2004, ApJ, 607, 800
- [7] Paolillo, M., Fabbiano, G., Peres, G., & Kim, D.-W. 2002, ApJ, 565, 883
- [8] Schindler, S., Castillo-Morales, A., De Filippis, E. et al. 2001, A&A, 376, 27
- [9] Morita, U., et al. in press in PASJ, astro-ph/0607159