Large Scale Flows from Orion-South1,2,31,2,3footnotemark: 1,2,3
Abstract
Multiple optical outflows are known to exist in the vicinity of the active star formation region called Orion-South (Orion-S). We have mapped the velocity of low ionization features in the brightest part of the Orion Nebula, including Orion-S, and imaged the entire nebula with the Hubble Space Telescope. These new data, combined with recent high resolution radio maps of outflows from the Orion-S region, allow us to trace the origin of the optical outflows. It is confirmed that HH 625 arises from the blueshifted lobe of the CO outflow from 136–359 in Orion-S while it is likely that HH 507 arises from the blueshifted lobe of the SiO outflow from the nearby source 135–356. It is likely that redshifted lobes are deflected within the photon dominated region behind the optical nebula. This leads to a possible identification of a new large shock to the southwest from Orion-S as being driven by the redshifted CO outflow arising from 137–408. The distant object HH 400 is seen to have two even further components and these all are probably linked to either HH 203, HH 204, or HH 528. Distant shocks on the west side of the nebula may be related to HH 269. The sources of multiple bright blueshifted Herbig-Haro objects (HH 202, HH 203, HH 204, HH 269, HH 528) remain unidentified, in spite of earlier claimed identifications. Some of this lack of identification may arise from the fact that deflection in radial velocity can also produce a change in direction in the plane of the sky. The best way to resolve this open question is through improved tangential velocities of low ionization features arising where the outflows first break out into the ionized nebula.
Subject headings:
H II regions—ISM: jets and outflows—ISM: Herbig-Haro objects—ISM: individual (Orion Nebula, HH 528, Orion-S, OMC-1S, Orion South, M42)—stars: pre-main sequence1. Introduction
As the nearest region of star formation that includes young massive stars, the Orion Nebula and its eponymous cluster attract considerable attention from students of star formation. The cluster is displaced towards the observer from the remainder of the host molecular star and the visible nebula is a relatively thin, irregular, concave layer of ionized gas on the observer’s side of the molecular cloud. Numerous optical shocks and jets (O’Dell, 2001) reveal the presence of collimated and broad outflows from those stars that lie in the photoionized portion of this region; but one must rely on infrared, x-ray, and radio observations to tell what is happening among the optically obscured cluster stars lying beyond the H II region, which constitute roughly half of the total cluster membership (Hillenbrand, 1997). In the case of the highly embedded (about 0.2 pc behind the nebula) BN-KL region, one only sees a few optical features resulting from stellar outflow at the tips of the Allen and Burton fingers (1993). However, in the region known as Orion-South (Orion-S, also known as Orion Molecular Cloud 1 South or OMC-1S), lying 1′ to the southwest from the dominant ionizing star Ori C, the embedded sources lie near the surface of the nebula and we see numerous Herbig-Haro (HH) objects there. This is the third region of star formation in the vicinity of the Orion nebula and is in a local bump in the surface of the nebula (Wen & O’Dell, 1995), where the expanding H II region has been slowed because of the higher density of gas there. There have been numerous recent papers that try to relate the moving optical features to the obscured sources of the outflows, but we reassess the situation here because of the recent availability (Zapata et al., 2005, 2006) of high spatial resolution maps of CO and SiO outflows from Orion-S. We present new results obtained spectroscopically and with imaging in § 2, summarize what we know about the optical features in § 3, present a combined picture of the optical features in § 4, and discuss their relation to the CO and SiO outflows in § 5. Throughout this paper we will adopt a distance of 460 pc, after Bally, O’Dell, & McCaughrean (2000), henceforth BOM.
2. Observations
In this section we present new observations of the Orion Nebula. The first results are from a program of mapping the radial velocity across the Huygens region of the nebula, the second are results from imaging an even wider region with the Hubble Space Telescope.
2.1. HH 528
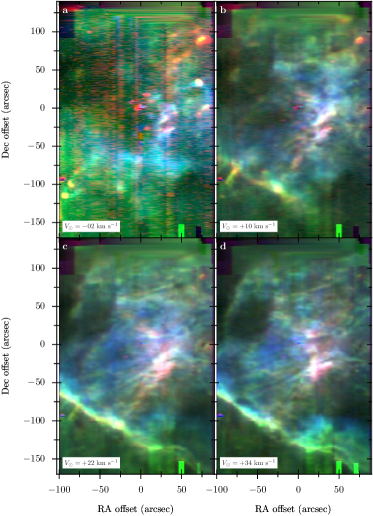
We have constructed isovelocity channel maps of the core of the Orion Nebula, based on echelle longslit observations in the optical emission lines of [] 6716,6731 Å, [] 6300 Å, and [] 6312 Å. Full details of the observations and data reduction process are given in García-Díaz & Henney (2006, henceforth GH07). The data were obtained primarily with the Manchester Echelle Spectrometer (Meaburn et al., 2003) on the 2.1 m telescope of the Observatorio Astronómico Nacional at San Pedro Martir, B.C., Mexico, while part of the [] dataset was obtained with the 4 m telescope at Kitt Peak National Observatory (Doi, O’Dell, & Hartigan, 2004, henceforth DOH04). Figure 1 shows images of selected channel maps, with [] 6300 Å shown in red, [] 6731 Å shown in green, and [] 6312 Å shown in blue. All velocities in this section are given in the heliocentric frame, and can be transformed to the Local Standard of Rest by subtracting 18.1 . All positions in this section are given in arcseconds, (, ), with respect to Ori C, the brightest of the Trapezium stars and the principal source of ionizing photons in the nebula. Some artifacts are present in the data, principally due to variations in sky brightness, which manifest themselves as vertical stripes in the images. These are most noticeable where the signal is intrinsically weak, such as in the blueshifted [] emission (shown as red in Fig. 1a) and are further discussed in GH07 Section 2.
The difference in the emission distribution between the three lines is due primarily to changes in ionization: the [] line is emitted only by fully ionized gas, whereas the [] line comes from a thin layer of partially ionized gas at the ionization front or from shocks in neutral gas. The [] line comes from both the ionization front (IF) and from the fully ionized gas that is close to it. In addition, collisional deexcitation causes the [] line to saturate in the highest density regions. Since the electron density shows a general decline with distance from the center of the nebula, the outer parts of the map have a green tinge, indicative of relatively strong [] emission, while the inner parts vary from pink to blue, depending on whether low- or high-ionization emission is dominant.
The emission in the most blueshifted channel that we show, centered on , is dominated by a broad band of high-ionization gas known as the Big Arc (O’Dell et al., 1997a), which crosses the south of the nebula from east to west. One also sees emission from the low-velocity wings of the highly blue-shifted HH objects (O’Dell et al., 1997b): HH 203/204 around (, ); HH 202 around (, ); and the low-ionization HH 201 at (, ). As one passes to more redshifted channels, these features fade away to be replaced by the systemic nebular emission, which in low-ionization lines is dominated by linear bar-like features (O’Dell & Yusef-Zadeh, 2000), of which the Bright Bar (in the lower-left of the images) is merely the most prominent example (see GH07 for a more detailed discussion). In this paper we discuss only the data around HH 528 out of the rich body of information of this data-set because this is the lowest ionization object among the many HH objects in the Orion Nebula.
2.1.1 Radial Velocity Measurements of HH 528’s Jet
HH 528 is a long, collimated outflow along a position angle , which originates around 30″ south of the Trapezium as a broad jet and ends in a diffuse bowshock where it interacts with the Bright Bar.
The HH 528 jet can be best seen in our channel map centered on (Figure 1) as an elongated () pink-orange region, centered on (, ). It can also be seen at more blueshifted velocities, where it is superimposed on the higher ionization Big Arc South, and more redshifted velocities, where it is seen to be cut in two by a dark extinction feature.
In [], the jet appears to have two components: a spatially broad, smooth component, which is also seen in [], plus a series of compact knots along its eastern side at (, ), (, ), and (, ). These knots are more blueshifted than the smooth component, being most visible in the channel. Further south, we can identify two more knots of blueshifted emission in both [] and [] at (, ) and (, ), which show the highest contrast against the surrounding nebula in the channel. No [] emission is seen from the jet.
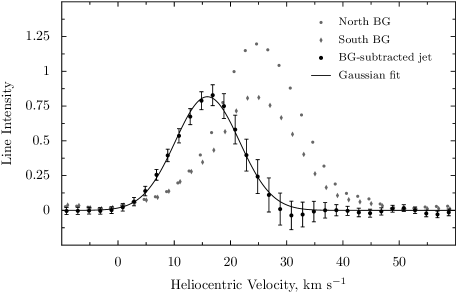
The visibility of the jet in a given channel is strongly affected by the brightness and velocity of the surrounding nebular emission and so is not a reliable guide to the jet’s radial velocity. Therefore, we have extracted one dimensional [] spectra from 5″-long samples of the slit, which cover the jet and two adjoining background regions. We have fitted a Gaussian profile to the background-subtracted jet profile, assuming that the nebular emission in the jet sample can be linearly interpolated from the two background samples (see Fig. 2). Although the peak velocity and shape of the background nebular line is relatively stable in the vicinity of the jet, its brightness shows substantial variation along the slit, and this is the primary contribution to the uncertainty in the jet profile on its redward side (we have used a conservative estimate of one half of the difference between the two background samples). The derived jet velocity from the Gaussian fit is , where the uncertainty is given by the formal standard error in the fitting parameters.
We followed a similar procedure for [] but this was complicated by the presence of blueshifted emission from the Big Arc at the same position as the jet. Nonetheless, we determine a jet velocity of , which is consistent with the more precise [] value. The electron density in the jet is determined to be , which is very similar to the value in the surrounding nebula.
2.1.2 Radial Velocity Measurements of HH 528’s Bowshock
The terminal bowshock of HH 528 is also visible as a blue-shifted feature in our maps, showing the greatest contrast in the same channels as for the jet. Although it is strongest in the low-ionization lines, it is also present in []. The brightest part of the bowshock is a diffuse clump, of roughly 10″ in diameter, centered on (, ). It is displaced about 10″ towards the Trapezium from where one would expect to find the Bright Bar, assuming that the northeastern portion continued in a straight line to the southwest. There is also blueshifted emission, strongest in [], extending about 40″ southwest along the Bar, which seems to be a wing of the bowshock. Weaker blueshifted emission also extends a similar distance to the east and north east, which may represent the opposite wing of the bowshock.
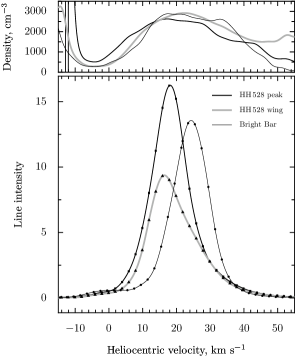
Figure 3 shows profiles of the [] 6731 Å line from two positions in the bowshock and for an adjoining undisturbed region of the Bright Bar at (, ). The bulk of the bowshock emission is blueshifted with respect to the systemic velocity, peaking at to , as opposed to for the undisturbed bar. Note that it is impossible to reliably subtract the background nebular emission from the bowshock profile, as was done for the jet profile above. This is because the nebular emission shows extreme brightness fluctuations that preclude the possibility of interpolating its value from adjacent regions. In particular, the emission from the Bright Bar is significantly depressed at the position of the bowshock, as can be seen from Figure 3. On the other hand, the bowshock component is so strong that its velocity can be reliably estimated even without background subtraction.
In addition to the blueshifted peak, the bowshock profiles also show weak red wings, extending out to , which are lacking in the Bar profile. The weak low density component around is present in all the profiles and is an unrelated general feature of this part of the nebula (GH07). The surface brightness of the bowshock emission is very similar to that of the rest of the bar, as is the electron density (upper panel of Figure 3) at 2500 to 3000 . The bowshock also shows the same ionization stratification as the bar, with the emission from more highly ionized lines becoming progressively more diffuse and shifted towards the direction of the Trapezium. On the other hand, the [] emission is not as thin as in the Bar proper.
Roughly 15″ to the south of the bowshock lies a curious zone of low-ionization, low-brightness, scalloped emission features which are most visible in the velocity range to . Electron density channel maps (GH07) show a narrow ridge of enhanced density that is continuous between these features and the eastern portion of the Bright Bar.
2.2. An HST Survey of the full Orion Nebula
The new Hubble Space Telescope (HST) images used in this study were obtained as part of program GO 10246, with Massimo Robberto serving as the Principal Investigator. This program imaged the Huygens region of the Orion Nebula and its periphery using 104 pointings. The Advanced Camera for Surveys (ACS) was the primary instrument and the pointings were chosen so as to provide a continuous mosaic across the nebula. Parallel observations were made with the Wide Field and Planetary Camera (WFPC2), and the NICMOS infrared instrument, although those data are not used in the current study. The primary scientific thrust of program GO 10246 is to study the properties of the Orion Nebula Cluster stars and this drove the selection of the filters employed; however, a complete mosaic was made with the F658N filter (characteristic exposure time 340 s), which is equally sensitive to both hydrogen H (6563 Å) and [N II] (6583 Å) emission. The other filters employed and their characteristic exposure times were F435W (420 s), F555W (385 s), F775W (385 s), and F850LP (385 s). The observations were made in two observing campaigns, in October, 2004 and April, 2005. The wealth of images were combined and rendered into a seamless mosaic.
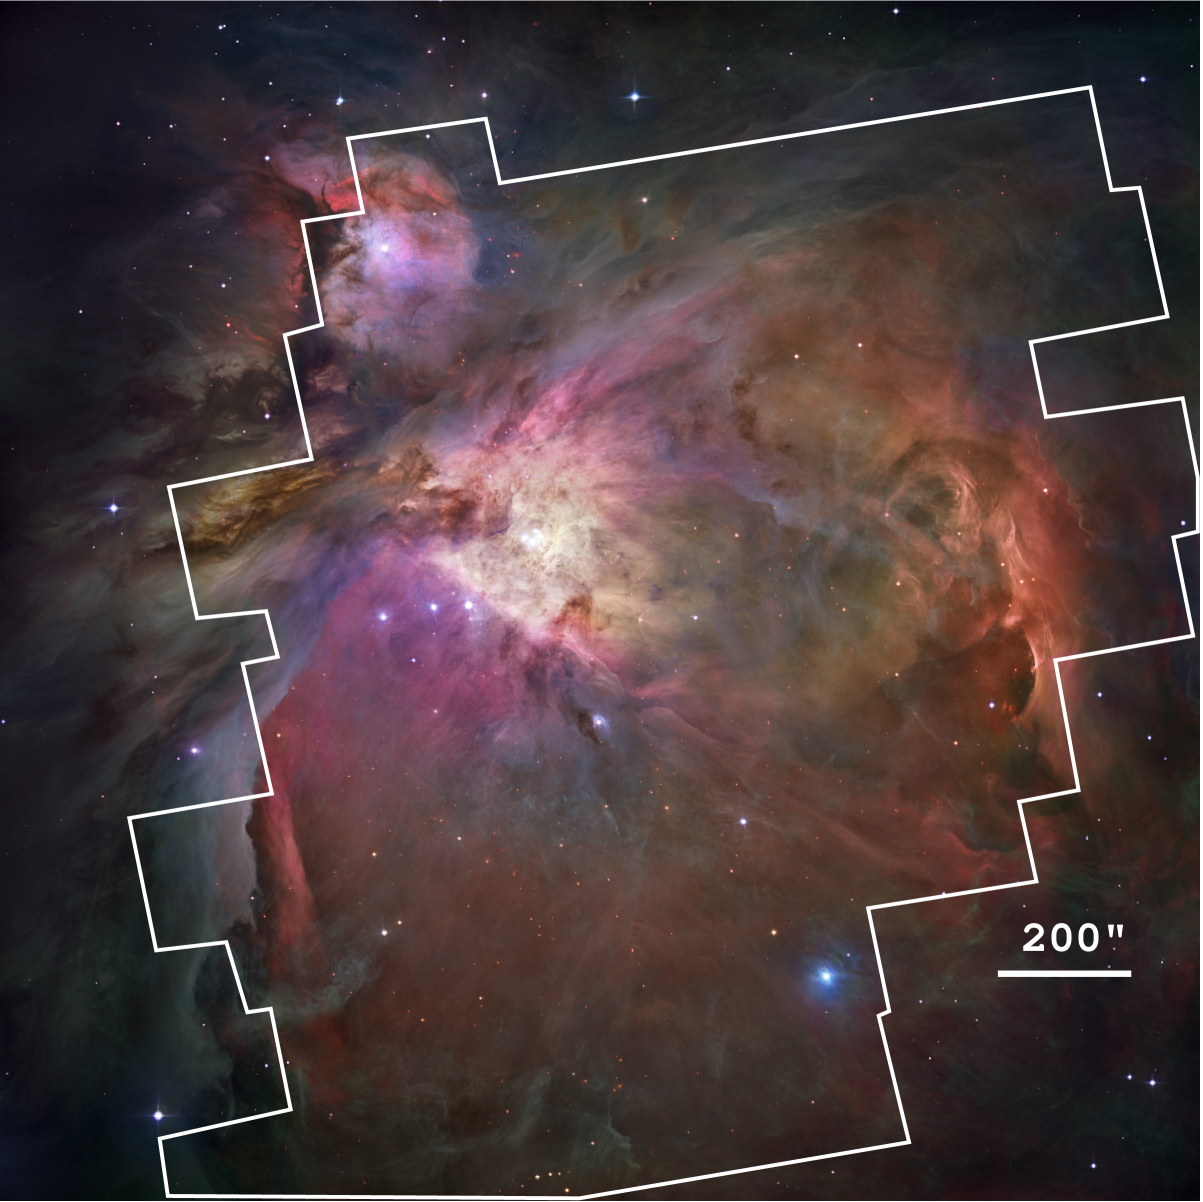
The resulting picture from this survey is shown in Figure 4, which is the combined image from all the filters, including those dominated by continuum, rather than emission lines. The outline of the field covered by the survey is shown in Figure 6 and the outer parts of this image have been filled-in by images made by Massimo Robberto with the ESO La Silla 2.2 meter telescope. The color coding is red (F850LP+F775W, dominated by scattered starlight with some [S III] emission), red/orange (F658N, dominated by H+[N II]), green (F555W, dominated by [O III] and scattered starlight), and blue (F435W, dominated about equally by hydrogen Balmer lines and scattered starlight).
3. Properties of the HH Objects Associated with the Orion-S Region
There are two regions of large scale outflows in the Orion Nebula: one centered about 55″ to the southwest from the brightest Trapezium star (Ori C) and the other centered on the BN-KL sources to the northwest. The two regions are clearly independent of one another and in this paper we’ll address only the outflows associated with the southwest Orion-S region. As we shall see, it is likely that there are multiple sources in this region. In this section we will summarize the characteristics of the optical outflows that appear to be associated with Orion-S and in the next section investigate whether there are common sources for them.
For each object we will identify the discovery paper (when possible, sometimes there were multiple steps in recognition of the nature of the object), the values of the most accurate tangential and radial velocities, derived velocity vectors, and any major papers that discuss the object. Since we are interested in the motions relative to the host region, we convert heliocentric radial velocities to velocities relative to Orion () by assuming the velocity of Orion Molecular Cloud to be 28 (O’Dell, 2001). When motions in the plane of the sky (tangential motions, ) are available, these can be combined with the values to give spatial motions () and in all cases we will report the angle () of that velocity vector with respect to the plane of the sky (positive values are towards the observer) and the direction by the Position Angle (PA) measured counter clockwise with respect to north. It is worth noting that referring the angle of the velocity vector to the plane of the sky is in contrast with earlier work (DOH04), where the orientation was given with respect to the line of sight. The objects will be summarized in order of their PA as viewed from Orion-S.
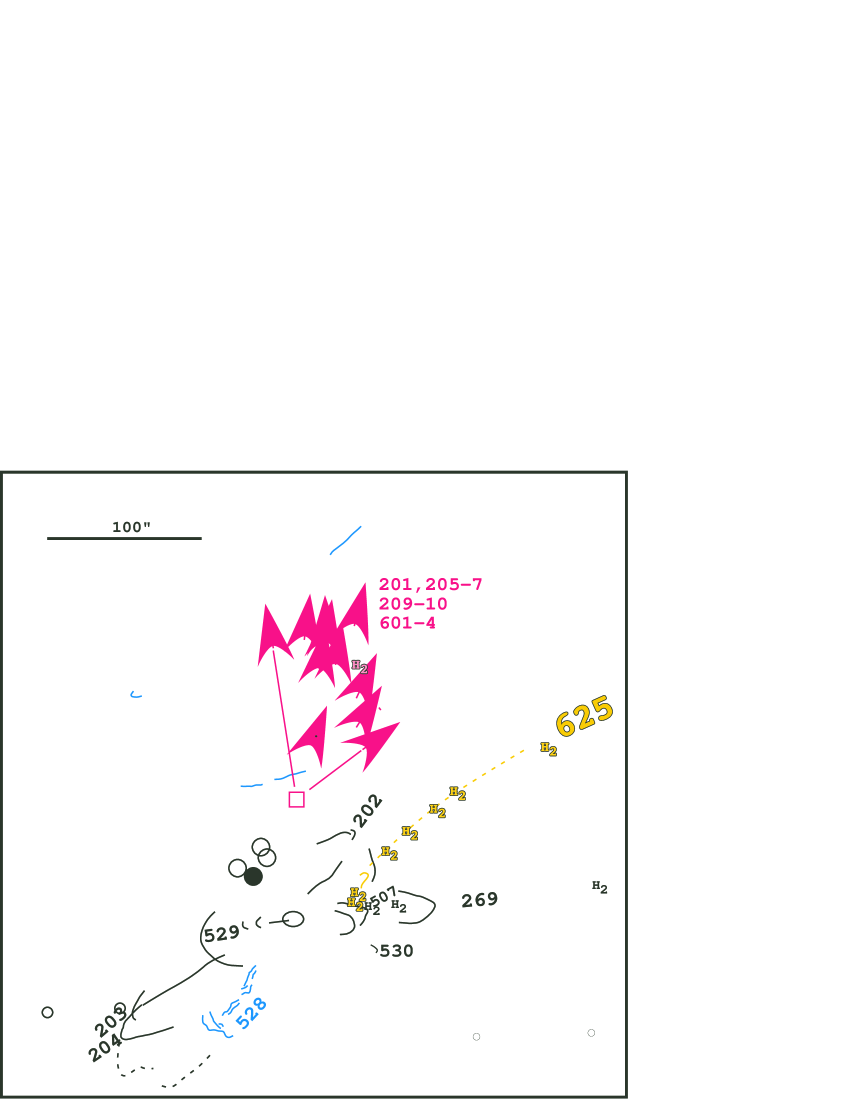
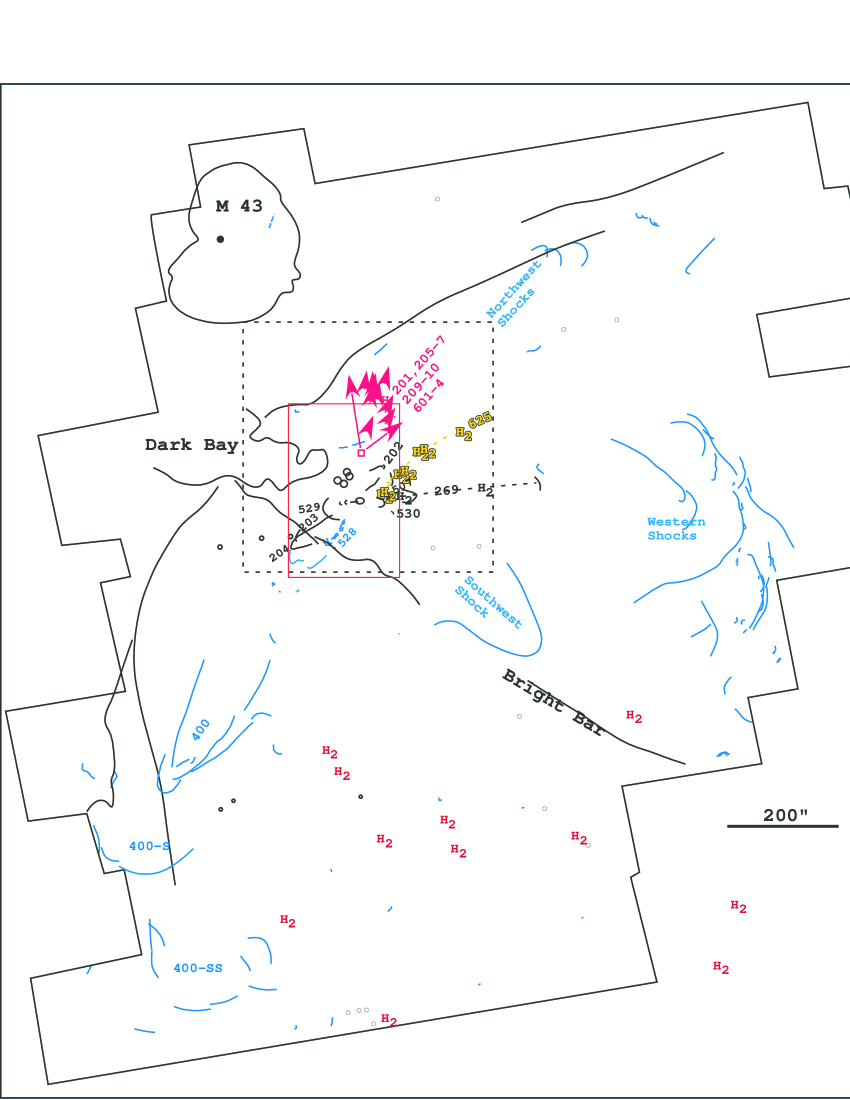
The forms and locations of the objects discussed are presented in Figures 5 and 6. The richness of features in the Orion Nebula means that drawings like this are the best method for isolating objects within a given class. Figure 5 shows a 450″ square field near the Trapezium stars (group of four circles). Numbers indicate the HH object number. The red arrows and open square indicate the HH objects associated with deeply embedded BN-KL region. The H2 symbols indicate the position of compact H2 objects in the survey of Stanke, McCaughrean, & Zinnecker (2002). The dashed yellow line traces the path of the HH 625 components and the dashed black line traces the faint outer features beyond HH 203-HH 204-HH 528. The open ellipse is the position of the Optical Outflow Source (OOS) identified by O’Dell & Doi (2003, henceforth OD03). Figure 6 depicts a field around the Orion Nebula. The irregular outer boundary shows the edges of the coverage with the HST ACS survey and the dashed box the field covered in Figure 5. A few major features within the nebula are labeled and the symbols employed are the same as in Figure 5. Also shown are outer shock features that are newly discovered in the ACS survey and which are discussed in more detail in Section 5.4 below. In this case the features outside HH 203-HH 204-HH 528 are drawn as solid blue lines for clarity.
3.1. HH 529
The high ionization shock features now called HH 529 were visible in the first HST images (O’Dell & Wong, 1996), their similar and high velocities were noted in a low velocity resolution study by O’Dell et al. (1997), and they were designated as a single system by BOM. The shocks are easily visible in [] and H, but are faint in []. They become broader and larger in the eastward direction of apparent propagation. The fact that they are of lower ionization towards the west is discussed in detail by Blagrave, Martin, & Baldwin (2006), who also note that there are errors in the [] data in BOM’s Figure 6. The emission in the filter meant to isolate the [] line at 6300 Å is most likely dominated by the [] 6312 Å line and the spectrum given for [] is an accidental reproduction of the [] spectrum. The interpretation that these are shocks located within the ionized layer of the Orion Nebula (O’Dell et al., 1997a) is strengthened from the study of their spectra (Blagrave, Martin, & Baldwin, 2006). Components of this system were originally identified by their high radial velocities (Lee, 1969; Castañeda, 1988; Massey & Meaburn, 1995) and BOM measured some of the components with the Keck HIRES with good spatial and velocity resolution. DOH04 mapped the entire object in H, [], and [] in their slit study of the Huygens region of the Orion Nebula. Because of the multiple components of this HH object, we will designate each according to the position-based system for the Orion Nebula introduced by O’Dell & Wen (1994). We will adopt the radial velocities from DOH04 and the tangential velocities of OD03 as they have a longer time-base than Doi, O’Dell, & Hartigan (2002, henceforth DOH02) and BOM. The heliocentric velocities of the features near 150–352, 158–353, and 165–358 are , , and respectively, which yields values of , , and . The values of these features are , , and towards PA values of , , and . The resultant values of are , , and , with , , and . Since the errors in the velocities that are used to derive are significant and the calculated angles are correspondingly uncertain, it is not clear if these three features are moving at different angles or along a common average angle of about 41°. In the discussion in § 4, we shall assume the latter.
3.2. HH 203
HH 203 was first recorded by Münch & Wilson (1962) and has been the subject of numerous subsequent studies of its appearance in different ions (O’Dell et al., 1997b), its electron density (Walsh 1982), radial velocity (O’Dell, Wen, & Hu 1993, DOH04), and tangential motions (Cudworth & Stone 1977, Hu 1996, DOH02). Because of its proximity to Ori A Münch & Taylor (1974) interpreted the object as the result of the interaction of a stellar wind with the ambient nebular gas, but the symmetry of the shock and the presence of a high velocity jet leading to it (O’Dell et al. 1997a, Rosado et al. 2001, DOH04) indicate that it is a jet driven shock. Henney (1996) argues that its asymetry in brightness can be explained by the jet striking denser ambient material at grazing incidence. The tip of this feature is a series of well defined shocks. Originally, O’Dell et al. (1997b) argued that the shock is formed when the driving jet strikes the foreground Veil of neutral material that lies in front of the nebula (O’Dell, 2001), but a more accurate knowledge of the position of the Veil (Abel et al., 2004) and an improved knowledge of the shock’s trajectory allowed DOH04 to establish that HH 203 arises where the driving jet strikes denser nebular material where the ionization front of the Orion Nebula tilts up. This tilt is what gives rise to the Bright Bar feature that runs from northeast to southwest, passing near Ori A.
The radial velocity map of DOH04 yields a heliocentric velocity for HH 203 of , which means . The tangential velocity study of DOH02 gives a value of towards . This means that the spatial velocity is and .
3.3. HH 204
HH 204 is close in position to HH 203 and has been studied at the same time as HH 203 in the previous investigations. It extends slightly further from the center of the Orion Nebula and is quite different in appearance, the head of the parabolic shock form being highly flocculent in appearance, rather than having the multiple small shocks present in HH 203. It has extended [O III] emission within the parabolic shock form, which is a strong indication that it is an object that is being photoionized, possibly either by Ori A or more likely by Ori C. The presence of low ionization lines in its tip indicate that it too is striking a dense, low ionization region of the nebula, like HH 203, or, alternatively, that the compression of the ionized gas by the shock leads to the trapping of the ionization front.
The radial velocity map of DOH04 yields a heliocentric velocity for HH 204 of , which means . The tangential velocity study of DOH02 gives a value of towards . This means that the spatial velocity is and .
3.4. HH 528
Tangential velocities in the HH 528 jet have been measured for individual knots in the [] (BOM) and [] (DOH02) lines. Three of these coincide with knots for which we have measured radial velocities. Taking the vector mean of the proper motion measurements of the knots gives a tangential velocity of at a position angle of , which is consistent with the orientation of the line between the jet and the bowshock () and the major axis of the jet as measured from our [] channel maps (). Our fits to the jet component in the [] and [] line profiles give , implying that , in which the uncertainty includes the effect of the 2 velocity dispersion of stars in the Trapezium cluster (Jones & Walker 1988). Therefore for the jet.
Tangential velocities have also been measured for knots in the bowshock of HH 528 (\al@bom00,doi02; \al@bom00,doi02), although the dispersion in magnitude and direction is rather large. Taking the vector mean of the 6 measured knots gives at a PA of . The highest velocity ( at ) is seen in knot 182–513 at (, ), which lies at the very nose of the bowshock. Our [] spectra of the bowshock (Figure 3) show peak velocities of –18 , very similar to that of the jet, implying . Given the uncertainties involved, the data are therefore consistent with the jet and bowshock sharing the same space velocity.111Note that our results are inconsistent with the claim of Smith et al. (2004), based on unpublished Fabry-Perot observations, that HH 528 is redshifted.
3.5. Features possibly related to HH 203-204-528
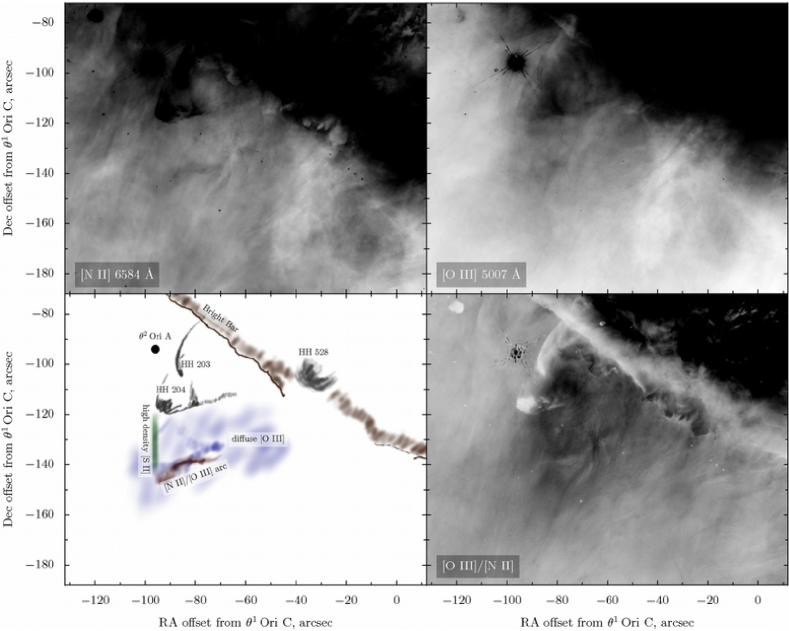
Figure 7 shows faint, high-ionization emission to the south-east of the Bright Bar. The morphology of the emission is reminiscent of a bowshock shape, which may represent an outer shock related to the HH 203/204 system. Alternatively, we cannot rule out that it may be associated with HH 528. Superimposed on this feature is a faint arc of relatively high-density gas, identified in [] channel maps by GH07.
3.6. HH 400
HH 400 was discovered by Bally et al. (2001) on H and [] images of the Orion Nebula and they also report on velocity mapping of the southern part of the nebula in the [] lines. This is the largest of the known HH objects in the Orion Nebula, being a group of large shocks with the furthest tip extending 633″ from Orion-S with . In Figures 5 and 6 we see that there are even larger shocks extending to 789″ at and the shock features at 970″ at may also be associated if the curvature continues. Bally et al. (2001) give only radial velocities relative to the local region of the nebula, finding it redshifted by –. Since there are no published [] velocities for this part of the nebula, and there are no tangential velocities for HH 400, it is impossible to derive its spatial motion. However, Bally et al. (2001) argue from the shape of the HH 400 shocks that it is moving almost in the plane of the sky.
3.7. HH 530
HH 530 was first identified in BOM, where it is depicted in their Figure 22. OD03 improved the measurements of the tangential motions and questioned whether the shock at 108–430 is part of this outflow (since it may be associated with the silhouette proplyd 114–426). OD03 measured the components 105–416 and 105–417, which are parts of a well defined shock oriented almost due west. They have an average motion of towards . There is a nearby 3″ feature oriented almost east-west () and may be an associated jet. This latter feature was found to be moving at towards . There are no published radial velocities of this outflow.
3.8. HH 269
HH 269 was first identified as an HH object in (Walter et al., 1995), following earlier observations of its peculiar form (Feibelman, 1976) and density enhancements in this region (Walter, 1994). It is composed of a series of shock structures oriented towards the west. Although some [O III] emission is seen, the object is brightest in low ionization lines (Walter et al., 1995) and there are associated H2 features in the images of Stanke, McCaughrean, & Zinnecker (2002). The tangential velocities of the tip of the east shock were measured by OD03 to be towards . The heliocentric radial velocity of the east shock is (Walter et al., 1995) (). These values yield with .
3.9. HH 507
HH 507 was first identified in BOM, where it is depicted well in their Figures 22 and 23. It lies along the axis of HH 269, but is clearly separate as it has its own characteristic velocities while features to the east and west have the common motion of HH 269. It has the form of a west-northwest oriented parabola. OD03 found that towards . BOM point out that there is a linear feature along the symmetry axis of this shock and has . If associated with HH 507, this means that the driving jet is not the nearby proplyd 117–352 as it is not aligned with that object. BOM hypothesize that HH 507 is driven by outflow from source FIR 4 (Mezger et al., 1990), although a more complete discussion is presented in our § 5. There are no published radial velocities of HH 507.
3.10. HH 625
HH 625 was identified in OD03 and is unlike any of the other HH objects in the Orion Nebula. It has a peculiar dark feature lying 76″ at from Ori C and that feature has a bright rim on its northwest boundary, the feature being oriented towards . OD03 measured the tangential velocity of the associated bright features to be moving at towards . There are associated H2 features seen in Subaru images (Kaifu et al., 2000) and in the H2 survey of the region by Stanke, McCaughrean, & Zinnecker (2002). The small H2 knots seen in the latter study begin with a linear alignment close to , then curve slightly clockwise, reaching a distance of about 204″ from their point of origin that is discussed in § 5.
There are no published radial velocities of the optical features in this outflow. However, if one adopts a value of , as suggested by the CO molecular outflow (Zapata et al., 2005) that is the driving source of this HH object (as discussed in § 5), then and this part of the object has .
3.11. HH 202
HH 202 was one of the first HH objects identified in the Orion Nebula (Cantó et al., 1980). The best imaging study was carried out with the HST (O’Dell et al., 1997b), where it was revealed that there are a series of fine scale structures near the tip of a broad parabolic envelope. Tangential velocities have been measured by Cudworth & Stone (1977), DOH02, and OD03. Radial velocities have been measured by Meaburn (1986), Clayton & Meaburn (1994), O’Dell, Wen, & Hester (1991), and DOH04. The northwest tip of the object is extremely complex in both images made in different ionic emission and in long-slit spectroscopy. The brightest part is near this tip and is called HH 202-S. The extended emission in [] within the parabolic envelope argues that like HH 204, this shock is photoionized from the rear, in this case almost certainly by Ori C.
DOH04 give a heliocentric velocity of for the bright HH 202-S complex, which corresponds to , and OD03 give towards for the same region. These values yield and .
4. The Combined Properties of the HH Objects
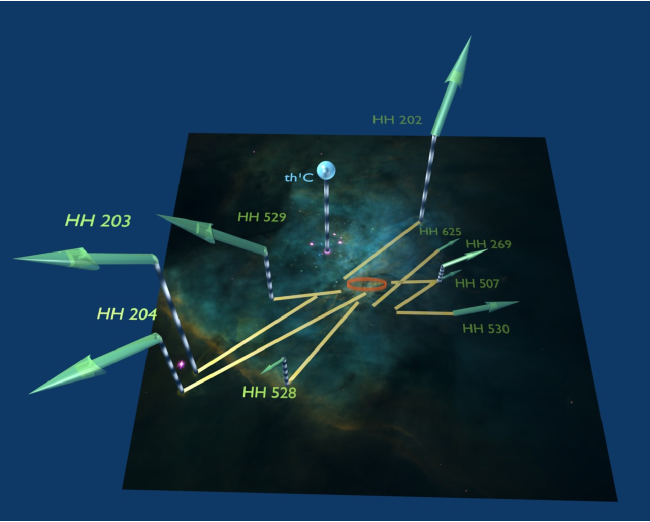
In the case where we can determine spatial velocity vectors (PA, , and are known) and have at least an approximate idea of the place of origin, we can depict these flows in a manner that illuminates what is happening. Figure 8 shows the central region of the nebula in three dimensions. For simplicity, we have assumed in calculating the position along the vertical axis that the objects all originate from the center of the OOS. This assumption is certainly not valid for all the HH objects, but affects only little the general picture of what is going on. In each case the direction of the velocity vector is that derived from and . It should be recalled that the inner region of the Orion Nebula has been mapped in three dimensions by Wen & O’Dell (1995), who determined that the surface is concave (as viewed by the observer), with Ori C lying about 0.2 pc (90″) in front of the ionization front and there is a local rise of about 0.05 pc (22″) at Orion-S. The last feature indicates that Orion-S is a denser region within the host Orion Molecular Cloud and that the ionization front has not penetrated as far there.
The first striking thing about Figure 8 is that all of the optical objects are blueshifted. This indicates that the sources for these HH objects lie in the background of the visible nebula or even in the optically obscured region beyond the IF. One would expect the optical extinction to increase significantly as one begins to penetrate the Photon Dominated Region (PDR) because the density jumps there. If a source were close to the IF, its redshifted component would quickly disappear, unless the flow was diverted into being blueshifted.
The fact that several flows seem to be paired (e.g., HH 529 and HH 269, HH 203/204 and HH 202) has led multiple authors to posit that these are bipolar flows from a single source, with the originally redshifted component being altered into having a blueshift without a significant change in the orientation on the plane of the sky (O’Dell et al., 1997a; Bally et al., 2001; Rosado et al., 2001, OD03). This argument is especially attractive for the HH 529-HH 269 pairing because one sees the components moving in opposite directions in the plane of the sky, leaving a gap only in the OOS region (OD03).
A process for deflection of a redshifted component has been proposed and modeled by Cantó & Raga (1996). They establish theoretically that a jet passing through a density gradient will be deflected towards the direction of the lower density. This is extremely attractive for explaining what we see in the Orion Nebula because we know that there is a strong density gradient away from the IF, being lower towards the observer (O’Dell, 2001) and theoretical models indicate that the density in the neutral PDR should rise as one passes the IF. Whether or not a beam is deflected by or penetrates the PDR will be dependent upon many factors, including geometry, magnitude of the density gradient, mass flux of the jet, so that one cannot make an accurate prediction of what will occur.
This means that redshifted flow from a source located within the ionized zone of the nebula will eventually reach the IF. If it is deflected sufficiently it can become a blueshifted flow and if it passes through or remains in the PDR then it will be optically invisible.
If the source is obscured by extinction (embedded), then the conversion of a redshifted into a blueshifted component means that the source must lie close enough behind the PDR so that there is still an increase of density away from the observer. There is some evidence that this is the case for the flow from the OOS source since OD03 calculated that the source was only a few hundredths of a parsec beyond the IF.
Unfortunately, the Cantó & Raga mechanism can also make it more difficult to identify the location of a source. This is because if a jet strikes a region with a tilted density gradient not only will there be the potential of changing a redshift into a blueshift, but, the direction in the plane of the sky can be changed. However, one expects that this alteration will be less important since the concavity of the IF is not great except in the region of the Bright Bar. This mechanism may be what produces the curvature of the path of the components of HH 625, which OD03 argue is a flow grazing along just behind the IF.
There is another mechanism that complicates identification of a source of an outflow by extrapolating back in the plane of the sky and that is deviations in the direction of the flow caused by a wind blowing on the jet. This mechanism has been invoked by Masciadri & Raga (2001) to explain the bent small-scale bipolar jets that one sees in the Orion Nebula, the object associated with LL Orionis being the best example (BOM). The side wind is most likely to be the flow of gas away from the bright central region of the nebula. It may be that the well defined curvature necessary to connect HH 203+HH 204 to HH 400 and its southernmost components is caused by such a wind.
The second striking thing about Figure 8 is that the backwards projection of the velocity or symmetry vectors cross in a relatively small area, close to Orion-S. In § 5 we will discuss the probable sources that lie in this region, putting special emphasis on identification of infrared or radio compact sources and the molecular flows known to exist there.
5. Discussion
5.1. Comparison of the Optical Objects with the Embedded Molecular Outflows
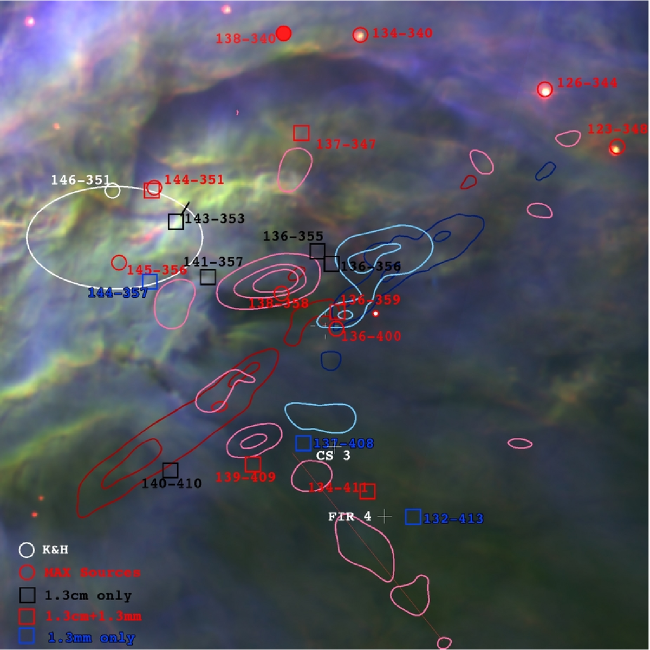
Significant progress has been made recently in the understanding of molecular outflow from the Orion-S region. The most important recent contributions are the studies of CO (Zapata et al. 2005) and SiO (Zapata et al. 2006), which exceed in sensitivity and angular resolution the previous investigations of this region. These two studies are summarized in Figures 9 and 10.
In Figure 9 the CO results are shown as contours of the redshifted (red) and blueshifted (blue) components. For simplicity we have drawn only the outermost brightness contours and a few of the inner. Zapata et al. (2005) show that the flow aligned along reaches maximum values of . SiO emission in the outflows from this region far exceed the normal nebular abundance and must arise from destruction of grains within the molecular cloud or the PDR lying immediately beyond the nebula’s IF (Zapata et al. 2006). The results of the SiO study are shown in Figure 9 in a similar manner to the CO results, except that redshifted emission is depicted as pink and blueshifted as pale-blue. The primary emission occurs along an axis of PA=284°and reaches velocities of =-90 and =75 . These radio results are shown displayed on an HST WFPC2 optical image with the color coding [S II]-red, [N II]-green, and [O III]-blue. In addition, we show the positions of compact radio and infrared sources in the vicinity of Orion-S, as discussed later in this section, in addition to the Optical Outflow Source of OD03.
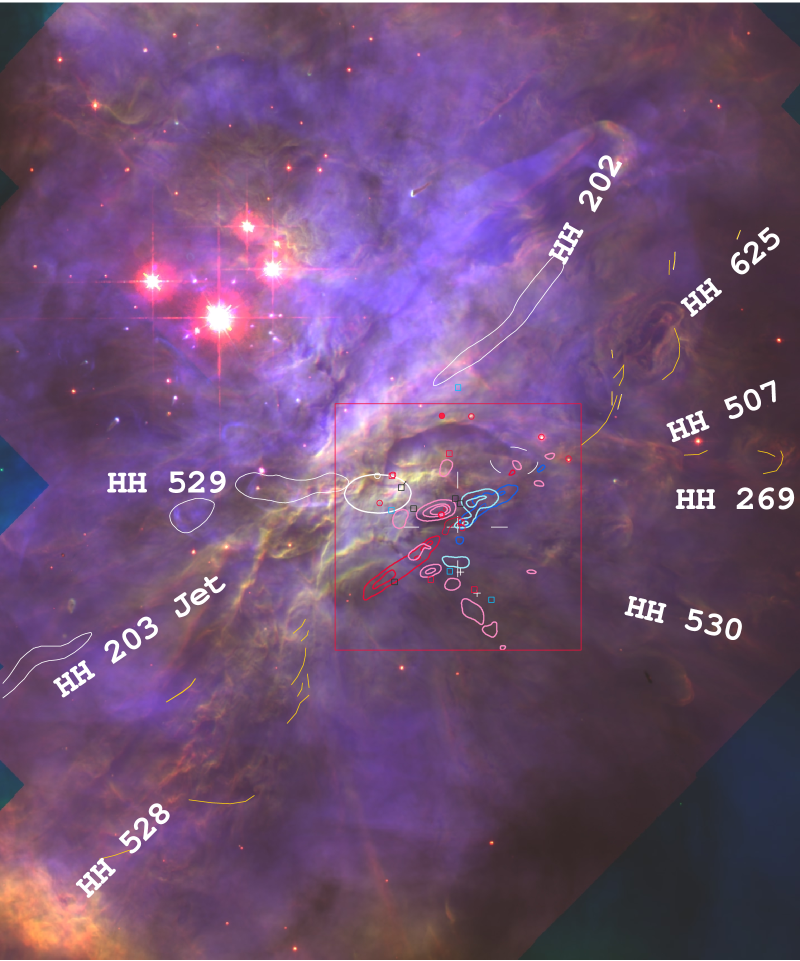
A wider field around Orion-S is shown in Figure 10, where we have added to the inner region data of Figure 9 the outer optical objects (designated by their HH catalog numbers), and H2 emission indicated on the Subaru images (Kaifu et al., 2000). Highly blueshifted optical emission is shown by closed contours of thin yellow lines. The location of the compact and narrow high velocity components are best delineated in DOH04, but we have shown the contours of emission from Takami et al. (2002). This is useful because the 10830 Å line is optically thick because its lower state is metastable. Differences of radial velocity shift the line outside the core of the absorption and allow that radiation to selectively escape.
5.2. A Well Defined Connection between the CO Outflow, its Infrared Source, and HH 625
The new high spatial resolution CO images of the Orion-S region have provided the necessary ingredients to firmly establish that HH 625 is driven by the blueshifted outflow from the embedded source 136–359 as previously suggested in OD03. It is likely that the beam of molecular gas remains very confined and is grazing along the PDR, occasionally breaking through the irregular and concave IF. In this way one can reconcile the CO, H2, and optical observations.
It is natural to look for optical features corresponding to the redshifted CO outflow. The deflection of the beam that would be necessary to produce an optical counterpart would also produce the possibility of deviation in PA, thus complicating making an identification. The most promising candidate would be HH 528 because its PA is closest to that of the redshifted CO component. There is probably not a connection with HH 203 and HH 204 as their driving jet is aligned towards the OOS and linking them with the CO outflow would mean that the jet would have to suffer two deviations in PA, the first to place it into alignment with the HH 203 jet, then a second to point it towards the shocks we call HH 203 and HH 204. The key element of confirming an association of the redshifted CO outflow with HH 528 would be to discover tangential motions that connect the southeast end of the molecular outflow with the low ionization features that form the base of HH 528.
5.3. A likely Connection between the SiO Molecular Outflow, its Infrared Source, and HH 507
The well defined SiO outflow has a strong candidate for its source (135–356, Zapata et al., 2006), however, there no obvious connections with optical HH objects. The blueshifted component that is elongated towards does point towards HH 507, which lies at from 135–356. As noted in § 3.9, the shock forming HH 507 is oriented towards and is moving towards . Moreover, as noted by BOM, there is a trailing linear feature, which may be a jet, that is oriented towards . These combined characteristics argue that HH 507 is associated with the blueshifted SiO outflow from 135–356. The discovery of the SiO outflow and its alignment with HH 507 means that the conclusions presented here supercede those of BOM, where it was argued that HH 507 originated from the region of CS 3 or FIR 4. The possibility of HH 269 being driven by the blueshifted component of the SiO outflow is discussed in § 5.5.
There are no obvious connections of the redshifted SiO outflow with optical HH objects. Associations with any of HH 203, HH 204, or HH 528 could be made by a single deflection that resulted in both a change of PA and radial velocity. There is an incomplete shock lying 34″ at from 135–356 which is oriented towards . The latter value is very close to that applies to the HH 203 jet, which argues that there is an association, if the deviation occurs at just about the position where this shock appears.
5.4. Possible Connections between Molecular Outflows, Infrared Sources, and Distant Shocks
Zapata et al. (2006) point out that sources CS 3 (Mundy et al., 1986) and FIR 4 (Mezger et al., 1990) are likely to be the same, a suggestion made previously by (Gaume et al., 1998), and that this source could be related to their strong millimeter source 137–408. The outflow in the region of this source is complex, there being a redshift-blueshift pair of SiO features lying immediately to the north of it, and a series of redshifted SiO features extending towards . Schmid-Burgk et al. (1990) find a redshifted CO outflow 120″ long extending towards originating from the CS 3-FIR 4 region. Zapata et al. (2006) argue that this implies that both the SiO and CO outflow originate from close to 137–408. There are no cataloged HH objects in the direction of the outflows away from 137–408. However, at a distance of 397″ and a large shock feature can be detected in the ACS f658n mosaic (labeled Southwest Shock in Figure 6), which has a symmetry axis pointed towards . It is possible that this shock is associated with this southwest SiO+CO outflow from 137–408.
As mentioned in § 3.6, HH 400 lies farthest from the cluster center of all cataloged HH objects. Figure 6 illustrates that HH 400 lies almost on a projection of the symmetry axes of three inner HH objects (HH 203, HH 204, and HH 528). Since we know from the curving of bipolar jets in this same part of the nebula (Bally et al., 2006) that there is a distortion of flows by a low velocity wind, it is entirely possible that the small difference in alignment is due to this effect. Unfortunately, this leaves identification of an association with a specific inner HH object impossible. The exact location of HH 400 along the line of sight is very uncertain, especially because of the report of Bally et al. (2001) that the shock is redshifted with respect to the nearby nebular [] emission. Beyond HH 400 are two groups of shocks, labeled 400-S and 400-SS in Figure 6, and which are only seen in the ACS f658n images. Due to their proximity and near alignment with HH 400, it seems highly likely that they are produced by earlier ejections of collimated material. This would mean that there is evidence for four periods of intense outflow in this direction.
The ACS mosaic also reveals a large set of shocks that appear in Figure 6 and are labeled Western Shocks. The northernmost members of this group could be related to the HH 269 outflow. Although they cover a wide range of angles, this could be explained by episodic ejection striking a deflecting surface that has changed between the periods of outflow, hence one would expect both different radial velocity and PA values. The much less well defined Northwest Shocks features are unlikely to be related to HH 625, since it is seen to be rotating clockwise with increased distance from its source; but, could be related to either the outflow producing HH 202 or the fingers seen around BN-KL.
5.5. Origin of the Remaining HH Objects and Comparison with Earlier Studies
In the above discussions we have examined possible origins of many of the cataloged HH objects in the inner part of the Orion Nebula. However, the origin of several major features remains open. The opposite directions of the tangential velocities of the innermost parts of HH 269 and HH 529 (OD03) indicates that if they share a common origin that this lies in the region identified as the OOS. The fact that projections of the directions of the high velocity jets leading to HH 202 and HH 203 pass through the OOS led OD03 to speculate that it is a center of their outflows too. Since the symmetry axis of HH 528 also crosses the OOS, it too could originate there. However, in this paper we have shown that it can be argued, albeit not definitively, that HH 203, HH 204, and/or HH 528 could be a result of the deflection of the originally redshifted SiO outflow from 136–356. This means that we will limit the discussion here to HH 202, HH 269, and HH 529. In Figure 10 we see the structure of the jet feeding HH 202. Its location demonstrates that the source is not the star 138–340 postulated by Smith et al. (2004) from their Fabry-Perot velocity maps of this region. Moreover, their Figure 2 shows that the HH 202 jet passes slightly east of 138–340, which is clearer in the HeI velocity picture shown in our Figure 10 and in DOH04’s Figure 16. Smith et al. (2004) also argue on the basis of the opposing alignment that HH 202 and HH 528 are part of the same outflow, with HH 528 being the originally redshifted component. Similar opposing alignments with a large intervening gap seem to be an insufficient argument for establishing such a connection. While a deflection off the PDR will largely cause a shifting of the velocity along the line of sight, it is also expected to produce some change in direction in the plane of the sky. We note that the southern part of HH 202’s high velocity jet curves clockwise at its southern end, indicating that it may not originate within the OOS. However, since jets can curve more than once, the possibility remains open. Zapata et al. (2004) argued that the elongation of the 1.3 cm source 143–353 (which falls within the OOS) towards HH 202 means that this is the source of HH 202’s jet. However, for this to be the case, the jet would have had to be bent several times to be displaced and reoriented at the point where we begin to optically see it.
The alignment of the direction of the tangential velocities of the westward moving objects ascribed by OD03 to HH 269 argues that they are part of the same flow. Since the more easterly group lies immediately west of the OOS and east of the center of the SiO outflow, they both cannot arise from the SiO outflow. However, the more westerly HH 269 features are positions that are compatible with a deflected SiO outflow. If that is the case, then the HH 269 components lying even further to the west (beyond the region covered in OD03) could also have the same source. This interpretation means dis-associating the two groups studied by OD03 and arguing that the alignment of tangential velocities and positions is only fortuitous. This may be the case, as the east and west groups have quite different tangential velocities ( and respectively. Definitive proof of one interpretation or the other is lacking, but would be provided if one could determine detect optical objects moving from the direction of the SiO source and curing into the direction of the western components of HH 269.
Smith et al. (2004) also argue that the projection of the high velocity features associated with the western part of HH 529 intercepts the infrared source 144–351 and that it is the source of the outflow driving HH 529. This otherwise attractive argument is diminished by the high spatial resolution HST tangential velocity study (OD03) which indicates that the common motion of the features associated with the high velocity flow project about 2″ south of 144–351.
This means that what is happening in the OOS region and its possible relationship to the major HH objects in the Orion Nebula remains very much uncertain at this time. The absence of strong radio, infrared, x-ray, or optical sources within the OOS remains a mystery, if one or more outflows originates from there. What is most likely to help in understanding this region are tangential velocities over a wide range of ionization states, with emphasis on the lowest ionization ions since their emission will originate closest to the IF, the PDR, and presumably the embedded source.
References
- Abel et al. (2004) Abel, N. P., Brogan, C. L., Ferland, G. J., O’Dell, C. R., Shaw, G., & Troland, T. H. 2004, ApJ, 609, 247
- Allen & Burton (1993) Allen, D. A. & Burton, M. G. 1993, Nature, 363, 54
- Bally et al. (2001) Bally, J., Johnstone, D., Joncas, G., Reipurth, B., & Mallén-Ornelas, G. 2001, AJ, 122, 1508
- Bally et al. (2006) Bally, J., Licht, D., Smith, N., & Walawender, J. 2006, AJ, 131, 473
- Bally, O’Dell, & McCaughrean (2000) Bally, J., O’Dell, C. R., & McCaughrean, M. J. 2000, AJ, 119, 2919 (BOM)
- Blagrave, Martin, & Baldwin (2006) Blagrave, K. P. M., Martin, P. G., & Baldwin, J. A. 2006, ApJ, in press
- Cantó et al. (1980) Cantó, J., Goudis, C., Johnson, P. G., & Meaburn, J. 1980, A&A, 85, 128
- Cantó & Raga (1996) Cantó, J., & Raga, A. C. 1996, MNRAS, 280, 559
- Castañeda (1988) Castañeda, H. O. 1998, ApJS, 67, 93
- Clayton & Meaburn (1994) Clayton, C. A., & Meaburn, J. 1994, MNRAS, 269, 403
- Cudworth & Stone (1977) Cudworth, L., & Stone, R. C. 1977, PASP, 89, 627
- Doi, O’Dell, & Hartigan (2002) Doi, T., O’Dell, C. R., & Hartigan, P. 2002, AJ, 124, 445 (DOH02)
- Doi, O’Dell, & Hartigan (2004) Doi, T., O’Dell, C. R., & Hartigan, P. 2004, AJ, 127, 3456 (DOH04)
- Feibelman (1976) Feibelman, W. A. 1976, PASP, 88, 677
- García-Díaz & Henney (2006) García-Díaz, Ma. T. & Henney, W. J. 2007, AJ, in press, astro-ph/0611417 (GH07)
- Gaume et al. (1998) Gaume, R. A., Wilson, T. L., Vrba, F. J., Johnston, K. J., & Schmid-Burgk, J. 1998, ApJ, 493, 940
- Henney (1996) Henney, W. J. 1996, RevMexAA, 32, 3
- Hillenbrand (1997) Hillenbrand, L. A. 1997, AJ, 113, 1733
- Hillenbrand & Carpenter (2000) Hillenbrand, L. A, & Carpenter, J. M. 2000, ApJ, 540, 236
- Hu (1996) Hu, Xihai 1996, AJ, 112, 2712
- Jones & Walker (1988) Jones, B. F., & Walker, M. F. 1988, AJ, 95, 1755
- Kaifu et al. (2000) Kaifu, N., et al. 2000, PASJ, 52, 1
- Lee (1969) Lee, P. 1969, ApJ, 157, L111
- Masciadri & Raga (2001) Masciadri, E., & Raga, A. C. 2001, AJ, 121, 408
- Massey & Meaburn (1995) Massey, R. M., & Meaburn, J. 1995, MNRAS, 273, 615
- Meaburn (1986) Meaburn, J. 1986, A&A, 164, 358
- Meaburn et al. (2003) Meaburn, J., López, J. A., Guitiérrez, L., Quiróz, F., Murillo, J. M., Valdéz, J., & Pedrayez, M. 2003, RMxAA, 39, 195
- Mezger et al. (1990) Mezger, P. G., Wink, J. E., & Zylka, R. 1990, A&A, 228, 95
- Münch & Wilson (1962) Münch, G., & Wilson, O. C. 1962, Z.Astrophys., 56, 127
- Münch & Taylor (1974) Münch, G., & Taylor, K. 1974, ApJ, 192, L93
- Mundy et al. (1986) Mundy, L. G., Scoville, N. Z., Baath, L. B., Masson, C. R., & Woody, D. P. 1986, ApJ, 304, 51
- O’Dell (2001) O’Dell, C. R. 2001, ARA&A, 39, 99
- O’Dell & Doi (2003) O’Dell, C. R., & Doi, T. 2003, AJ, 125, 255 (OD03)
- O’Dell et al. (1997a) O’Dell, C. R., Hartigan, P., Bally, J., & Morse, J. A. 1997, AJ, 114, 2016
- O’Dell et al. (1997b) O’Dell, C. R., Hartigan, P., Lane, W. M., Wong, S.-K., Burton, M. G., Raymond, J., & Axon, D. J. 1997,AJ, 114, 730
- O’Dell & Wen (1994) O’Dell, C. R., & Wen, Z. 1994, ApJ, 436, 194
- O’Dell, Wen, & Hester (1991) O’Dell, C. R., Wen, Z., & Hester, J. J. 1991, PASP, 103, 82
- O’Dell, Wen, & Hu (1993) O’Dell, C. R., Wen, Z., & Hu, X. 1993, ApJ, 410, 696
- O’Dell & Wong (1996) O’Dell, C. R., & Wong, S.-K. 1996, AJ, 111, 846
- O’Dell & Yusef-Zadeh (2000) O’Dell, C. R., & Yusef-Zadeh, F. 2000, AJ, 120, 382
- Robberto et al. (2005) Robberto, M., Beckwith, S. V. W., Panagia, N., Patel, S. G., Herbst, T. M., Ligori, S., Custo, A., Boccacci, P., & Bertero, M. 2005, AJ, 129, 1534
- Rosado et al. (2001) Rosado, M., de la Fuente, E., Arias, L., Raga, A., & Le Coarer, E. 2001, AJ, 122, 1928
- Schmid-Burgk et al. (1990) Schmid-Burgk, J., Güsten, R., Mauersberger, R., Schulz, A., & Wilson, T. L. 1990, ApJ, 362, L25
- Smith et al. (2004) Smith, N., Bally, J., Shuping, R. Y., Morris, M., & Hayward, T. L. 2004, ApJ, 610, L117.
- Stanke, McCaughrean, & Zinnecker (2002) Stanke, T., McCaughrean, M. J., & Zinnecker, H. 2002, A&A, 392, 239
- Takami et al. (2002) Takami, M., Usuda, T., Sugai, H., Suto, H., Pyo, T.-S., Takeyama, N., Aoki, T., Mizutani, K., & Tanaka, M. 2002, ApJ, 566, 910
- Walsh (1982) Walsh, J. R. 1982, MNRAS, 201, 561
- Walter (1994) Walter, D. K. 1994, PASP, 106, 106
- Walter et al. (1995) Walter, D. K., O’Dell, C. R., Hu, Xihai, & Dufour, R. J. 1995, PASP, 107, 686
- Wen & O’Dell (1995) Wen, Z., & O’Dell, C. R. 1995, ApJ, 438, 784
- Zapata et al. (2006) Zapata, L. A., Ho, P. T. P., Rodríiguez, O’Dell, C. R., Zhang, Q., Muench, A. 2006, ApJ, in press
- Zapata et al. (2005) Zapata, L. A., Rodríguez, L. F., Ho, P. T. P., Zhang, Q., Qi, C., & Kurtz, S. E. 2005, ApJ, 630, L85
- Zapata et al. (2004) Zapata, L. A., Rodríguez, L. F., Kurtz, S. E., O’Dell, C. R., & Ho, P. T. P. 2004, ApJ, 610, L121