The micro-Jy Radio Source Population: the VLA-CDFS View
Abstract
We analyse the 267 radio sources from our deep (flux limit of 42 Jy at the field center at 1.4 GHz) Chandra Deep Field South 1.4 and 5 GHz VLA survey. The radio population is studied by using a wealth of multi-wavelength information, including morphology and spectral types, in the radio, optical, and X-ray bands. The availability of redshifts for of our sources allows us to derive reliable luminosity estimates for the majority of the objects. Contrary to some previous results, we find that star-forming galaxies make up only a minority () of sub-mJy sources, the bulk of which are faint radio galaxies, mostly of the Fanaroff-Riley I type.
1. The VLA-CDFS Survey
The extragalactic radio source population ranges from normal galaxies with luminosities W/Hz to galaxies whose radio emission is as much as times greater owing to regions of massive star formation or to an active galactic nucleus (AGN). The population of radio sources in the sky with flux densities mJy is dominated by AGN driven emission generated from the gravitational potential associated with a supermassive black-hole in the nucleus. For these sources, the observed radio emission includes the classical extended jet and double lobe radio source as well as compact radio components more directly associated with the energy generation and collimation near the central engine of the AGN. Below 1 mJy there is an increasing contribution to the radio source population from synchrotron emission resulting from relativistic plasma ejected from supernovae associated with massive star formation in galaxies or groups of galaxies, often associated with mergers or interactions (e.g., Windhorst et al. 1995; Richards et al. 1998; Fomalont et al. 2002). However, the mix of star formation and AGN related radio emission and the dependence on epoch is not well determined, although the commonly accepted view ascribes to star-forming galaxies a major role at these faint fluxes.
The Chandra Deep Field South (CDFS) area is part of the Great Observatories Origins Deep Survey (GOODS) and as such is one of the most intensely studied region of the sky. High sensitivity X-ray observations are available from Chandra (Giacconi et al. 2002; Lehmer et al. 2005). The GOODS and Galaxy Evolution from Morphology and Spectral energy distributions (GEMS) multiband imaging programs using the HST Advanced Camera for Surveys (ACS) give sensitive high resolution optical images (Giavalisco et al. 2004; Rix et al. 2004). Ground based imaging and spectroscopy are available from the ESO 2.2m and 8m telescopes, and infrared observations from the Spitzer space Telescope.
We observed the CDFS with the NRAO Very Large Array (VLA) for 50 hours at 1.4 GHz mostly in the BnA configurations in 1999 and 2001, and for 32 hours at 5 GHz mostly in the C and CnB configurations in 2001. The effective angular resolution was and the minimum root-mean-square (RMS) noise as low as Jy per beam at 1.4 GHz and Jy per beam at 5 GHz. A total of 267 radio sources were catalogued at 1.4 GHz, 198 of which are in a complete sample with signal-to-noise ratio (SNR) greater than 5 and located within 15′ of the field center. The corresponding flux density limit ranges from 42 Jy at the field center to 125 Jy near the field edge. These deep radio observations complement the larger area, but less sensitive lower resolution observations of the CDFS discussed by Afonso et al. (2006).
Our set of ancillary data is quite unique and allows us to shed new light on the nature of the sub-mJy radio source population. These data include: a) reliable optical/near-IR identifications for of the radio sources; b) optical morphological classification for of the sample; of these: 38% are spiral or interacting, 30% are elliptical or lenticular, 16% are compact, and 15% are irregular or complex; c) redshift information for 186 () of the objects: 85 spectroscopic (32%) and 101 photometric (38%). The redshift distribution covers the range 0.03 – 3.7 and peaks at , with a sharp cut-off at . The mean redshift is ; d) X-ray detections for 85 () of the objects, upper limits for all the others.
We present here preliminary results on the sub-mJy source population of the VLA-CDFS. More details on the VLA-CDFS can be found in a series of four papers, which address the radio data (Kellermann et al. 2007, in preparation), the optical and near IR counterparts to the observed radio sources (Mainieri et al. 2007, in preparation), their X-ray spectral properties (Tozzi et al. 2007, in preparation), and the source population (Padovani et al. 2007, in preparation). Throughout this paper spectral indices are written and the values km s-1 Mpc-1, , and have been used.
2. The sub-mJy number counts
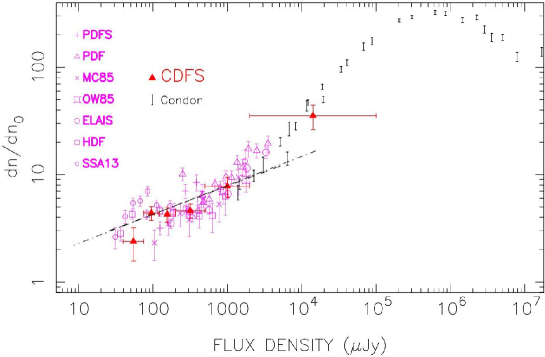
Fig. 1 shows the counts of sources at 1.4 GHz over the entire range of observed flux densities. The highest density points are based on a compilation from Condon (2006, p.c.). Various studies over many decades have shown that there are three regions of the counts: a) Jy, where the counts are rising with respect to Euclidean counts, due to the strong evolution of luminous quasars and radio galaxies; b) 3 mJy – 1 Jy, still dominated by quasars and radio galaxies, and characterized by a drop-off predominantly caused by the redshift effects and the cutoff above in the density of these luminous radio sources; c) mJy, where the counts flatten closer to Euclidean, well above the extrapolation from higher flux densities, and the field to field scatter appears to increase below about 400 Jy. This flattening of the slope of the counts, now observed in the flux density range Jy, is produced by a population of objects, which is now dominant in the counts. The characterization of this population is the major goal in the study of weak radio sources and of our project.
3. The sub-mJy population
To shed light on the sub-mJy population, we start by evaluating a measure of the radio-to-optical flux ratio, . About of our sources have k-corrected 111 values have been k-corrected using templates typical for that class or, in the case of sources without morphological classification, assuming a template which was the average between ellipticals and spirals values above the star-forming regime, , with some of our sources reaching extremely high values of , equivalent to radio-to-optical ratios . It has been suggested that the radio-to-optical flux ratio cannot be used to discriminate between AGN and star-forming galaxies (e.g., Afonso et al. 2005; Barger et al. 2006). We find this to be the case at low () values, where there is a large overlap between the two classes. However, above this value practically only AGN are present amongst the classified sources. Note that a sample with a brighter magnitude cutoff would get very different results. For example, for , only of the sources would have values beyond the star-forming regime. This is an important point, which might explain some previous results (see also Gruppioni et al. 1999).
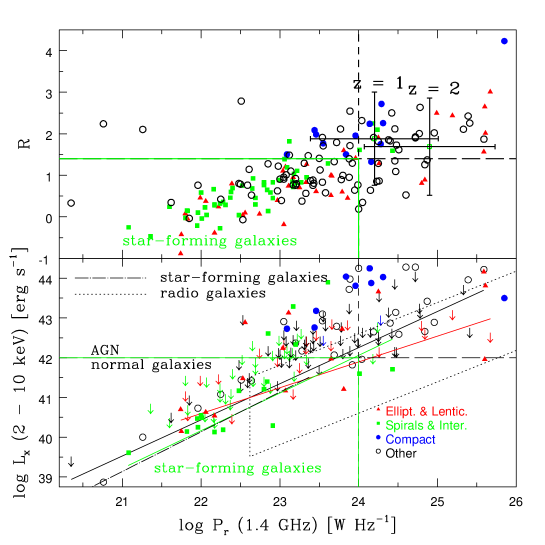
Fig. 2, top, which plots versus the 1.4 GHz radio power for our sample, shows that the majority (92%) of spiral and interacting galaxies fall in the region typical of star-forming galaxies, i.e., W/Hz; most of them (90%) have also . Ellipticals and lenticulars span a very large range of radio powers, consistent with that of low-luminosity (e.g., Fanaroff-Riley type I) radio-galaxies, while all compact sources are consistent with being radio-loud AGN. Therefore, despite the substantial overlap at low powers between ellipticals and spirals, the various types have quite distinct radio powers. Namely, , , , and for spirals and interacting, ellipticals and lenticulars, compact, and ”other” sources (i.e., without morphological classification) respectively. The latter have the largest values and a distribution of radio powers which is significantly different () from that of spiral and interacting galaxies, but similar to that of ellipticals. Furthermore, the objects without redshifts have quite faint optical magnitudes and are therefore very likely characterized by higher than average redshifts. For estimated or , the bulk of these sources ends up in the region typical of radio galaxies.
Under the assumptions that: a) star-forming galaxies are identified with spirals and interacting galaxies; b) star-forming galaxies alone occupy the bottom-left quadrant of Fig. 2, top, their fraction would be of the objects with redshift information. However, only of these sources have a definite spiral morphology, and their maximum fraction (excluding ellipticals and lenticulars) is bound to be . Moreover, as most of the objects without redshift information have relatively large values and therefore are unlikely star-forming galaxies, the total fraction of such objects in the sample is .
Fig. 2, bottom, shows (2 – 10 keV) vs. for the sources with redshift. Using ASURV (Lavalley et al. 1992) to take into account the upper limits on , we find a correlation between the two powers for the whole sample (, ). Moreover: a) the large majority (80%) of spiral and interacting galaxies have X-ray detections consistent with powers typical of galaxies and not of AGN ( erg/s); the best fit correlation using ASURV overlaps almost exactly with the X-ray-radio power relationship for nearby star-forming galaxies (dot-dashed line); b) the opposite is true for compact sources, which all have X-ray powers erg/s and times larger than the other classes, at a given radio power; this is consistent with the idea that these sources are mostly radio-loud AGN (see also Fig. 2, top); c) ellipticals and lenticulars span a very large range of X-ray powers (similarly to what observed in the radio band), consistent with that of radio-galaxies; again, there is substantial overlap at low X-ray powers between ellipticals and spirals, with at least 55% of the former having erg/s; d) the ”other” sources cover a very large range in radio and X-ray powers, with the best fit correlation mostly into the radio-galaxies area. Finally, as was the case for the radio powers, the various types have quite distinct X-ray powers. Namely, , , , and for spirals and interacting, ellipticals and lenticulars, compact, and ”other” sources respectively. The X-ray power distribution for the sources without morphological classification is different () from that of spiral galaxies but similar to that of ellipticals.
Similarly to Fig. 2, top, we can define the bottom-left quadrant as that of star-forming galaxies. If star-forming galaxies alone occupy this quadrant, their fraction would be of the objects with redshift and X-ray information. However, only about half of these sources have a definite spiral morphology, and their maximum fraction (excluding ellipticals and lenticulars) is bound to be . On the other hand, some of the sources with upper limits above erg/s might have X-ray powers below that value. Therefore, the total fraction of star-forming galaxies in the sub-sample with redshift information is likely to be .
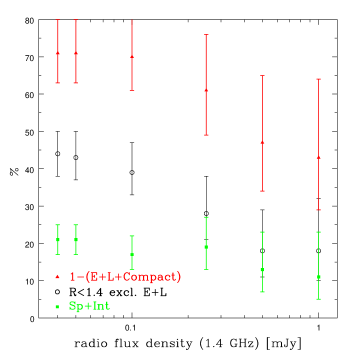
Fig. 3 shows the percentage of various morphological types as a function of radio flux density for the complete sample. The fraction of spirals and interacting galaxies increases from at 1 mJy to at the survey limit, while that of ellipticals, lenticulars, and compact sources (i.e., the AGN, shown in the figure as ) decreases from to . Hence, sub-mJy star-forming galaxies down to Jy can make up at most of the total. However, given the evidence presented above, a stronger upper limit is provided by the fraction of sources having excluding the sources with elliptical and lenticular morphology, that is . Therefore, star-forming galaxies make up only a minority, between and (), of sub-mJy sources, the bulk of which are faint radio galaxies, mostly at relatively low powers and hence of the Fanaroff-Riley I type.
The VLA is operated by NRAO, a facility of the NSF under cooperative agreement with Associated Universities, Inc.
References
- Afonso et al. (2005) Afonso, J., et al. 2005, ApJ, 624, 135
- Afonso et al. (2006) Afonso, J., et al. 2006, AJ, 131, 1216
- Barger et al. (2006) Barger, A. J., Cowie, L. L., & Wang, W.-H., 2006, ApJ, in press (astro-ph/0609374)
- Fomalont et al. (2002) Fomalont, E. B., et al. 2002, AJ, 123, 2402
- Giacconi et al. (2002) Giacconi, R., et al. 2002, ApJS, 139, 369
- Giavalisco et al. (2004) Giavalisco, M., et al. 2004, ApJ, 600, L93
- Gruppioni et al. (1999) Gruppioni, C., Mignoli, M., & Zamorani, G. 1999, MNRAS, 304, 199
- Lavalley et al. (1992) Lavalley, M., Isobe, T., & Feigelson, E. 1992, ASP Conf. Ser. 25: Astronomical Data Analysis Software and Systems I, 25, 245
- Lehmer et al. (2005) Lehmer, B. D., et al. 2005, ApJS, 161, 21
- Ranalli, Comastri & Setti (2003) Ranalli, P., Comastri, A., & Setti, G. 2003, A&A, 399, 39
- Richards et al. (1998) Richards, E. A., et al. 1998, AJ, 116, 1039
- Rix et al. (2004) Rix, H.-W., et al. 2004, ApJS, 152, 163
- Windhorst et al. (1995) Windhorst, R. A., et al. 1995, Nature, 375, 471