Detecting First Star Lyman- Spheres through Gravitational Telescopes
Abstract
Lyman- spheres, i.e. regions around the first stars which are illuminated by Lyman (hereafter, Ly ) photons and show 21cm absorption feature against the CMB, are smoking guns at the dawn of the reionization epoch. Though overwhelming radio foreground makes their detections extremely difficult, we pointed out that, strong gravitational lensing can significantly improve their observational feasibility. Since Ly spheres have sizes, comparable to the caustic size of galaxy clusters, individual images of each strongly lensed Ly sphere often merge together and form single structures in the 21cm sky with irregular shapes. Using high-resolution -body CDM simulations, we found that the lensing probability to have magnification bigger than is . This results in strongly lensed Ly spheres across the sky, which should be the primary targets for first detections of Ly spheres. Although the required total radio array collecting area for their detection is large ( km2), the design of long fixed cylindrical reflectors can significantly reduce the total cost of such array to the level of the square kilometer array (SKA) and makes the detection of these very first objects feasible.
Subject headings:
cosmology: galaxy clusters – gravitational lensing1. INTRODUCTION
In the concordance cosmology, first stars and galaxies formed at redshift in dark matter halos of mass . Inefficient gas cooling, due to the absence of heavy elements, possibly results in first stars of mass around several hundred solar mass. These first stars emit numerous near Ly photons directly. Furthermore, secondary Ly photons can be generated through the impact excitations by electrons produced by the X-rays from the high temperature stellar photosphere. Through frequent Ly scattering in surrounding neutral hydrogen atoms, the neutral hydrogen spin temperature is coupled to its kinetic temperature. Since the kinetic temperature is lower than the CMB temperature at , a region of 21cm absorption against the CMB develops around each first stars/galaxies (Cen, 2006; Chen & Miralda-Escudé, 2006). Such regions, named “Ly spheres” or 21cm absorption “halos”, are about of -, much larger than the first stars/galaxies themselves and are possibly the first distinctive structures in the universe accessible to observations. As unique features of first stars/galaxies, they will allow direct probe of the very first stage of the reionization process. This approach is quite complementary to the statistical approach of the 21cm observaton, such as measuring 21cm intensity power spectrum and bispectrum. It will shed light directly on the reionization mechanism and could break degeneracies arising in the modeling of statistical quantities, e.g., degeneracy in various reionization mechanisms.
However, detections of these first structures are extremely difficult, due to overwhelming radio foregrounds and stringent resolution requirement. For 21cm absorption “halos” around stars in the dark matter halos (Cen, 2006), a total collecting area of km2 is required to resolve them and a of km2 is required to detect them (Zhang et al., 2006). Ly spheres around the first stars which formed in dark matter halos, as discussed in Chen & Miralda-Escudé (2006), are even smaller () with weaker signals. Their detection requires km2. Such mission would be extremely difficult.
Fortunately, as shown in this paper, strong gravitational lensing of these Ly spheres makes the first detection significantly easier. Galaxy clusters, the so called gravitational telescopes, have the power to magnify these objects by a factor of or more and thus can significantly improve the observational feasibility. As estimated in this paper, a survey capable of detecting these strongly lensed Ly spheres can be built with cost comparable to the square kilometer array (SKA111http://www.skatelescope.org/). Such survey will map the 21cm sky to very high accuracy over a large fraction of the sky and a wide redshift range. It will have significantly impact on both the fields of cosmology and reionization. For the cosmology part, it will allow precision lensing reconstruction through the 21cm background (Cooray, 2004; Pen, 2004; Zahn & Zaldarriaga, 2006) and precision measurement of the matter power spectrum (Loeb & Zaldarriaga, 2004). Furthermore, it will also resolve 21cm absorption ’halos’, which again have powerful cosmological applications (Cen, 2006; Zhang et al., 2006).
Using strong lensing to detect high objects is not a new idea (see Fort & Mellier (1994) for an early review). Using this method, several high redshift galaxies at - have been detected (Pelló et al., 2004; Richard et al., 2006). Ly spheres lie at higher redshifts, so the probability to be highly magnified is slightly higher. More importantly, strong lensing of Ly spheres carry a feature distinctive to that of ordinary galaxies, explained as follows.
Ordinary galaxies at cosmological distance typically have size, this size is usually much smaller than the caustic size of lens. So images of lensed galaxies are often separated. However, Ly spheres have size , such a size is comparable to the caustic size of galaxies clusters. As a consequence, individual images of each strongly lensed Ly sphere often merge together and form a single structure in the 21cm sky with irregular shapes. Although individual images of larger source usually has lower magnification, the merged image can still have a larger magnification. This effect reduces the requirement on . Since there are hundreds of billions of Ly spheres, even a tiny probability to have a large magnification would result in a significant number of strongly lensed merged images. Interferometer array with km2 would be sufficient to detect these lensed Ly spheres.
The outline of this paper is as follows. In §2, we discuss the high resolution N-body numerical simulations we use and the method we employ to calculate the lensing probability. In §3, we describe the strong lensing features of Ly spheres and present the result of the lensing probability. In §4 we estimate the observational requirements and feasibility and we summarize our results in §5.
2. NUMERICAL SIMULATION AND LENSING METHOD
The cosmological model considered here is the concordance CDM model with the dimensionless matter density , the cosmological constant , the shape parameter , , where is the Hubble constant in units of and we take . A cosmological N-body simulation with a box size , which was generated with our vectorized-parallel code (Jing & Suto 2002; Jing 2002), is used in this paper. The simulation uses particles, so the particle mass is . The gravitational force is softened with the form (Hockney & Eastwood 1981) with the softening parameter taken to be . Since strongly magnified images are produced mostly at radii in the lens plane, the resolutions are sufficient (see also Dalal eh al. 2004).
Dark matter halos are identified with the friends-of-friends method using a linking length equal to 0.2 times the mean particle separation. The halo mass is defined as the virial mass enclosed within the virial radius according to the spherical collapse model (Kitayama & Suto 1996; Bryan & Norman 1998; Jing & Suto 2002).
For a given cluster, we calculate the smoothed surface density maps using the method of Li et al. (2006). Specifically, for any line of sight, we obtain the surface density on a grid covering a square of (comoving) side length of centered on each cluster. The projection depth is chosen to be . Notice that the size of the region is chosen such that particles within a few virial radii are included. Particles outside this cube and large-scale structures do not contribute significantly to the lensing cross-section (e.g. Li et al. 2005; Hennawi et al. 2007). Our projection and smoothing method uses a smoothed particle hydrodynamics (SPH) kernel to distribute the particle mass on a three-dimension grid and then integrate along the line of sight to obtain the surface density (see Li et al. 2006 for detail). In this work, the number of neighbors used in the SPH smoothing kernel is fixed to be 32. We calculate the surface density along three perpendicular directions for each cluster. Once a surface density map is obtained, we compute the cross-section of highly magnified images following the method given in Li et al. (2005).
We put the sources at , a typical redshift of Ly spheres. The dependence of strong lensing probability on at is negligible, due to the weak dependence of source distance on and the fact that no clusters at redshift beyond several. We simplify the background sources as spheres with diameter . This choice of source size roughly covered the source size in Chen & Miralda-Escudé (2006). Throughout this paper, we have neglected the difference in the 21cm brightness temperature across Ly spheres. Since gravitational lensing preserves the 21cm brightness temperature, from the mapping between source position and lensing position, the temperature distribution can be recovered straightforwardly.
We generate a large number of background sources within a rectangle box. This rectangle is chosen to enclose all the high-magnification regions( and ) that can potentially form highly magnified images. Such regions are much larger than the size of caustics and provide a reliable lensing cross section of image with . The sources are located on a regular grid that cover this rectangle with a resolution of . For each source, ray-tracing is used to find the resulting image(s). The magnification of each image is defined as the ratio of the image and source’s areas. The resolution in image plane is kept as for sources with and for , so the total number of pixel is large than 40 for the image with magnification larger than 2. We calculate the total cross sections of the top 10002000 most massive clusters in each simulation output. Finally, we obtain the average cross section per unit comoving volume by:
| (1) |
where is the average cross-section of the three projections of the -th cluster at redshift , and is the comoving volume of the simulation box. The optical depth can then be calculated as:
| (2) |
where is the angular diameter distance to the source, is the source redshift, and is the proper volume of a spherical shell with redshift from to . We used 28 simulation outputs with redshift from 0.2 to 3. The integration step size is the same as the redshift interval of simulation output ().
3. Strong lensing probability
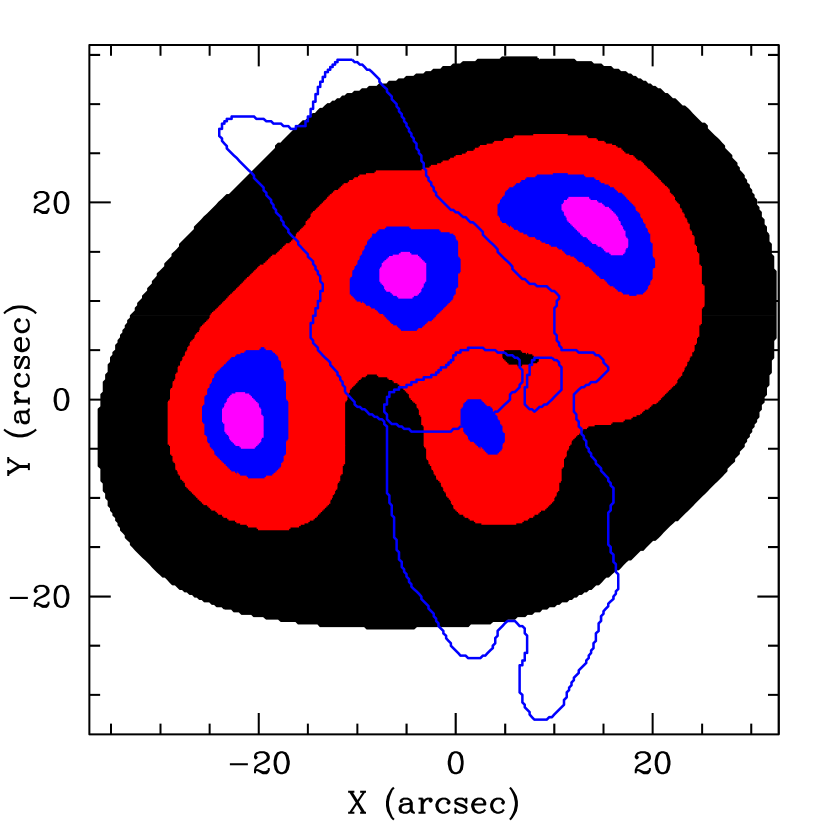
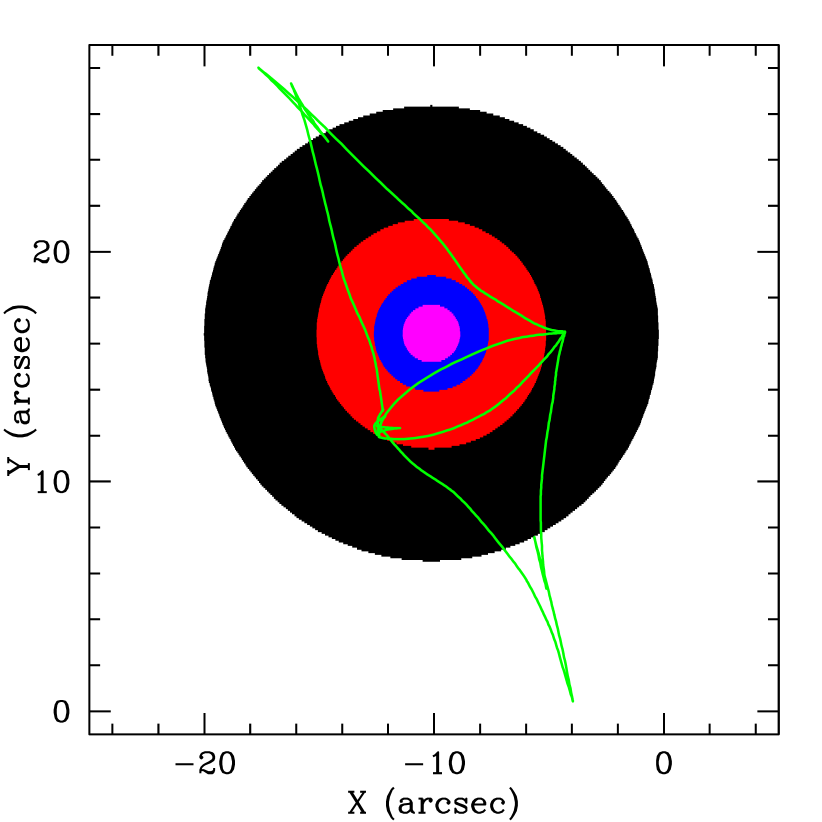
To illustrate the signatures of lensed Ly spheres, we choose a cluster at as the lens. By varying the size of the Ly sphere, we find an interesting lensing feature. Usually, the magnification decreases quickly with expanding source size, because the magnification which close to the caustic follows , where is the distance to caustic from inner. On the other hand, there are also two effects to increase the high magnification region. When a source is close to but outside of the caustic, the magnification is modest for a point source, but for an extended source which is large enough to cover the caustic, a highly magnified image results. So the finite source can extend the high magnification region to the outside of the caustics. When a source is inside but faraway from the caustics, it will create multiple images with also modest magnifications, but if the source is large enough to match the caustic(s), some or all of these images will merge together, then the final magnification is still very high. Fig. 1 shows such merger effect of images. The lens is at redshift 0.36 with mass, and the sources are fixed at redshift 30. Notice, there are no overlaps for a merged image. The incomplete images connect together along the critical curve(s) and build up such a larger image.
Since the typical size of Ly sphere is and is indeed comparable to the size of the caustics, it is frequent that lensed Ly sphere will show up as a single merged image. The area of this image is a factor of of the source, where is the total magnification.
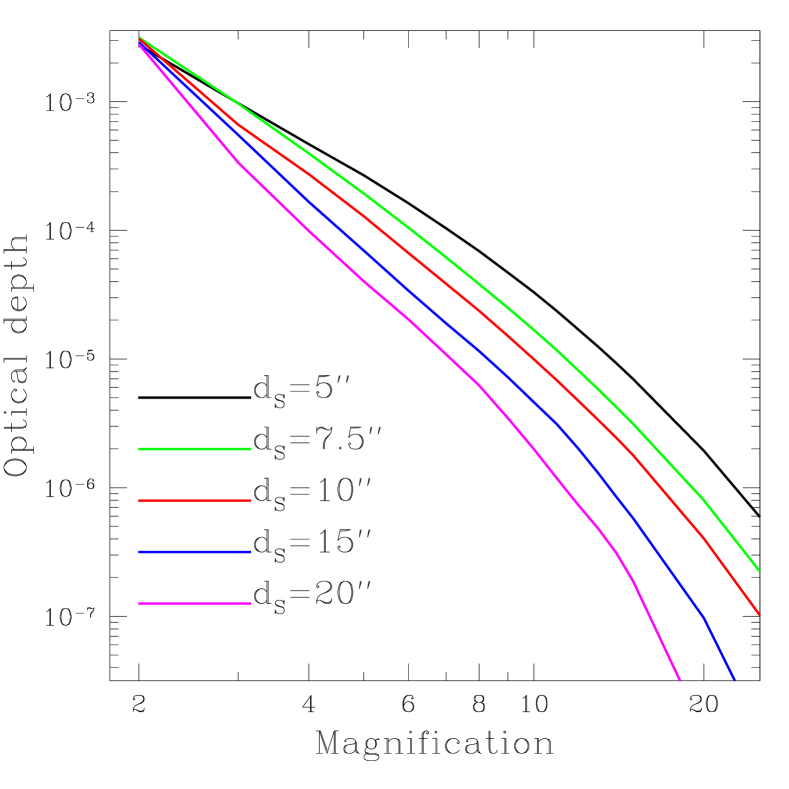
Fig. 2 shows the optical depth as function of magnification. For typical size of Ly spheres , there is probability to produce merged images. Since there are hundreds of billions Ly spheres, we expect to find hundreds of thousands lensed Ly spheres with .
3.1. Model uncertainties
We further investigate the completeness of our simulated cluster sample in mass and redshift range and thus the robustness of our predicted . Lower panels of fig. 3 show the differential probability distribution for the optical depth as a function of lens redshift, for various source sizes and magnification thresholds. The optimal lens redshift for larger source size and larger magnification threshold is lower. For the source size and investigated, the optimal lens redshift varies between 0.4 and 1. Thus cluster at redshift around 0.4 to 1 will be most likely responsible for strong lensing of Ly spheres.
Top panels of fig. 3 show differential cross section as a function of logarithm lens mass, , where is the virial mass of individual lens cluster and is the summation of the mean cross-sections of all clusters. Since the optimal redshift is between and , we choose a median redshift . For this redshift, we select the top 2000 most massive clusters in the simulation box. The low mass cut is about and the corresponding number of particle within in virial radius is . The small cluster has too small caustic(s) to highly magnify a big source. But when the source size is smaller, the source can have non-negligible probability to be strongly lensed by a less massive cluster, which may not be well resolved in our simulation. Meanwhile, when estimating the lens optical depth of small , contribution from less massive clusters may be also non-negligible for their huge abundance. Thus, for small and small source size, our cluster sample can be incomplete. Top left panel of Fig. 3 shows that this is the indeed case for source size and . However, for the more interesting case, and/or , contribution from clusters less massive than is negligible. Thus, our cluster sample is complete at low-mass end for sources. The last figure tells us that the optical depths are complete at low-mass end for for any size of source. Particularly, the lensing probability is at this magnification threshold.
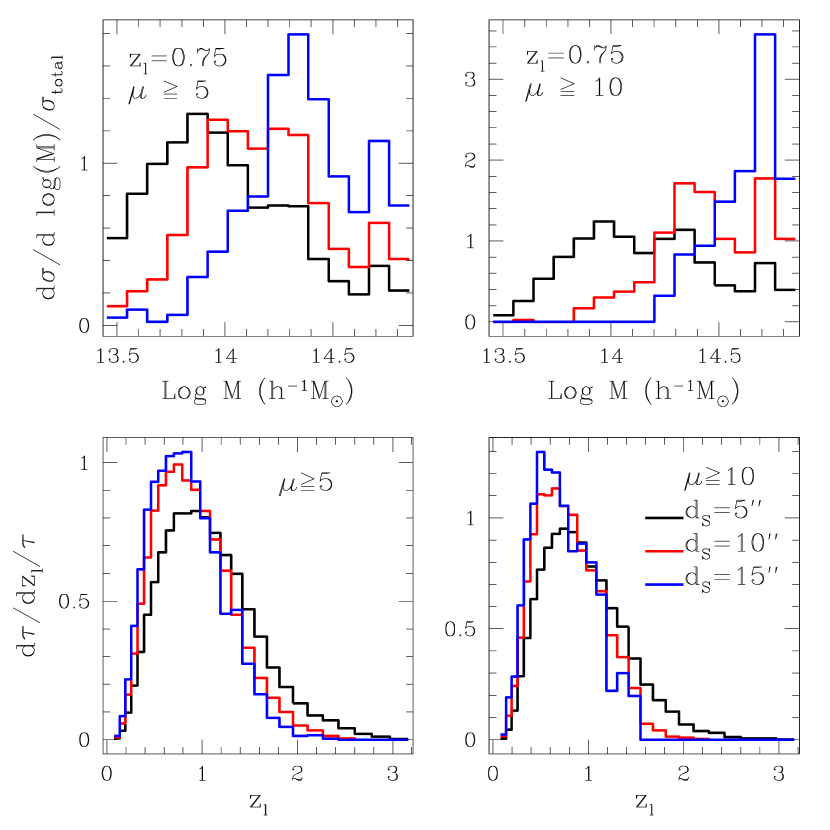
On the other hand, Fig. 3 implies that clusters more massive than still have non-negligible contribution. Due to the finite box size, massive clusters are not fairly represented in our simulation. The lensing probability of may be under-estimated by a factor no larger than for the lack of very massive clusters in our simulation.
As seen from Fig. 3, halos less massive than have negligible contribution to lensing. Thus, we do not expect galaxies, which are not included in our simulation, can affect the above result significantly. This can be further understood as follows. For an isothermal distribution of matter in galaxies, the Einstein radius arcsec. Since it is much smaller than the size of Ly spheres, it is not surprising that they do not contribute much to strong lensing of Ly spheres.
We have to say that the lensing probability we give here is just a low limit in the concordance model. The baryon effect is not taken into account. In the real universe, baryons account for roughly 20% of the total mass, which can cool (form stars) and sink toward the centers of clusters. The radiative cooling likely has two effects: it will increase the concentration of baryons at the center of clusters, and at the same time, make the clusters more spherical (e.g. Dubinski 1994; Kazantzidis et al. 2004). The former increases while the latter decreases the lensing cross-sections, and so the overall influence depends on which effect dominates. Meneghetti et al. (2003) and Puchwein et al. (2005) found that the increase in the lensing cross-section of giant arc due to baryon is quit modest, by a factor of for massive cluster and the the increase becomes larger for low-mass cluster. So, we can estimate the probability as if we take into account the baryon.
From the two top panels in fig. 3, we can see our cluster sample is usually incomplete at low-mass end (for small source and low magnification threshold) or at high-mass end (for large source and high magnification threshold). This leads to an under-estimation of the lensing probability by a factor of %. In this paper, we use thin lens approximation but the large-scale structures along the line of sight also should have additional contribution to the lensing probability although this is very modest (e.g., Li et al. 2005; Hennawi et al. 2007)
On the other hand, recent results from the three-year data of the Wilkinson Microwave Anisotropy Probe (WMAP) prefers lower and . than that in the concordance model (Spergel et al., 2006). Since the abundance of massive clusters decreases dramatically in this low universe, the number of giant arcs is a factor of lower than that in the concordance model (Li et al., 2006b). Roughly, we expect a similar decrease for the lensing probability of the Ly spheres. Despite of the baryon and other contributions we discussed above, we estimate the optical depth as .
The total number of Ly spheres across the sky is , depending on the cosmological parameters adopted and the redshift range (Chen & Miralda-Escudé, 2006). Since these Ly spheres have typical diameter , some of them apparently overlap along the line of sight. However, when they are visible in 21cm, they are also well separated in redshifts. The density of these spheres is between 0.1 to 1 comoving at redshifts 30, c.f. Fig. 5 of Chen & Miralda-Escudé (2006), while their diameter is about 20 kpc physical, or 600 kpc comoving, so they are well seperated and can be distinguished at different frequencies. As will be shown in next section, the optimal bandwidth of observation is about 20 kHz, which could easily distinguish these different spheres along the line of sight. There is some chance that within the Ly sphere another first star form, and produce another Ly sphere which overlaps with the first, the two spheres would be physically merged. This is however not common. The probablity of finding another halo within a Ly sphere is about 0.3 (Fig. 8, op.cit.), but given the short life time of the first stars, the chance of the two stars shine at the same time is even smaller. Of course, eventually as more and more of these spheres appear, a homogeneous Ly background is built up. At this point, the Ly flux induced spin temperature difference diminishes, and the Ly sphere become invisible. This happens before the physical overlap of the spheres, at a filling factor of about 0.1(see the discussion on the build up of Ly background in §4.1 of Chen & Miralda-Escudé (2006))
Given the probability to be amplified by a factor of or more, there will be at least of Ly spheres which are strongly lensed in the concordance model. A radio array with total collecting area km2 while keeping cost comparable to SKA is promising to detect many of them in years survey as the discussion bellow.
4. Observational feasibility
A large will significantly reduce the requirement on the resolution and r.m.s. noise of a radio survey. The exact number depends on the detailed array configuration. Without loss of generality, we focus on a configuration of arrays homogeneously distributed over a square with side length . For an optimal detection, the resolution should be similar to the size of the Ly sphere, Here, cm is the redshifted wavelength of the 21cm line. The residual noise per resolution pixel (with area ) is
Here, and is the total collecting area. The bandwidth is related to the comoving separation by . For the typical signal and typical comoving Ly sphere diameter Mpc (physical diameter kpc), assuming the integration = 1year, km2 is required to detect unlensed Ly spheres (Chen & Miralda-Escudé, 2006).
However, a factor of amplification in the area relaxes the requirement on resolution and thus the requirement on by a factor of . Since the differential brightness temperature does not change, to obtain the same S/N, can be reduced by a factor of , if and are kept fixed. Thus, for those highly amplified Ly spheres with , a radio array with km2 is sufficient.
A radio array with km2 can be built of fixed parabolic cylindrical reflectors (Peterson et al., 2006) with reasonable cost. Such design can reduce the cost to 222Private communication with Ue-Li Pen. m2. Given this number, the total cost can be controlled to be around one billion dollar, comparable to the estimated total cost of SKA, which has unit cost of m2. This design has large field of view (several thousand square degree at ) and can scan at least half the sky through the Earth rotation. Since the field view is large, the telescope does not need to point to specific regions of known galaxy clusters, although these regions are of primary interest in the process of data analysis. With these advantages, this design is appropriate for the detection of Ly spheres in blank sky.
5. Discussions and summary
The cluster which serves as gravitational lens may have radio emission, this could complicate the situation. However, we expect that the main mechanisms of radiation in the clusters–synchrotron and free-free– produce smooth frequency spectrum, so we should be able to disentangle these from the lensed 21cm signal. The cluster radio emission does increase the sky background noise, hence the boost in the signal to noise ratio is less than expected from the lensing magnification. However, radio observation of nearby clusters show that not all clusters have radio strong emission, if we avoid those with FR-II radio sources, then many clusters have radio emission power less than at 20 cm (De Young, 2002). For a cluster at cosmological distance ( Mpc), the corresponding brightness temperature of such a cluster is much less than the galactic synchrotron foreground, so the increase of noise would not be significant.
Ideally, one wants to de-lens individual Ly spheres to directly measure their intrinsic properties. However, clusters with at (Fig. 3) contribute a non-negligible fraction of the important lenses. These cluster are generally sub-critical for sources at , faint in X-rays and SZ, and their mass reconstruction would therefore be difficult. Furthermore, the angular resolution we consider here is comparable to the size of the (lensed) spheres. This makes delensing very difficult, even if detailed lens information is given.
In the worst case that delensing of individual Ly spheres is not feasible, their direct detection is still valuable. The direct observable, the number of detected (strongly lensed) Ly spheres as a function of redshift, is already valuable for understanding the history of first star formation and reionization mechanism. By the time of successful Ly sphere detection, galaxy and cluster surveys will be significantly advanced. Cluster abundance and lensing efficiency are promised to be well measured through observations of strong and weak lensing of galaxies, as well as the X-ray and SZ effect of clusters Given these lens information, the prediction of the detected number of spheres then relies only on the source property. Comparing the prediction with observations will then reveal the nature of the reionization process.
As a summary, galaxy cluster is a powerfully telescope to magnify first star Ly spheres. Since the size of Ly spheres is comparable to the caustic size of clusters, the lensed images often merger together. This distinctive lensing feature significantly improves the observational feasibility of these objects. Clusters with in the redshift range are responsible for most of the strong lensing events (fig. 3). Regions where these clusters cover should be the primary locations looking for Ly spheres in the reconstructed 21cm brightness temperature maps. Cylindrical reflector array with km2 and reasonable cost comparable to that of SKA should be able to detect at least - strongly lensed Ly spheres and open a window into the very first objects in the Universe.
Acknowledgment
We thank Ue-Li Pen for helpful information on the design of cylindrical reflectors. We thank Yipeng Jing, Shude Mao, XiangPing Wu and the anonymous referee for useful comments. This work is supported by grants from the NSFC (No. 10373012, 10533030, 10525314, 10533010), the Shanghai Key Projects in Basic research (No. 04JC14079 and 05XD14019), and the CAS grant KJCX3-SYW-N2.
References
- Bryan & Norman (1998) Bryan, G. L., Norman, M. L. 1998, ApJ, 495, 80
- Cen (2006) Cen, R. 2006, ApJ, 648, 47
- Chen & Miralda-Escudé (2006) Chen, X. & Miralda-Escudé, J. 2006, astro-ph/0605439
- Cooray (2004) Cooray, A. 2004, NewA, 9, 173
- Dalal eh al. (2004) Dalal, N., Holder, G., Hennawi, J.F. 2004, ApJ, 609, 50
- De Young (2002) De Young, D. S., 2002, The Physics of Extragalactic Radio Sources (The University of Chicago Press, Chicago) Chap. 11.
- Dubinski (1994) Dubinski, J. 1994, ApJ, 431, 617
- Fort & Mellier (1994) Fort, B. & Mellier, Y. 1994, A&A, 5, 239
- Hennawi et al. (2007) Hennawi, J. F., Dalal, N., Bode, P., Ostriker, J. P. 2007, ApJ, 654,714
- Hockney & Eastwood (1981) Hockney, R. W., & Eastwood, J. W. 1981, Computer Simulation Using Particles (McGraw-Hill: New York)
- Jing (2002) Jing, Y. P. 2002, MNRAS, 335, L89
- Jing & Suto (2002) Jing, Y. P. & Suto Y. 2002, ApJ, 574, 538
- Kazantzidis et al. (2004) Kazantzidis, S., Kravtsov, A. V., Zentner, A. R., Allgood, B., Nagai, D., Moore, B. 2004, ApJ, 611, L73
- Kitayama & Suto (1996) Kitayama, T. & Suto, Y. 1996, MNRAS, 280, 638
- Li et al. (2005) Li, G. L., Mao, S., Jing ,Y. P., Bartelmann, M., Kang, X., Meneghetti, M. 2005, ApJ, 635, 795
- Li et al. (2006) Li, G. L., Mao, S., Jing, Y. P., Kang, X., Bartelmann, M. 2006, ApJ, 652, 43
- Li et al. (2006b) Li, G. L., Mao, S., Jing, Y. P., Mo, H. J., Gao, L., Lin W. P. 2006b, MNRAS, 372, L73
- Loeb & Zaldarriaga (2004) Loeb, A. & Zaldarriaga, M. 2004, PhRvL, 92, 211301
- Meneghetti et al. (2003) Meneghetti, M., Bartelmann, M., Moscardini, L. 2003b, MNRAS, 346, 67
- Pelló et al. (2004) Pelló, R., Schaerer, D., Richard, J., Le Borgne, J.F. & Kneib, J. P. 2004, A&A, 416, L35
- Pen (2004) Pen, U.-L. 2004, New Astronomy, 9, 417
- Peterson et al. (2006) Peterson, J. B., Bandura, K. & Pen, U.-L. 2006 astro-ph/0606104
- Puchwein et al. (2005) Puchwein, E., Bartelmann, M., Dolag, K., Meneghetti, M. 2005, A&A, 442, 405
- Richard et al. (2006) Richard, J., Pelló, R., Schaerer, D., Le Borgne, J. F., & Kneib, J. P. 2006, A&A, 456, 861
- Spergel et al. (2006) Spergel, D., et al. 2006, astro-ph/0603449
- Zahn & Zaldarriaga (2006) Zahn, O. & Zaldarriaga, M. 2006, ApJ, 653, 922
- Zhang et al. (2006) Zhang, P., Zheng, Z., & Cen, R. 2006, astro-ph/0608271