X-ray Spectral and timing properties of the black hole x-ray transient Swift J1753.5 – 0127
Abstract
We have carried out detailed analysis on the black hole candidate (BHC) X-ray transient Swift J1753.50127 observed by the Rossi X-Ray Timing Explorer (RXTE) during its outburst in 2005 – 2006. The spectral analysis shows that the emissions are dominated by the hard X-rays, thus revealing the low/hard state of the source during the outburst. The peak luminosity is found lower than the typical value of balancing the mass flow and evaporation of the inner edge of disk (Meyer-Hofmeister, 2004). As a result, the disk is prevented from extending inward to produce strong soft X-rays, corresponding to the so-called high/soft state. These are the typical characteristics for a small subset of BHCs, i.e. those soft X-ray transients stay at the low/hard state during the outburst. In most observational time, the QPO frequencies are found to vary roughly linearly with the fluxes and the spectral indices, while the deviation from this relationship at the peak luminosity might provide the first observational evidence of a partially evaporated inner edge of the accretion disk. The anti-correlation between the QPO frequency and spectral color suggests that the global disk oscillation model proposed by Titarchuk & Osherovich (2000) is not likely at work.
1 INTRODUCTION
Galactic black hole binaries are classified by their X-ray features, such as the strength and temperature of the soft multi color blackbody component, the hard X-ray emission, the X-ray luminosity and timing properties (Mitsuda et al., 1984; van der Klis, 1995; Remillard & McClintock, 2006). Black hole X-ray transient outbursts are known to pass through a number of X-ray spectral states over the course of their outbursts; these spectral states are also associated with the specific jet behaviors (van der Klis, 1995, 2000, 2005; McClintock & Remillard, 2006). Several states (very high state, high/soft state, intermediate state, low/hard state, quiescent state etc.) have been identified to characterize black hole accretion (Tanaka & Lewin, 1995; van der Klis, 1994; Poutanen et al., 1999; McClintock & Remillard, 2006). The soft state, commonly described as keV thermal emission, was usually observed when the source was at higher luminosity, thereby prompting the name“high/soft state”. The hard state, with a typical photon index , is generally observed when the source was in low luminosity, hence named ”low/hard state”. The quiescent state, appearing at low luminosity levels, characterizes the long periods of quiescence of transient systems. In the very high state, black hole becomes exceedingly bright ( 0.2 ), and its X-ray spectrum displays a substantial nonthermal radiation, which may constitute 40–90% of the total flux. In such a case, the photon index is typically , which is steeper than that () observed in the hard state (McClintock & Remillard, 2006). More than 130 soft X-ray transients (SXTs) have been found (Brocksopp et al., 2004) up to now, and their number is growing every year. In particular, there are a number of supposed black hole SXTs which do not show a soft component in their X-ray spectra. Instead they remain in the low/hard state (the X-ray emission was dominated by the power-law spectra) throughout the outburst (Brocksopp et al., 2004). In addition, there are very similar X-ray spectral properties in this subset, but the light curve morphologies of these sources are very different, including the X-ray, optical and radio light curves. As declaimed, Swift J1753.50127 , a newly detected black hole X-ray transient, likely belongs to the subset of BHCs (Miller et al., 2006).
A new, bright, variable -ray and X-ray transient source, Swift J1753.50127 , was detected firstly by the Swift BAT on May 30, 2005 (Palmer et al., 2005), then its position, , (J2000.0) with an estimated 90% confidence uncertainty of , was given by X-ray Telescope(XRT) (Burrows et al., 2005). Swift J1753.50127 was also clearly detected in soft X-ray with the Swift X-ray Telescope (XRT) (Morris et al., 2005). Later on, its optical counterpart was observed by the MDM 2.4 m telescope on July 2, 2005 (Halpern, 2005), and its radio counterpart was detected at 1.7 GHz with the Multi-Element Radio-Linked Interferometer Network (MERLIN) on July 3, 2005. Further radio observations on July 4 and 5 indicate that this source is variable, strengthening the likely association with the X-ray transient (Fender et al., 2005). These radio observations suggest that the source might in its low/hard state during the outburst.
To fully understand the BHC behavior of X-ray transient, it is instructive to outline the source properties for the whole range of X-ray flux from the maximum of the outburst to quiescence, so as for this purpose RXTE has proved to be an extremely unique tool for studying the transients. Using the RXTE and XMM-Newton data, Miller et al. (2006) have analyzed the spectra of Swift J1753.50127 when the source approached the quiescence state. Their results tend to support a cool (kT keV) accretion disk around the central compact object, which may locate at/near the innermost stable circular orbit (ISCO). Furthermore, the detection of a 0.6 Hz quasi-periodic oscillation (QPO) by RXTE and the measurement of a hard power-law spectrum by Swift/XRT (Morris et al., 2005) suggest a hard state for this source (Morgan et al., 2005) during the outburst.
In this paper, we have analyzed the TOO observations carried out by Proportional Counter Array (PCA) and High-Energy X-ray Timing Experiment (HEXTE) onboard RXTE, and investigated in detail the evolutions of the outburst, with the focus on the spectral and the timing properties. The paper is organized to show the observations and data reduction in Sec.2, the presentation of the main results in Sec.3, and finally the discussion and conclusion are performed in Sec.4 and Sec.5.
2 OBSERVATION AND DATA REDUCTION
Onboard the RXTE satellite there are three detectors. The PCA and HEXTE are the two co-aligned spectrometers with narrow fields of view. They provide a broad energy coverage from 2 to 250 keV. Another detector, the so-called ASM, is used to track the long-term behavior of the source in the energy band 2-13 keV. The PCA consists of 5 non-imaging Xe multiwire proportional counter units (PCUs). Each unit covers the energy 2-60 keV and has the time resolution ( s). PCA has field of view and provides in sum the collecting area of . The HEXTE comprises two clusters, each with 4 scintillation detectors sensitive to photons in the range 15-250 keV, collimated to view a common field, and these eight detectors in the clusters provide a total collecting area of 1600 (Gruber et al., 1996).
The RXTE TOO data of Swift J1753.50127 are available for observations from July 6, 2005 to March 11, 2006 (Fig.1). The software package HEASOFT version 6.0 was adopted for reduction of the PCA data. We get rid of the data for which the angle of the source above the Earth limb is less than 10 degrees or for which the pointing offset is greater than 0.02 degrees. We take the Standard-2 mode data ( 16 s time resolution and 129 energy channels between 2-60 keV) for energy spectral analysis, the Event mode E_125us_64M_0_1s ( s time resolution and 64 energy channels between 2-60 keV) and the Standard-1 mode (0.125 s time resolution and 1 energy channel between 2-60 keV) for timing analysis. Only proportional counter units (PCUs) 0 and 2 were always active during our observation, but the propane layer on PCU-0 was lost when a micro-meteorite created a small hole in the front window of PCU-0. Therefore, we take the Standard-2 events from the PCU-2 and extract the energy spectra from the upper xenon layer.
The extracted PCA spectrum covers the 2-60 keV bandpass in 129 channels, each sampled in every 16 seconds. The energy spectra at 18-180 keV are derived from the HEXTE-A data. Because the detector 2 of the HEXTE cluster B lost the spectral capability, only the data from cluster A are analyzed. We use the software package XSPEC, version 12.2.1, to analyze the broadband (3-180 keV) spectra. The background spectra are made by the FTOOLS pcabackest, with the latest ‘bright source’ background model enclosed. An instrument response files are obtained with the tool pcarsp. An additional 0.5% systematic errors are added to the PCU-2 spectra because of the calibration uncertainties.
3 ANALYSIS and RESULTS
3.1 ASM and PCA Light Curves, Color-Color Diagram
ASM monitored the light curve of the entire outburst in the 1.3–12.1 keV energy band. As shown in Fig.1 is the ASM light curve with each bin averaged over one day. The outburst started on June 29, 2005, reached the maximum of mCrab (1 Crab 75 counts/s 111http://xte.mit.edu/ASM_lc.html) on July 06, 2006, and finally decayed exponentially to quiescence. The fast-rise and exponential-decay (hereafter FRED) light curve is considered as the ‘classic’ signature of a soft X-ray transient (Chen et al., 1997). To investigate the evolution of the energy spectrum, two colors are investigated (see, e.g. Hasinger & van der Klis (1989)): the soft color is the count ratio of 3.0–5.0 keV to 1.3–3.0 keV, and the hard color is the count ratio of 5.0–12.1 keV to 3.0–5.0 keV. In Fig.1 the spectral evolution is obvious only for soft color during the formation of the outburst.
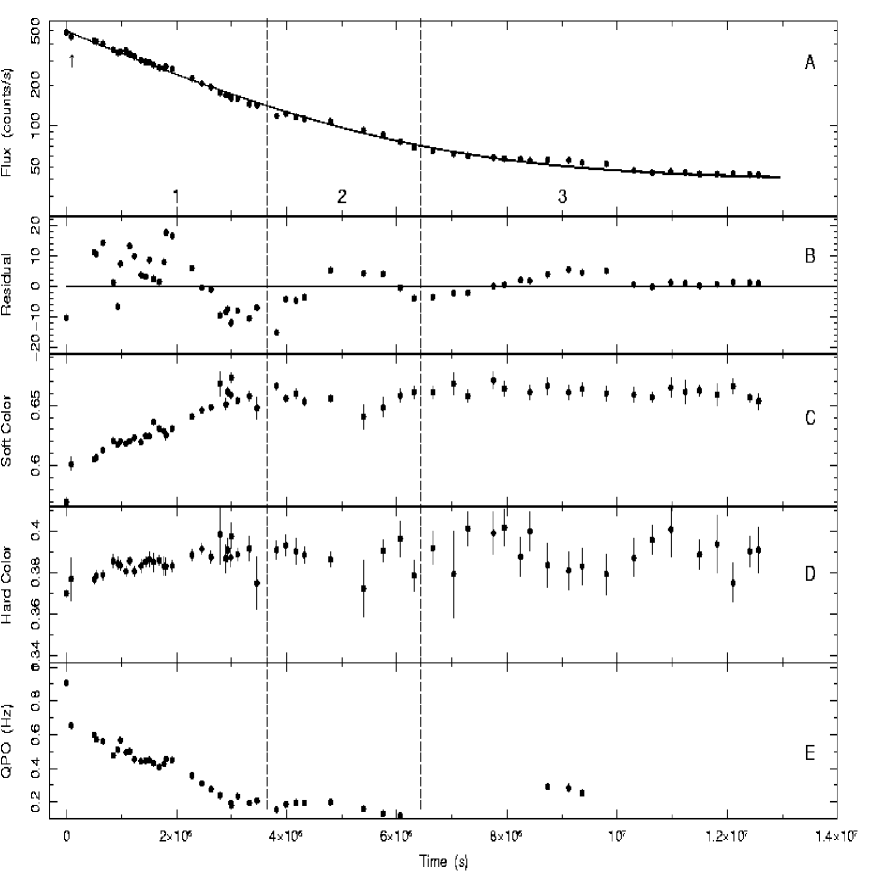
As shown in panel A of Fig.2 is the available PCA observations of Swift J1753.50127 during the decay of outburst. The residuals resulted from fitting this light curve with two exponential functions indicate either the fluctuation of the flux or several additional small bursts. The light curve is subdivided into three parts according to the evolution of the colors and the OPQ, as will be shown in the following.
The PCA colors are defined as the soft ( 6.1-9.4 keV/2.1-5.7 keV) and the hard ( 13.5-16.9 keV/9.8-13.1 keV). Both colors increase linearly when the burst decay from the flux maximum to where the linear relationship becomes rather weak, and the corresponding time period is defined as the time zone ’part 1’ (panel C/D of Fig.2). Later on, both colors keep likely constant during the rest of the decay. This trend is rather straightforward in the color-color diagram ( Fig.3). Similar linear relationship between the soft and hard color was reported in GRS 1915 + 105 by (Belloni et al., 2000) in its low/hard state. The second time zone (part 2) is ended when the QPO signal vanishes. One sees from the Fig.2 that in the third time zone (part 3) the QPO signal appears occasionally around the time when the source is likely to have additional flare in flux and evolution in hard color.
3.2 Timing Analysis
The power density spectra are produced with FTOOLS powspec for the Event mode (E_125us_64M_0_1s) data in the energy band 2-60 keV. As shown in Fig.4 is one sample of the PDS obtained from the PCA observation ID 9143-01-01-00. The PDS consists of several components typical for the low-hard state in accreting BHs (Cui, 1999): the white noise at the low frequencies and the red noise at the high frequencies. These noises are generally fitted by a broken power law function and the QPO in PDS is fit with a Lorentzian function. The errors are estimated by setting = 1. For Swift J1753.50127 , 39 of 62 PCA observations are found to have low-frequency quasi-periodic oscillations (LFQPOs) at the frequencies 0.1–0.9 Hz (see Table LABEL:qpotable). These results are obtained without taking into account the harmonics in the spectral fitting. The LFQPOs are a common feature for the X-ray BH binary while staying in their low/hard state, and elsewhere detected already in V404 Cyg, GRO J1719-24, GRO J0422+32, GS 1354-64 and XTE J1118+480 (Brocksopp et al., 2004).
During the decay of the outburst, the QPO has a rough trend of evolving to the lower frequencies (Fig.2). Such a trend is obvious in the plot of the flux against QPO frequency (Fig.5), where a linear relationship is well established. Similar feature was reported in the other BHC like GRS 1915 + 105 (Markwardt et al., 1999; Reig et al., 2000). It is worth noting that several QPO frequencies in Fig.5 strongly deviate from the overall linear relationship. These QPOs are detected when the outburst either reached to the flux maximum or decayed to rather low flux levels.
3.3 Spectral Analysis
The energy spectra of the black hole X-ray binaries are generally described by the joint components of a blackbody and a power-law shape(Remillard & McClintock, 2006). In such a model the soft X-rays are thought to be produced in the accretion disk while the hard X-rays from the inverse Compton scattering of the soft photons off the electrons in the hot corona residing in the inner disk.
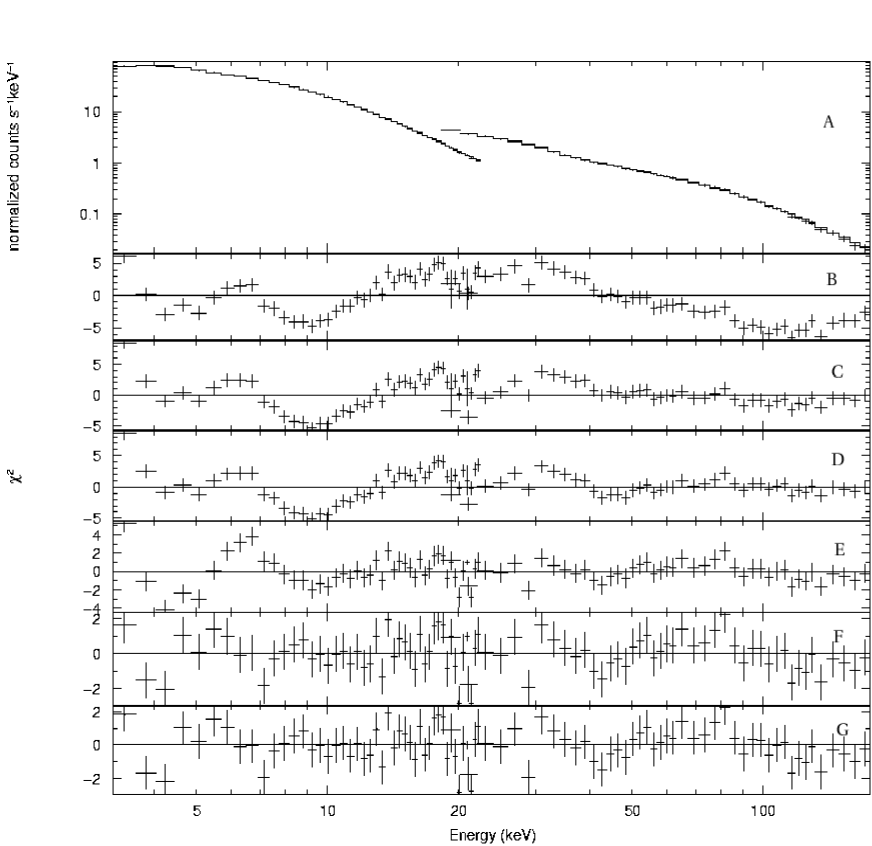
To find the proper components in the energy spectrum we take the RXTE observation 91432-01-01-00 for spectral fitting. This observation was carried out on July 7, 2005 (indicated in Fig.2 by the arrow symbol), and the data have almost the best statistics. After standard screening, the remained exposures for PCA and HEXTE are 6.4 ksec and 2.1 ksec, respectively. The RXTE PCU-2 (3.0–23.0 keV) and HEXTE-A (18.0–180.0 keV) spectra are combined. A scaling factor is introduced to account for the different normalization between PCA and HEXTE. This parameter is set to unit for PCA and free for HEXTE. The hydrogen column density is fixed at =. To account for the major component in the energy spectrum, we have performed several trials. The fitting results in a reduced 10.9 with a simple power law model, a reduced 6.14 with a compTT model and a reduced 5.10 with a broken power-law model (see Fig.6). Therefore we take for the first step the broken power-law model. For the improvement of fittings, the excesses showing up in the residuals of Fig.6 require the extra models. By adding a disk blackbody model (”diskbb”in XSPEC) the fit is improved with the reduced 2.21. The excess residing at the energies between 5 and 8 keV could in principle be the contribution from the disk reflection. By taking the smeared edge model (Ebisawa et al. (1994), “smedge”in XSPEC) into account, the reduced goes down to 0.97. However, the parameters of disk blackbody and smeared edge cannot be constrained. A substitution of the smeared edge model by a Gaussian with the center fixed at 6.4 keV results in the reduced of 1.16, but the errors for disk blackbody parameters are not constrained as well by the data. Accordingly, the disk blackbody model is replaced by a blackbody model (“bbodyrad” in XSPEC). This gives a reduced of 1.19, and the parameters are well constrained as the follows: the blackbody temperature kT = keV, normalization = , equivalent blackbody radius (d/8.5 kpc) km, break energy BreakE = keV, photon index = and = , equivalent width of Fe K line EW = 0.152 keV, an unabsorbed flux of (2-10 keV) and a luminosity of (or ). The comparison of the trials with different models refers to Table LABEL:tab:model. By applying the bbodyrad+bknpower+gauss model (hereafter BBG model), the whole data are analyzed and the results are presented in Table LABEL:tab:bknpo.
4 DISCUSSION
Comparing the light curve morphology of the 2005-2006 outburst of Swift J1753.50127 with that of the 2000 first outburst of XTE J1118+480 (Wood et al., 2001), we find that both exhibit the very similar FRED-shaped form, which is often considered as a characteristic for the ‘soft X-ray transients’(SXTs) (Lasota, 2001), then the account for the SXT outbursts is usually referred to the thermal-viscous disk instability model (DIM) (Lasota, 2001; Brocksopp et al., 2004) or to a diffusion model (Wood et al., 2001). The FRED-shaped light curve of Swift J1753.50127 can be well described using above two models.
The high and low spectral states firstly identified in Cyg X-1 (Tananbaum et al., 1972) have been observed in a number of X-ray binaries, where the “high” and “low” terminology is originally chosen based on the 2-10 keV X-ray flux. It is later found that the low state corresponds to a hard spectrum and the high state to a soft spectrum. The spectra and fluxes (see Table LABEL:tab:bknpo) indicate that Swift J1753.50127 is in its low/hard state. Strikingly, the observed state of Swift J1753.50127 is similar to those of a few BHCs (for instance, XTE J1118+480 and GRO J0422+32), remaining in the low/hard state during outburst. For explaining the behavior of the SXTs which can remain in the low/hard state during outburst, a model was proposed by Meyer-Hofmeister (2004). In their model, a transition to the high/soft state depends on the peak mass flow rate in outburst, and the critical mass flow rate range is 0.02 to 0.05 . The thermal component comes from the blackbody emission of a truncated thin disk and the non-thermal one from the Comptonization of the soft X-ray. The highest flux of Swift J1753.50127 is , which lies within the declaimed critical mass flow rate. We also find that the thermal component presented in the spectra from the outburst to quiescence might come from the disk. But the parameters of the thermal component cannot be constrained by the PCA data. Miller et al. (2006) analyzed the XMM-Newton and RXTE observations when the source is near its quiescence. A thermal component which comes from a thin disk was also found, however, a smaller disk radius is not consistent with Meyer-Hofmeister’s model. Miller et al. (2006) suggest that the Swift J1753.50127 may have a low mass black hole than the typical black hole candidates. The low mass black hole has a less evaporation efficiency to allow the disk to grow near the ISCO, which accounts for the thermal component(Meyer-Hofmeister, 2004).
The X-ray PDS of Swift J1753.50127 displays LFQPOs in the range 0.1 to 0.9 Hz (see panel E of Fig.2), which is extraordinarily important for understanding the behaviors of accreting black holes (van der Klis, 2005; Belloni et al., 2002), and usually they are associated with the nonthermal or low/hard states and transitions, implying the QPO emitting regimes to be far away from ISCO, perhaps 100 Schwarzschild radius for the 10 solar mass central object if the Keplerian frequency (maybe not necessary) is taken into account. Two models are often mentioned to describe the LFQPO (Brocksopp et al., 2004). Titarchuk & Osherovich (2000) suggest that the LFQPO of X-ray transients may be caused by the vertical oscillation of the inner edge of accretion disk, and they predict a proportional correlation between QPO frequency and the color parameter. Furthermore, they also suggest that the spectrum gets harder and the QPO frequency increases when the disk mass accretion rate drops. However, our results would expect the inner edge of disk to move outwards with decreasing the QPO frequency, while moving back to its “quiescent state”, which has been hinted in panel E of Fig.2. With the exponential-decay light curve, the frequencies of LFQPOs are decreasing, as shown in Fig.2. So, generally, there exists an approximate linear relation between the QPO frequency and flux, and the similar phenomena have been noted in GRS 1915 + 105 (Markwardt et al., 1999; Reig et al., 2000). In Fig.7, a plot of the soft/hard color versus the QPO frequency, we can find that both the soft and hard colors drop with the QPO frequency, and a similar anti-correlation between QPO frequency and hardness ratios has been found in BHC GRS 1915+105 (Reig et al., 2000). Therefore, LFQPOs of Swift J1753.50127 might be unsatisfactorily explained by the model of Titarchuk & Osherovich (2000).
We would like to note that in Fig.5 there are several data points staying away from the overall trend of a linear relationship between the flux and QPO. This phenomenon in could not be well explained by the models of Markwardt et al. (1999), Reig et al. (2000), and Titarchuk & Osherovich (2000). As shown in Fig.2, an additional small flare occurred in the third time region is correlated to the three QPO signals standing out of the lowest flux in Fig.5. During this small flare, the spectrum becomes soft (panels D and E in Fig.2). This might suggest that the QPO origins from the perturbation at somewhere of accretion disk, since otherwise the high QPO frequency would require larger luminosity than observed according to the main trend of a linear relationship. The QPO frequency (Fig.5) detected at the peak flux of the outburst drops from 0.906 Hz to 0.654 Hz within one day, while the flux decreases by only 9 percent and is largely deviated from the overall linear trend. This is in general not consistent with the arguments of Meyer-Hofmeister (2004) for explaining the relationship between the QPO frequency and flux. In the paper of Meyer-Hofmeister (2004), the transition in spectral state is the result of the balance between the evaporation of the inner edge of disk and the inward accretion flow. The closer to the black hole for the inner disk, the larger the flux and the higher value the QPO frequency. In the region very close to the black hole, the coronal evaporation becomes dominant, and instead of being completely truncated the inner edge of the disk might constitute a soft extension toward the corona. As a result, the source might remain hard state due to the evaporation of the accretion flow, and presents the larger frequency of QPO in the power spectrum. The deviation of this point from the overall trend might provide the evidence from the observational point of view that the inner edge of the disk might have a soft extension and evaporate rapidly to prevent from establishing effectively the high/soft state.
An alternative explanation might be the radial inflow effect(van der Klis, 2001). By connecting the deviated QPO points in Fig.5 one gets a line which is roughly parallel to the track of the main linear trend. Similar parallel tracks are observed in some kHz-QPO sources in plots of QPO frequency vs. X-ray luminosity. According to van der Klis (2001), in the so-called radial inflow scenario, the QPO frequency is determined by some balance between the accretion rate through disk and radiative stresses, and it can be expressed as: , where is the instantaneous accretion rate and is the luminosity. has both an immediate response to and the filtered one averaged over a special time period: . The adjustments on the values of and could lead to the parallel tracks in the plot of QPO vs. flux, as might be the case as well for Swift J1753.50127 .
In panel a & b of Fig.8, we plot the relations between the QPO frequency and the flux of blackbody and broken power-law respectively, and find that both of them have a positive linear relation, implying the LFQPO correlation with the spectral parameters for both the thermal and nonthermal components. Similarly, Markwardt et al. (1999) and Trudolyubov et al. (1999) have shown that the frequency of QPO between 0.5 and 10 Hz of GRS 1915 + 105 is positively correlated with both the thermal and nonthermal flux. However, in imagination, the oscillation could originate in the accretion disk if the power-law spectrum comes from the inverse Compton scattering of disk photons, and so the thermal and nonthermal components would have some close correlation. Thus this QPO appears to link both the accretion disk and density of Compton scattering electrons. Using the normalization of blackbody model, we calculate the equivalent radius of blackbody area, and plot its relation with the QPO frequency in Fig.9, showing a linear relation. When the flux drops, the equivalent radius gets smaller, i.e. the radiation area of blackbody in the disk area decreases, and the QPO frequency decreases because the radius of inner disk increases.
In the work by Titarchuk et al. (2004), they declaim that the observed low QPO frequency—spectral-index correlation is a natural consequence of an adjustment of the Keplerian disk flow to the innermost sub-Keplerian boundary conditions near the central object. This ultimately leads to the formation of the sub-Keplerian transition layer between the adjustment radius and the innermost boundary (the horizon for BH). In panel c and d of Fig.8, we present the correlation of photon index versus QPO frequency. For QPO frequency values above 0.4 Hz, the QPO frequency and power-law index appear to be correlated each other positively. However, for the frequency 0.4 Hz, the photon power-law index is determined less accurate, and remains almost constant. The similar properties of the index–QPO correlation in GRS 1915+105 and XTE J1550-546 have been found (Vignarca et al., 2003; Titarchuk et al., 2004; Shaposhnikov et al., 2006). Then in GRS 1915+105, Titarchuk et al. (2004) stress that the hard state is related to an extended Compton cloud (cavity) characterized by a photon index of around 1.7 and low QPO frequencies below 1 Hz. This is the regime where thermal Comptonization dominates the upscattering of soft disk photons and the spectral shape (index) is almost independent of mass accretion rate. Thus, panel c and d of Fig.8 suggest that the source was in the low/hard state. In addition, Shaposhnikov et al. (2006) argues that the index saturation level is determined by the temperature of the converging flow where the soft (disk) photons are upscattered by electrons to the energy of falling electrons. In principle, one can evaluate the mass of the central black hole using the index-QPO relation because QPO frequencies are inversely proportional to the BH mass (Titarchuk et al., 2004; Shaposhnikov et al., 2006).
5 CONCLUSION
Almost all the lights under the current analysis point to the fact that Swift J1753.50127 kept staying in the low/hard state during the outburst, along with the evolutions of the spectral and the timing features similar to those of other BHCs like XTE J1118+480 and GRO J0422+32. By far all these sources belong to this small subset of BHC were observed to have almost only the low/hard state while in outburst. The corresponding scenario could be that, due to the low peak luminosity, the coronal evaporation truncates the thin disk even in outburst and the spectra have to stay hard (Meyer-Hofmeister, 2004). During the outburst, Swift J1753.50127 was detected to have its QPO frequency varying linearly with the flux for most of the time. An interesting deviation from this trend as observed at the peak flux might provide the first evidence of ’seeing’ a rapid evaporation for the inner edge of the disk, which prevents from effectively establishing the high/soft state during the early stage of the flare. The relationship between the QPO frequency and spectral color is anti-correlation. Although on a theoretical ground the mechanism of the LFQPO of Swift J1753.50127 is still open, this seems not likely to be satisfied by the global disk oscillation model (Titarchuk & Osherovich, 2000).
References
- Belloni et al. (2000) Belloni, T., Klein-Wolt, M., Mendez, M., et al. 2000, A&A, 355, 271
- Belloni et al. (2002) Belloni, T., Psaltis, D., & van der Klis, M., 2002, ApJ, 572, 392
- Brocksopp et al. (2004) Brocksopp, C., Bandyopadhyay, R. M., & Fender, R. P. 2004, NewAr, 9, 249
- Burrows et al. (2005) Burrows, D. N., Racusin, J., Morris, D. C., et al. 2005, ATEL, 547
- Chen et al. (1997) Chen, W., Shrader, C. R., Livio, M. 1997, ApJ, 491, 312
- Cui (1999) Cui, W. 1999, ASPC, 161, 97C
- Ebisawa et al. (1994) Ebisawa, K., et al. 1994, PASJ, 46, 375
- Fender et al. (2005) Fender, R., Garrington, S., & Muxlow, T. 2005, ATEL, 558
- Frank et al. (2002) Frank, J., King, A. R., & Raine, D. 2002, in Accretion Power in Astrophysics, 3rd ed. (Cambridge Canbridge U. Press)
- Giannios (2005) Giannios, D. 2005, A&A, 437, 1007
- Gruber et al. (1996) Gruber, D. E., Blanco, P. R., Heindl, W. A., et al. 1996, A&AS, 120, C641
- Halpern (2005) Halpern, J. P. 2005, ATEL, 549
- Hasinger & van der Klis (1989) Hasinger, G., van der Klis, M. 1989, A&A, 225, 79
- Lasota (2001) Lasota, J.-P. 2001. NewAr, 45, 449
- Markwardt et al. (1999) Markwardt, C. M., Swark, J. H., Taam, R. E. 1999, ApJ, 513, 37
- Meyer-Hofmeister (2004) Meyer-Hofmeister, E. 2004, A&A, 423, 321
- McClintock & Remillard (2006) McClintock J. E., Remillard R. A. 2006. In Compact Stellar X-ray Sources, ed. WHG Lewin. M van der Klis, PP. 157-214. Cambridge: Cambredge University Press. (astro-ph/0306213)
- Miller et al. (2006) Miller, J. M., Homan, J., Miniutti, G. 2006, astro-ph/0605190
- Mitsuda et al. (1984) Mitsuda, K., Inoue, H., Koyama, K., et al. 1984, PASJ, 36, 741
- Morris et al. (2005) Morris, D. C., Burrows, D. N., Racusin, J., et al. 2005, ATEL, 552
- Morgan et al. (2005) Morgan, E., Swank, J., Markwardt, C., et al. 2005, ATEL, 550
- Palmer et al. (2005) Palmer, D. M., Barthelmey, S. D., Cummings, J. R., et al. 2005, ATEL, 546
- Poutanen et al. (1999) Poutanen, J., Fabian, A. C. 1999, ApJ, 520, 262
- Ramadevi et al. (2006) Ramadevi, M. C., Seetha, S. 2006, astro-ph/0611375
- Reig et al. (2000) Reig, P., Belloni, T., van der Kils, M., et al. 2000, ApJ, 541, 883
- Remillard & McClintock (2006) Remillard, R. A., McClintock. J. E., 2006 ARA&A 44, 49
- Shaposhnikov et al. (2006) Shaposhnikov, N., Titarchuk, L. 2006, astro-ph/0602091
- Tanaka & Lewin (1995) Tanaka Y, Lewin WHG 1995, in X-ray Binaries, ed. WhG Lewin, J van Paradijs, EPJ van den Heuvel, pp. 126-74. Cambridge: Cambrideg University Press
- Tananbaum et al. (1972) Tananbaum, H., Gursky, H., Kellogg, E., et al. 1972, ApJ, 177, 5
- Titarchuk & Osherovich (2000) Titarchuk, L., & Osherovich, V. 2000, ApJ, 542, 111
- Titarchuk et al. (2004) Titarchuk, L., & Fiorito, R. 2004, ApJ, 612, 988
- Trudolyubov et al. (1999) Trudolyubov, S., Churazov, E., Gillanov, M. 1999, Astronomy Lett., 25,718
- Vignarca et al. (2003) Vignarca, F., Migliari, S., Belloni, T., Psaltis, D., van der Klis, M. 2003, A&A, 397, 729
- van der Klis (1994) van der Klis, M. 1994, ApJS, 92, 511
- van der Klis (1995) van der Klis, M. 1995, in X-ray Binaries, ed. W. H. G. Lewin, J. van Paradijs, & E. P. J. van den Heuvel (Cambridge: Cambridge Univ. Press), 252
- van der Klis (2000) van der Klis, M. 2000, ARA&A, 38, 717 (astro-ph/0001167)
- van der Klis (2001) van der Klis, M. 2001, Apj, 561, 943
- van der Klis (2005) van der Klis, M. 2005, in Compact Stellar X-ray Sources, ed. WHG Lewin, M van der Klis, pp. 39-112. Cambridge: Cambridge University Press. (astro-ph/04010551)
- Wood et al. (2001) Wood, K. S., Titarchuk, L., Ray, P.S., et al. 2001, ApJ, 563, 246


| Obs. ID | Start Data | exposure (s) | QPO (Hz) |
|---|---|---|---|
| 91423-01-01-04 | 2005-07-06T05:13:20 | 3232 | |
| 91423-01-01-00 | 2005-07-07T04:49:03 | 6464 | |
| 91423-01-02-00 | 2005-07-12T01:13:20 | 3232 | |
| 91423-01-02-05 | 2005-07-12T12:14:24 | 3232 | |
| 91423-01-02-06 | 2005-07-13T21:17:20 | 3232 | |
| 91423-01-03-00 | 2005-07-16T01:11:28 | 5264 | |
| 91423-01-03-02 | 2005-07-17T13:22:47 | 3216 | |
| 91423-01-03-03 | 2005-07-18T17:41:20 | 3204 | |
| 91423-01-03-04 | 2005-07-19T12:34:24 | 3216 | |
| 91423-01-03-05 | 2005-07-20T12:09:20 | 3136 | |
| 91423-01-03-06 | 2005-07-21T21:12:12 | 3200 | |
| 91423-01-03-07 | 2005-07-16T23:13:32 | 8352 | |
| 91423-01-04-00 | 2005-07-22T20:47:28 | 3200 | |
| 91423-01-04-01 | 2005-07-23T15:39:28 | 3184 | |
| 91423-01-04-02 | 2005-07-24T12:06:24 | 3200 | |
| 91423-01-04-03 | 2005-07-25T18:06:58 | 2800 | |
| 91423-01-04-04 | 2005-07-26T17:35:28 | 3200 | |
| 91423-01-04-05 | 2005-07-27T04:35:47 | 1760 | |
| 91423-01-04-06 | 2005-07-28T10:28:16 | 2928 | |
| 91423-01-05-01 | 2005-08-01T15:09:18 | 3200 | |
| 91423-01-05-02 | 2005-08-03T15:55:51 | 3200 | |
| 91423-01-06-00 | 2005-08-05T15:06:40 | 3216 | |
| 91423-01-06-01 | 2005-08-07T11:15:27 | 2896 | |
| 91423-01-06-06 | 2005-08-09T18:44:32 | 1344 | |
| 91423-01-06-07 | 2005-08-09T22:00:32 | 944 | |
| 91423-01-06-03 | 2005-08-11T04:51:28 | 3104 | |
| 91423-01-07-00 | 2005-08-13T17:01:20 | 1680 | |
| 91423-01-07-01 | 2005-08-15T06:45:52 | 1680 | |
| 91423-01-08-00 | 2005-08-19T09:25:36 | 3216 | |
| 91423-01-08-01 | 2005-08-21T08:35:44 | 3200 | |
| 91423-01-08-02 | 2005-08-23T11:03:12 | 1120 | |
| 91423-01-08-03 | 2005-08-25T05:53:52 | 1472 | |
| 91423-01-09-00 | 2005-08-30T17:39:44 | 2800 | |
| 91423-01-10-00 | 2005-09-06T16:17:04 | 1968 | |
| 91423-01-11-00 | 2005-09-10T17:46:40 | 3200 | |
| 91423-01-11-01 | 2005-09-14T08:17:20 | 3200 | |
| 91423-01-16-00 | 2005-10-15T08:15:28 | 944 | |
| 91423-01-16-01 | 2005-10-19T18:06:08 | 1248 | |
| 91423-01-17-00 | 2005-10-22T13:29:52 | 300 |
| model | kT | k | Tin | breakE | |||||
| (kev) | (keV) | (keV) | (keV) | (keV) | |||||
| pow | – | – | – | – | – | – | – | 10.97 | |
| compTT | – | – | – | – | – | – | 6.14 | ||
| bknpo | – | – | – | – | – | 5.10 | |||
| diskbb+bknpo | – | – | – | – | 2.21 | ||||
| diskbb+gau+bknpo | – | – | – | – | 1.16 | ||||
| bb+gau+bknpo | – | – | – | – | 1.19 |
| Obs. ID | MJD | kT | breakE | EW | ||||||
|---|---|---|---|---|---|---|---|---|---|---|
| (keV) | (d/8.5 kpc) km | keV | eV | ergs//s | ergs//s | |||||
| 91423-01-01-04 | 53557 | 177 | 5.05 | 4.16 | 1.19 | |||||
| 91423-01-01-00 | 53558 | 152 | 4.04 | 3.85 | 1.20 | |||||
| 91423-01-02-00 | 53563 | 144 | 3.91 | 3.58 | 1.55 | |||||
| 91423-01-02-05 | 53563 | 162 | 3.88 | 3.52 | 1.24 | |||||
| 91423-01-02-06 | 53564 | 97 | 3.26 | 3.45 | 1.51 | |||||
| 91423-01-03-00 | 53567 | 131 | 3.03 | 3.08 | 1.50 | |||||
| 91423-01-03-07 | 53567 | 122 | 2.91 | 2.91 | 1.56 | |||||
| 91423-01-03-02 | 53568 | 157 | 3.29 | 2.96 | 1.09 | |||||
| 91423-01-03-03 | 53569 | 155 | 3.20 | 2.03 | 1.22 | |||||
| 91423-01-03-04 | 53570 | 180 | 3.33 | 2.79 | 0.95 | |||||
| 91423-01-03-05 | 53571 | 183 | 3.27 | 2.70 | 1.12 | |||||
| 91423-01-03-06 | 53572 | 119 | 2.58 | 2.60 | 1.24 | |||||
| 91423-01-04-00 | 53573 | 157 | 2.65 | 2.48 | 1.45 | |||||
| 91423-01-04-01 | 53574 | 137 | 2.59 | 2.47 | 0.97 | |||||
| 91423-01-04-02 | 53575 | 124 | 2.48 | 2.38 | 1.30 | |||||
| 91423-01-04-03 | 53576 | 162 | 2.66 | 2.20 | 0.93 | |||||
| 91423-01-04-04 | 53577 | 132 | 2.27 | 2.26 | 0.94 | |||||
| 91423-01-04-05 | 53578 | 116 | 2.40 | 2.29 | 0.98 | |||||
| 91423-01-04-06 | 53579 | 137 | 2.11 | 2.22 | 1.34 | |||||
| 91423-01-05-01 | 53583 | 145 | 1.96 | 1.85 | 1.26 | |||||
| 91423-01-05-02 | 53585 | 127 | 1.70 | 1.71 | 1.12 | |||||
| 91423-01-06-00 | 53587 | 144 | 1.40 | 1.63 | 0.85 | |||||
| 91423-01-06-01 | 53589 | 134 | 1.13 | 1.46 | 1.03 | |||||
| 91423-01-06-05 | 53590 | 79 | 1.21 | 1.42 | 0.97 | |||||
| 91423-01-06-04 | 53591 | 78 | 0.77 | 1.44 | 1.15 | |||||
| 91423-01-06-06 | 53591 | 131 | 1.33 | 1.32 | 1.18 | |||||
| 91423-01-06-07 | 53591 | 180 | 1.29 | 1.32 | 1.08 | |||||
| 91423-01-06-03 | 53593 | 98 | 1.04 | 1.34 | 1.05 | |||||
| 91423-01-08-03 | 53593 | 89 | 0.78 | 0.96 | 0.87 | |||||
| 91423-01-07-00 | 53595 | 68 | 1.03 | 1.32 | 0.75 | |||||
| 91423-01-07-01 | 53597 | 85 | 0.94 | 1.18 | 0.89 | |||||
| 91423-01-08-00 | 53601 | 97 | 0.72 | 1.01 | 1.12 | |||||
| 91423-01-08-01 | 53603 | 151 | 0.90 | 1.03 | 1.17 | |||||
| 91423-01-08-02 | 53605 | 96 | 0.72 | 0.99 | 0.70 | |||||
| 91423-01-09-00 | 53612 | 80 | 0.74 | 0.91 | 0.83 | |||||
| 91423-01-10-00 | 53623 | 86 | 0.54 | 0.82 | 1.13 | |||||
| 91423-01-11-00 | 53627 | 121 | 0.67 | 0.72 | 0.88 | |||||
| 91423-01-11-01 | 53630 | 78 | 0.49 | 0.64 | 1.01 | |||||
| 91423-01-12-00 | 53634 | 42 | 0.39 | 0.60 | 0.93 | |||||
| 91423-01-12-01 | 53638 | 111 | 0.49 | 0.55 | 0.98 | |||||
| group1∗ | —– | 85 | 0.48 | 0.48 | 1.37 | |||||
| 91423-01-16-00 | 53658 | 213 | 0.59 | 0.45 | 1.03 | |||||
| 91423-01-16-01 | 53662 | 79 | 0.20 | 0.47 | 0.78 | |||||
| 91423-01-17-00 | 53665 | 67 | 0.28 | 0.46 | 1.07 | |||||
| group2∗ | —– | 85 | 0.29 | 0.38 | 0.82 |
Note ∗ group1 contain Obs. ID (91423-01-13-00, 91423-01-13-01, 91423-01-14-00, 91423-01-14-01, 91423-01-15-00, 91423-01-15-01). group2 contain Obs. ID (91423-01-17-01, 91423-01-18-00,91423-01-19-00,91423-01-19-01,91423-01-20-00, 91423-01-20-01,91423-01-21-00,91423-01-21-01,91423-01-22-00, 91423-01-22-01,92404-01-02-00).