A view of the M81 galaxy group via the window
Abstract
We present images for 36 galaxies of the M81 group obtained in the line. Estimates of the flux and star formation rate, SFR, are avialable now for all the known members of the group with absolute magnitudes down to .
The character of distribution of the galaxies over three paremeters: , SFR, and total hydrogen mass permits us to draw the following conclusions as to evolution status of the group population. a) Spiral and irregular type galaxies would have time to generate their luminosity (baryon mass) during the cosmological time Gyr, but dwarf spheroidal objects are capable of reproducing only 5% of their observed luminosity. b) S and Im,BCD galaxies possess the supply of gas sufficient to maintain their observed SFRs during only next (1/4 - 1/3) years, while dIr and dSph populations have the mean gas depletion time about 3 . c) There is indirect evidence that the star formation in Im, BCD and dIr galaxies proceeds in a mode of vigorous burst activity rather than in the form of a sluggish process. We note the dwarf tidal system near NGC 3077, the Garland, to have the highest SFR per unit luminosity among 150 galaxies of the Local volume with known SFRs.
Being averaged over the local ”cell of homogeneity” of 4 Mpc in diameter around M 81, the rate of star formation of the group, yearMpc3, proves to be 5–8 times higher than, that of the average global rate at Z =0.
1 Introduction
Over the last years a great deal of observational effort has been undertaken to understand how the star formation in a galaxy depends on its luminosity, age and environment. One of the basic tools for this is measurement of fluxes that are emitted by galaxies in the line. Madau et al. (1996) have shown that the average star formation rate has smoothly increased with the redshift from to and then has decreased steeply up to the present time (Z = 0). In order to reliably fix the star formation density in a unit volume at the present epoch, it is necessary to measure the -fluxes in a sufficiently representative sample of nearby galaxies limited by a fixed distance. The most appropriate sample for this purpose is the Catalog of 450 neighboring galaxies situated in a sphere of radius 10 Mpc around the Milky Way (Karachentsev et al. 2004).
We have undertaken a comprehensive survey of these galaxies on the northern sky with the BTA 6-m telescope. The first results have been published for galaxies in the groups around NGC 6946 (Karachentsev et al. 2005) and M 31 (Kaisin & Karachentsev 2006). This program has also been supported by observations of southern objects (Kaisin et al. 2006). The data obtained allow the rates of star formation in galaxies to be studied in a uniquely wide range of luminosities, as high as 4 orders of magnitude.
In this paper, we present a complete summary of data on -fluxes for galaxies in a neighboring group around the giant spiral galaxy M 81. An atlas of large-scale images of 20 dwarf galaxies of this group in the B-band was presented by Karachentsev et al. (1985). Another 7 dwarf systems have been discovered in this group ever since. According to Karachentsev et al. (2002), about 30 galaxies are associated with M 81, including the bright spiral galaxy NGC 2403 and five its satellites. At present, accurate distances from the luminosity of the red giant branch stars have been measured almost for all the members of M81, which has made it possible to reconstruct the three-dimensional structure of the complex. The loose clump of dwarf galaxies around NGC 2403 is situated at the front boundary of the complex and is moving from us toward M81. On the opposite more distant side there are the spiral NGC 4236 and few irregular galaxies, which are not dynamically associated with M 81, but take part in the cosmic expansion. On the whole, the entire complex of these galaxies looks like a diffuse filament somewhat resembling another nearby loose filament in Sculptor (Karachentsev 2005).
Unfortunately, no one has ever undertaken a systematic overview of the M81 group population in the line. The brightest members of the group were observed in by Hodge & Kennicutt (1983), Kennicutt et al. (1989), Miller & Hodge (1994), and Young et al. (1996). Later on, the -fluxes in several M81 companions were measured by Gil de Paz et al. (2003), James et al. (2004), Hunter & Elmegreen (2004), and Lozinskaya et al. (2006). Miller (1996) has noted that the star formation rates in the galaxies of the M81 group look, on the average, higher than those in the Sculptor group and the Local group. However, about 2/3 of the galaxies in the M81 group did not have measured -fluxes at that time. The survey of the dwarf population of this group, which we have carried out, gives grounds for a correct comparison of star formation processes in the most nearby groups.
2 Observations and data reduction
We obtained CCD images in the line and continuum for 36 members of the M 81 group in the period from 2001 March to 2006 May with a median seeing of . All the observations were made at the BTA 6-m telescope of Special Astrophysical Observatory using the SCORPIO device (Afanasiev at el. 2005) with a CCD chip of 20482048 pixels, and with a scale of 0.18/pixel, which provides a total field of view of 6.1′. The images in +[NII] and continuum were obtained via observing the galaxies though a narrow-band interference filter 75Å ) with an effective wavelength =6555Å and medium-band filters for the continuum: SED607 with =6063Å =167Å, and SED707 with =7063Å =207Å, respectively. Typical exposure times for most the galaxies were s in the continuum and s in . Since the range of radial velocities in our sample is small, we have used one and the same filter for all the observed objects. The procedure of data reduction was standard for direct images obtained with CCD. For all the data the bias was subtracted and then all the images were flat-fielded, after which cosmic rays were removed and the sky background was subtracted. The next operation was bringing into coicidence all the images of a given object. Then all the images in the continuum were normalized to the images with the use of 5–15 field stars and subtracted. For the continuum subtracted images their fluxes were obtained, using spectrophotometric standard stars observed in the same nights as the objects. Investigation of measurement errors has shown that they have typical values of 10–15%.
| Galaxy | Date | Seeing | |
|---|---|---|---|
| KKH34 | 13/11/2002 | 1.7” | 1200s |
| KKH37 | 09/10/2001 | 2.3” | 1200 |
| DDO44 | 13/11/2002 | 1.8” | 1200 |
| Holm II | 27/01/2004 | 2.1” | 1200 |
| KDG52 | 05/12/2002 | 1.8” | 1200: |
| DDO53 | 28/11/2003 | 1.5” | 1200 |
| U4483 | 28/11/2003 | 1.5” | 1200 |
| VKN | 05/12/2002 | 1.8” | 1200 |
| HolmI | 21/05/2006 | 2.3” | 600: |
| F8D1 | 01/02/2005 | 3.5” | 1200 |
| FM1 | 01/02/2005 | 4.3” | 1200 |
| N2976 | 03/11/2003 | 1.5” | 600 |
| KK77 | 20/05/2006 | 2.2” | 600 |
| BK3N | 27/01/2004 | 2.0” | 1200 |
| M82 | 23/05/2006 | 2.2” | 1200: |
| KDG61 | 21/05/2006 | 1.6” | 600 |
| A0952+69 | 27/01/2004 | 2.0” | 1200 |
| KKH57 | 20/05/2006 | 1.8” | 900 |
| N3077 | 03/11/2003 | 1.5” | 1200 |
| Garland | 03/11/2003 | 1.5” | 1200 |
| BK5N | 02/02/2005 | 2.8” | 1200 |
| KDG63 | 03/02/2005 | 1.8” | 1200 |
| U5423 | 04/02/2006 | 2.1” | 1200 |
| KDG64 | 03/02/2005 | 1.7” | 1200 |
| IKN | 05/12/2002 | 1.2” | 1200: |
| HIJASS | 29/01/2004 | 1.9” | 600 |
| HS117 | 29/01/2004 | 2.5” | 1200 |
| DDO78 | 04/02/2005 | 1.7” | 600 |
| I2574 | 04/02/2006 | 4.4” | 1200: |
| DDO82 | 07/02/2003 | 1.9” | 1200 |
| BK6N | 21/03/2006 | 4.1” | 1200 |
| DDO87 | 21/05/2006 | 1.7” | 600 |
| KDG73 | 07/02/2003 | 2.1” | 1200 |
| U6456 | 07/02/2003 | 2.2” | 1200 |
| U7242 | 20/05/2006 | 2.7” | 300 |
| N4605 | 29/01/2004 | 2.0” | 1200 |
| DDO165 | 17/03/2001 | 3.9” | 900 |
The conditions of our observations are given in Table 1. Its columns indicate (1) the galaxy name, (2) the date of observations, (3) the average seeing (FWHM), and (4) the total exposure time in seconds; here, colon means that the sky was not photometric.
3 Results
Fig.1 displays (from left to right) the images of [ plus continuum] and [ minus continuum] for 36 observed galaxies. The size of the presented frames is , the north-east directions are marked by the arrows, the names of the galaxies are given in the upper right corner of the frames. For two large galaxies: M82 and IC2574, we present a mosaic of images of three frames, these are at the end of Fig.1. Some basic parameters of the galaxies that we have observed are given in Table 2. To make the picture complete, we have also added into the table a few bright members of the group whose fluxes in the line were measured earlier by other authors. The columns of Table 2 contain the following data taken, as a rule, from the CNG catalog (Karachentsev et al. 2004): (1) the galaxy name; (2) equatorial coordinates for the epoch J2000.0; (3) the distance to a galaxy in Mpc with allowance made for new measurements (Karachentsev et al. 2006); (4) the blue absolute magnitude of a galaxy with the given distance after correction for the Galactic extinction from Shlegel et al. (1998); (5) the major linear diameter in kiloparsecs corrected for the galaxy inclination and the Galactic extinction in the manner adopted by de Vaucouleurs, de Vaucouleurs, & Corwin (1976); (6) morphological type; (7) “tidal index” (TI) following from the CNG: for every galaxy “” we have found its “main disturber”(MD), producing the highest tidal action
where is the total mass of any neighboring potential MD galaxy (proportional to its luminosity with ) separated from the considered galaxy by a space distance ; the value of the constant is chosen so that when the Keplerian cyclic period of a galaxy with respect to its MD equals the cosmic Hubble time, ; therefore positive values correspond to galaxies in groups, while the negative ones correspond to field galaxies; (8) the logarithm of the hydrogen mass of a galaxy, , defined from its flux in the 21 cm line; in some dwarf spheroidal galaxies the upper limit of the flux was estimated from the observations by Huchtmeier et al. (2000); (9) the integral flux of the galaxy in the +[NII] lines expressed in terms of erg/cm2 sec with indication of a typical measurement error; the asteriscs denote data sources on SFR according to other authors, reduced to the distance of the galaxy adopted in Table 2;(10) the star formation rate in the galaxy on a logarithmic scale, SFR(/year) = 1.27 (Gallacher et al. 1984), where the integral flux in the line is corrected for extinction as , while the galaxy distance is expressed in Mpc; (11,12) the dimensionless parameters and , which characterize the past and the future of the process of star formation; here denotes the total blue luminosity of the galaxy in units of solar luminosity, while is the age of the universe assumed equal to 13.7 billion years (Spergel et al. 2003); the last column contains the indication of the data sources on SFR according to other authors, reduced to the distance of the galaxy adopted in Table 2.
Below we note some features of emission regions in the galaxies that we observed.
KKH 34. This dwarf irregular galaxy at the fartherst outskirts of the group M81 (from the side of the neighboring group IC342/Maffei) shows faint diffuse emission in its central part.
KKH 37. This is another dIr galaxy located half-way between M81 and IC 342. Apart from the diffuse emission, KKH 37 shows the presence of a compact HII region near the center, which has been used by Makarov et al. (2003) to determine the radial velocity of the galaxy.
DDO 44. This dwarf spheroidal (dSph) companion of the spiral galaxy NGC 2403 does not show emission in the neutral hydrogen line HI. We have not detected emission within the optical boundary of DDO 44. However, there is a compact patch (marked by a circle in the figure) at the NE edge of the galaxy. It may be rather a peculiar background galaxy than an emission knot belonging to DDO 44. The flux presented in Table 2 refers exactly to it. Apparently, to establish its nature, spectral observations are needed.
HolmII. The irregular galaxy with powerful star formation sites, whose periphery is beyong our frame. The flux presented in Table 2 takes into account the correction for the incomplete field under assumption that distribution of the emission is proportional to the galaxy blue surface brightness.
| Name | RA(2000.0)Dec | D | Type | TI | LgMHI | Flux | LgSFR | p* | f* | ||
|---|---|---|---|---|---|---|---|---|---|---|---|
| Mpc | mag | kpc | M☉ | M☉/yr | |||||||
| (1) | (2) | (3) | (4) | (5) | (6) | (7) | (8) | (9) | (10) | (11) | (12) |
| KKH 34 | 055941.2+732539 | 4.61 | 12.30 | 1.34 | Ir | 1.8 | 7.08 | 363 | 3.78 | 0.72 | 0.72 |
| KKH 37 | 064745.8+800726 | 3.39 | 11.59 | 1.17 | Ir | 1.2 | 6.66 | 11013 | 3.73 | 0.39 | 0.25 |
| N 2366 | 072852.0+691219 | 3.19 | 16.02 | 5.71 | IBm | 1.0 | 8.85 | a) | 0.85 | 0.72 | 0.44 |
| DDO 44 | 073411.3+665310 | 3.19 | 12.07 | 2.67 | dSph | 1.7 | 6.0 | 66 | 5.07 | 1.92: | 0.93: |
| N 2403 | 073654.4+653558 | 3.30 | 19.29 | 19.43 | Scd | 0.0 | 9.52 | b) | 0.04 | 0.22 | 0.58 |
| HolmII | 081905.9+704251 | 3.39 | 16.72 | 7.78 | Im | 0.6 | 8.99 | 56950330 | 1.05 | 0.24 | 0.10 |
| KDG 52 | 082356.0+710146 | 3.55 | 11.49 | 1.35 | Ir | 0.7 | 7.12 | 55 | 5.08 | 1.70: | 2.06 |
| DDO 53 | 083406.5+661045 | 3.56 | 13.37 | 1.67 | Ir | 0.7 | 7.61 | 531041 | 2.04 | 0.59 | 0.49 |
| U 4483 | 083703.0+694631 | 3.21 | 12.73 | 1.04 | BCD | 0.5 | 7.51 | 316829 | 2.35 | 0.54 | 0.28 |
| VKN | 084008.9+682623 | 129 | 4.6: | ||||||||
| HolmI | 094028.2+711111 | 3.84 | 14.49 | 4.03 | Ir | 1.5 | 8.13 | 356531 | 2.13 | 0.05 | 0.12 |
| F8D1 | 094450.0+672832 | 3.77 | 12.59 | 2.58 | dSph | 2.0 | 6.2 | 244 | 3.86 | 0.92: | 0.08: |
| FM1 | 094510.0+684554 | 3.42 | 10.48 | 0.93 | dSph | 1.8 | 6.1 | 76 | 4.92 | 1.13: | 0.88: |
| N 2976 | 094715.6+675449 | 3.56 | 17.10 | 5.57 | Sdm | 2.7 | 8.27 | 57870300 | 0.97 | 0.17 | 0.90 |
| KK 77 | 095010.0+673024 | 3.48 | 12.03 | 2.61 | dSph | 2.0 | 6.1 | 62 | 4.90 | 1.73: | 0.86: |
| BK3N | 095348.5+685809 | 4.02 | 9.59 | 0.60 | Ir | 1.0 | 6.5 | 32 | 5.14 | 1.00: | 1.50: |
| M 81 | 095533.5+690360 | 3.63 | 21.06 | 26.85 | Sab | 2.2 | 9.46 | c) | 0.12 | 0.56 | 0.56 |
| M 82 | 095553.9+694057 | 3.53 | 19.63 | 10.93 | I0 | 2.7 | 8.90 | d) | 0.42 | 0.55 | 1.66 |
| KDG 61 | 095702.7+683530 | 3.60 | 12.85 | 2.40 | dSph? | 3.9 | 6.2 | 43913 | 3.08 | 0.24 | 0.86: |
| A0952 | 095729.0+691620 | 3.87 | 11.51 | 2.14 | Ir | 1.9 | 7.0 | 3515 | 3.10 | 0.28 | 0.04 |
| HolmIX | 095732.4+690235 | 3.7 | 13.68 | 2.77 | Ir | 3.3 | 8.50 | e) | 2.65 | 0.14 | 1.01 |
| KKH 57 | 100016.0+631106 | 3.93 | 10.19 | 0.67 | dSph | 0.7 | 6.3 | 76 | 4.85 | 0.95: | 1.01: |
| N 3077 | 100321.0+684402 | 3.82 | 17.76 | 6.14 | I0p | 1.9 | 8.79 | 52950180 | 0.95 | 0.07 | 0.40 |
| Garlnd | 100342.0+684136 | 3.82 | 11.40 | 6.60 | Ir | 4.0 | 7.54 | 4210390 | 2.05 | 1.37 | 0.55 |
| BK5N | 100440.3+681520 | 3.78 | 10.61 | 0.87 | dSph | 2.4 | 6.4 | 54 | 4.99 | 1.25: | 1.25: |
| KDG 63 | 100507.3+663318 | 3.50 | 12.12 | 1.84 | dSph? | 1.8 | 6.3 | 473 | 4.05 | 0.92 | 0.21: |
| U 5423 | 100530.6+702152 | 5.3 | 14.54 | 1.37 | BCD? | 0.9 | 7.40 | 160123 | 2.17 | 0.01 | 0.57 |
| KDG 64 | 100701.9+674939 | 3.70 | 12.57 | 1.85 | dSph? | 2.5 | 6.3 | 245 | 4.33 | 1.38 | 0.49: |
| IKN | 100805.9+682357 | 3.75 | 12.13 | 3.19 | dSph | 2.7 | 6.3 | 85 | 4.79 | 1.66: | 0.95: |
| HIJASS | 102100.2+684160 | 3.7 | 7.93 | HIcld | 2.2 | 8.18 | 543 | 4.01 | 0.80: | 2.05 | |
| HS 117 | 102125.2+710658 | 3.96 | 11.98 | 1.72 | dSph | 1.0 | 5.0 | 82 | 4.70 | 1.51: | 0.44: |
| DDO 78 | 102627.9+673924 | 3.72 | 12.17 | 2.20 | dSph | 1.8 | 6.2 | 77 | 4.89 | 1.78: | 0.95: |
| I 2574 | 102822.4+682458 | 4.02 | 17.46 | 13.35 | Im | 0.9 | 9.23 | f) | 0.62 | 0.38 | 0.29 |
| DDO 82 | 103035.0+703710 | 4.00 | 14.63 | 3.70 | Im | 0.9 | 6.8 | 171734 | 2.42 | 0.29 | 0.92: |
| BK6N | 103431.9+660042 | 3.85 | 11.08 | 1.14 | dSph | 1.1 | 6.3 | 73 | 4.87 | 1.32: | 1.03: |
| DDO 87 | 104936.5+653150 | 7.4 | 14.42 | 5.11 | Ir | 1.5 | 8.03 | 6038 | 2.37 | 0.16 | 0.26 |
| KDG 73 | 105255.3+693245 | 3.70 | 10.83 | 0.63 | Ir | 1.3 | 6.51 | 134 | 4.63 | 0.98 | 1.00 |
| U 6456 | 112800.6+785929 | 4.34 | 14.03 | 1.72 | BCD | 0.3 | 7.79 | 734362 | 1.72 | 0.65 | 0.63 |
| U 7242 | 121407.4+660532 | 5.42 | 14.15 | 2.56 | Ir | 0.5 | 7.70 | 597230 | 2.64 | 0.32 | 0.20 |
| N 4236 | 121643.3+692756 | 4.45 | 18.59 | 23.58 | Sdm | 0.4 | 9.46 | g) | 0.65 | 0.11 | 0.03 |
| N 4605 | 124000.3+613629 | 5.47 | 18.07 | 7.79 | Sdm | 1.2 | 8.54 | 65770160 | 0.59 | 0.16 | 1.01 |
| DDO165 | 130626.8+674215 | 4.57 | 15.09 | 4.20 | Im | 0.0 | 8.14 | 112136 | 2.51 | 0.57 | 0.51 |
KDG 52. The detailed distribution of neutral hydrogen and the radial velocity field in this dIr galaxy has been obtained by Begum et al. (2006). Judging by the images taken with the HST (Karachentsev et al. 2002), KDG 52 contains a young blue stellar population. However, Fig.1 does not show any noticeable emission above a detection limit of erg/cm2sec.
DDO 53 and UGC 4483. These are known dIr and BCD galaxies with bright HII regions (Hunter et al. 2004, Gil de Paz et al. 2003).
VKN. This is an object of extremely low surface brightness in the vicinity of UGC 4483, which is likely to be a part of faint Galactic cirrus.
HolmI. The irregular galaxy of low surface brightness with a lot of compact and diffuse emission knots on its periphery.
F8D1, FM1 and KK 77. These are dwarf spheroidal companions to M81 of very low surface brightness. In the vicinity of F8D1 one can see three faint knots (marked by circles), whose possible emission nature needs special check. The flux for F8D1 given in Table 2 refers to these knots.
NGC 2976. This is a late-type Sdm galaxy with unclear spiral structure outlined by bright sites of star formation and dust complexes (James et al. 2004).
BK3N. The faintest of the known M81 companions. Judging by the images obtained with the HST, it has a population of young stars but does not show signs of the emission above the the detection limit of erg/cm2sec. The value of - flux in BK3N is also rather uncertain because of the projected HI envelope of M81.
KDG 61. The compact emission region discovered by Johnson et al. (1997) on the northern side of this galaxy is not typical of dwarf spheroidal objects. A very faint filament structure is also seen in Fig.1 around this compact bright HII region.
A 0952+69. This is a part of the “Arp loop” resolved into stars by means of WFPC2 at the HST (Karachentsev et al. 2002). The presence of numerous small HII regions is evidence of the star formation process in this peculiar structure at the outskirts of M81, occuring at low rates.
KKH 57 and BK5N. Spheroidal dwarf systems without signs of star formation.
NGC 3077 and Garland. The emission in NGC 3077 shows strong concentration towards the galaxy center, where dust clouds also occured. Closer to the outskirts the emission has a filament structure looking like crab’s claws. At the southern periphery of NGC 3077 a chain of associations of blue stars and HII regions is seen, which was called “Carland” (Karachentseva et al. 1985, Karachentsev et al. 1985). With this unusual structure which is likely to be of tidal origin (Makarova et al. 2003), neutral hydrogen filament and molecular clouds are associated ( Yun et al. 1994, Walter et al. 2002).
KDG 63 and KDG 64. Both galaxies are known as dSph systems with an old stellar population. However, on our images of KDG 63 and KDG 64 two and one knots are seen, respectively, (marked by circles in Fig.1), which may prove to be compact HII-regions.
UGC 5423. Judging by the radial velocity , km s-1, and the distance, 5.3 Mpc, this BCD/dIr galaxy with emission knots is situated behind the group M81 or else at its farthest outskirts.
IKN. This very diffuse galaxy is barely seen in a halo of a bright star neighboring from the north. The galaxy emission is visibly absent.
HIJASS. This intergalactic hydrogen cloud has been detected by Boyce et al. (2001) and investigated in detail at the VLA by Walter et al. (2005). Its optical counterpart, if exists, has a total apparent magnitude of about 20m. In the region of this object, one can see in Fig.1 a few faint diffuse knots whose nature can be established by future spectral observations.
HS 117. Basing on its HST images (Karachentsev et al. 2006), this galaxy of regular shape contains a small number of bluish stars. However, the observations of it with GMRT (Begum, 2006), has not revealed sings of the HI emission. On the image of HS 117 near the center, there is a compact knot (marked by a circle), a spectrum of which we are going to obtain soon.
DDO 78 and BK6N. Two dSph systems in each of which we suspect one emission knot (marked by circles). However, judging by the HST images, these are artefacts caused by incomplete subtraction of images of distant galaxies. The fluxes for them given in Table 2 refer to these knots.
DDO 82 and UGC 7242. Irregular galaxies whose images are strongly contaminated by neighboring bright stars. A considerable emission is visible in both galaxies.
DDO 87. This dIr galaxy with a radial velocity km s-1 and a distance of 7.4 Mpc (estimated from the brightest blue stars) is likely to be located behind the group M81. About a dozen compact HII-regions are seen in the galaxy body with practically complete absence of diffuse emission.
KGD 73. This is a dIr galaxy of low surface brightness. The color-magnitude diagram for it obtained with WFPC2 of HST shows the presence of blue stars. In the optical domain of the galaxy we note two very faint diffuse emission regions whose fluxes are at the limit of detection.
UGC 6456 = VIIZw403. Along with UGC 4483 and UGC 5423 this is a third blue compact dwarf galaxy (BCD) in our sample. The bright regions of star formation in it are located assymetrically to the east with respect to the geometrical center of the galaxy.
NGC 4605. It is surprising, but this bright galaxy has never been imaged before in the line. A powerful emission is observed in its disk, which exceeds in flux the emission from another Sdm galaxy, NGC 2976. A system of fine emission filaments attaching to the emission disk of NGC 4605 makes the galaxy looking like a bristled up sea-horse. A long diffuse filament extends on the southern side of the disk while the western side of the disk is likely to contain a great amount of dust.
DDO 165. An irregular galaxy on the far side of the group M81. There are several compact HII-regions in its optical domain along with the common emission envelope.
As we have already noted, the fluxes in a number of galaxies in the M81 group were measured earlier by other authors. We present in Table 3 the data on the star formation rates in 12 members of the group obtained from our measurements (6m) as well as from estimates by other authors reduced to the distances indicated in Table 2. As can be seen, the agreement of log[SRF] proves to be quite satisfactory. The exception is only the discrepancy with the data by Walter et al. (2002, 2006) for NGC 3077 and Garland, the cause of which is not clear to us. For the rest of the galaxies, the average difference of our and other estimates makes log[SFR] with a typical external error of a single measurement of the flux of about 10%.
The line images of galaxies in the M81 group obtained by us and other authors show that the star formation processes in the galaxies belonging to one and the same group are characterized by great variety. In some relatively luminous galaxies (NGC 3077, M82) the main emission comes from the galaxy core. In other bright spiral galaxies (NGC 2976, NGC 4605, NGC 2403, and M 81) the emission is distributed more or less uniformly, over the whole disk. In irregular galaxies with a typical luminosity of the Magellanic clouds (HolmII, IC 2574, NGC 2366) one observes the presence of powerful sites of star formation, and rather often such superassociations being located at the outskirts of these galaxies. In dIr and BCD galaxies of low luminosity, small compact HII-regions (HolmI, DDO 87, UGC 4483, DDO 165) or else separate diffuse emission knots (KK 34, KKH 37) are characteristic features. The presence of emission knots in dwarf galaxies, which have been classified as spheroidal (KDG 61, KDG 63, HS 117) proved to be unexpected, although some of the detected emisssion details, need an additional spectral confirmation. At least, we note the cases where dIr galaxies of very low ) luminosity: KDG 52 and BK3N do not show any detectable flux, although they contain a blue stellar population, seen on the images taken with the HST. Apparently, the potential well in these pygmy galaxies is so shallow that it is unable to hold ionized gas.
| Galaxy | log[SFR] | log[SFR] | source | |
| 6m | oth | |||
| HolmII | -1.05 | -1.01 | -0.04 | Hunter et al. 2004 |
| KDG52 | -5.08 | -4.64 | - | Miller & Hodge 1994 |
| DDO53 | -2.04 | -2.04 | 0.00 | Hunter et al. 2004 |
| U4483 | -2.35 | -2.33 | -0.02 | Gil de Paz et al. 2003 |
| HolmI | -2.13 | -2.09 | -0.04 | James et al. 2004 |
| N2976 | -0.97 | -0.93 | -0.04 | James et al. 2004 |
| N3077 | -0.95 | -0.86 | -0.09 | James et al. 2004 |
| U5423 | -2.17 | -2.21 | 0.04 | van Zee 2000 |
| DDO82 | -2.42 | -2.40 | -0.02 | James et al. 2004 |
| DDO87 | -2.37 | -2.30 | -0.07 | James et al. 2004 |
| U6456 | -1.72 | -1.86 | 0.14 | Gil de Paz et al. 2003 |
| DDO165 | -2.51 | -2.44 | -0.07 | James et al. 2004 |
| N3077 | -0.95 | -1.15 | 0.20 | Walter et al. 2002 |
| Garland | -2.05 | -2.53 | 0.48 | Walter et al. 2006 |
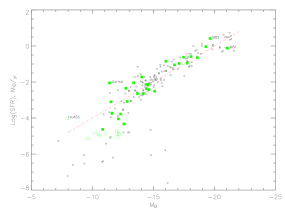
The distribution of 41 galaxies in the region of M81 versus their absolute magnitude and SFR is presented in Fig.2 by squares. The dwarf galaxies with only the upper limit of the flux are indicated by open squares. For comparison, we also present another 150 galaxies from the Local volume ( Mpc) shown by small circles on this diagram. The SFR data for them are taken from Hodge & Kennicutt (1983), Kennicutt et al. (1989), Miller & Hodge (1994), Young et al. (1996), Gil de Paz et al. (2003), James et al. (2004), Hunter & Elmegreen (2004), Karachentsev et al. (2005), and Kaisin & Karachentsev (2006). Here, objects with a low star formation rate [SFR]/year all are companions to the neighboring spiral M31.
As can be seen from this ”giraffe-like” diagram, most of the galaxies with magnitudes from to , situated along the giraffe’s neck, follow a linear relationship [SFR] (shown by the dashed line) with a r.m.s. scatter [SFR]. The M81 group members on this diagram follow the common relation without significant displacement with respect to other Local volume galaxies.
Among the galaxies of the M81 suite, Garland is distinguished by the highest star formation rate per unit luminosity (i.e. specific SFR). Apparently, we observe this tidal structure at the peak of star formation process, in a burst. Among other 150 galaxies of the Local volume, only one BCD galaxy, UGCA 281 = Mkn 209, approaches the Garland in its very high specific SFR.
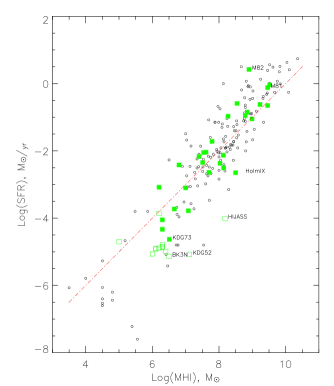
Another useful diagram, showing the evolutionary status of a galaxy, is presented in Fig.3, where the global star formation rate of galaxies is compared with the amount of mass of neutral hydrogen in them. The designations of the M81 group members and other galaxies of the Local volume are given here the same as in the preceding figure. Many authors: Kennicutt (1989, 1998), Taylor & Webster (2005), Taylor (2005), Juneau et al. (2005), Tutukov (2006), Feulner et al. (2006), and Gutierrez et al. (2006), have been concerned with the interpretaion of the character of distribution of galaxies over the diagram [SFR] . As has been noted by these authors, spiral and irregular galaxies follow, on the average, the relation [SFR] , that is, a higher star formation rate is observed in galaxies with larger hydrogen masses. In other words, the use up of the present reserve of gas to from a stellar component occurs in dwarf galaxies in a retarded (“letargic”) mode in comparison with spiral ones, which favours long life of dwarf galaxies. An extreme example here is KDG 52 where there is a young stellar population, but the flux is not amenable to measuring at usual (20 minutes) exposure times. An attempt to detect the emission in KDG 52 and BK3N at much longer exposures seems to be of interest. It should be noted here that from the data by Appleton et al. (1981) and Yun et al. (1994), the central region of the M81 group is filled with HI clouds and filaments, which makes the estimates of the HI mass in BK3N, HoIX, A0952+69, and Garland rather uncertain.
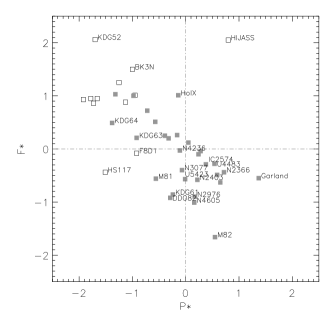
As we have already noted, the suitable parameters to describe the past and future star formation process in a galaxy are dimensionless quantities: =log and = log. The former characterizes what proportion of its luminosity the galaxy would produce during the Hubble time at the current rate of star formation and the mass-to-luminosity ratio . The latter parameter shows how much the Hubble time the galaxy will need to spend the present supply of gas if star formation proceeds at the currently observed rate. The distribution of all members of the M81 group on the plane is displayed in Fig.4. The open squares correspond to the objects in which only the upper limit of the flux or of the hydrogen mass was measured.
The average star formation indicators for the M81 group members of different morphological types are given in Table 4. Its last row indicates the mean specific star formation rate attributed to 1 . The following conclusions can be drawn from the data obtained for the M 81 group galaxies.
| Parameters | Sa-m | Im,BCD | dIr | dSph |
|---|---|---|---|---|
| Number | 5 | 10 | 12 | 13 |
| 18.82 | 15.86 | 12.40 | 11.76 | |
| (mag) | 0.68 | 0.65 | 0.46 | 0.24 |
| 16.64 | 5.59 | 2.50 | 1.90 | |
| (kpc) | 4.25 | 1.31 | 0.54 | 0.22 |
| log[SFR] | 0.47 | 1.42 | 3.28 | 4.56: |
| (/yr) | 0.18 | 0.31 | 0.33 | 0.17 |
| p* | 0.02 | +0.21 | 0.26 | 1.29: |
| 0.15 | 0.14 | 0.23 | 0.13 | |
| f* | 0.62 | 0.48 | +0.50 | +0.55: |
| 0.17 | 0.18 | 0.23 | 0.18 | |
| Log[SFR/A] | 2.77 | 2.66 | 3.85 | 5.03: |
| (/yr/kpc2) | 0.18 | 0.20 | 0.21 | 0.16 |
a) The global star formation rate in the galaxies correlates well with their luminosity, linear diameter and hydroden mass. But, being normalized to the luminosity, the specific star formation rate, SFR/L, has appreciably lower scatter than being normalized to the galaxy hydroden mass or attributed to 1 .
b) Judging by the mean value , spiral galaxies in the M 81 group would have time to generate their luminosity (baryon mass) during the cosmological time billion years. About the same conclusion may be drawn regarding the galaxies of Im, BCD types () as well as dIr galaxies (0.23). However, the dSph galaxies with their are capable of reproducing only 5% of their observed luminosity (mass).
c) According to the mean quantities , which equal 0.17 and 0.18 for S and Im,BCD galaxies, respectively, these galaxies possess the supply of gas sufficient to maintain their observed star formation rates for only the next (1/4 - 1/3) years. On the contrary, dwarf galaxies of dIr and dSph types have the mean gas depletion time of about 3 .
d) The mean specific star formation rate per 1 is almost the same for spiral galaxies (0.18) as for Im, BCD types (0.20). However, for dIr galaxies this quantity turns out to be one order lower (0.21), and for dSph members of the group it drops down to the detection threshold (0.16).
e) All dIr and BCD galaxies with absolute magnitudes fainter than tend to be located on the plane along the diagonal . Because the typical error of measuring log[SFR] is rather small (, the observed diagonal alignement can be naturaly explained by a stochastic burst-like variations of star formation in this type galaxies.
f) Curiously, in Fig.4 the quadrant is almost empty, containing only one peculiar object, the hydrogen cloud HIJASS, with its rather uncertain values of and . It would be interesting to search for similar objects ( dark galaxies being at a start of their stellar evolution ?) also in other nearby groups.
g) The data given in Table 2 show that the environment of spiral and irregular galaxies affects slightly their star formation rate. For instance, eight galaxies at the group outskirts with negative tidal indices have almost the same average SFR (i.e. ) as galaxies of the same types (S,Im,BCD, and dIr) with close massive neighbours (). However, all 13 dSph galaxies with their low SFRs occur in the group core only.
4 Conclusions
The nearest group of galaxies around M81 appears to be a typical group in the local universe in its population, size, velocity dispersion and in the luminosity of the brightest member (Karachentsev, 2005). In contrast to the Local Group, where the value of SFR for the Milky Way remains still unknown, the values of fluxes (or their upper limits) have been measured for all known members of the M 81 group. Beyong the radius Mpc around M81, this group borders on our Local Group and the group around the brightest galaxies IC 342, Maffei 1, and Maffei 2. Assuming a sphere of radius 2 Mpc around M81 to be the local “cell of homogeneity”, we derive the total star formation rate /year which falls within a volume of 34 Mpc3. Consequently, the density of star formation rate in this cell is = /year Mpc3. According to Nakamura et al. (2004), Martin et al. (2005), and Hanish et al. (2006), the average global rate of star formation per unite volume at the present epoch (Z = 0) lies in the range /year Mpc3. Therefore, the M81 group demonstrates the star formation activity 5–8 times as high as the typical neighboring volume. Note that half of the total flux of the group falls on one hyper-active galaxy M82. However, even after its exclusion, excess in for the M81 group and its surroundings is preserved. In this sense, the statement of Miller (1996) that the star formation process in the group M81 is highly active holds true. Possibly, the vigorous activity of this group has two causes: the close approach of massive galaxies M81 and M82, and the high abundance of neutral hydrogen in the group core.
References
- (1) Afanasiev V.L., Gazhur E.B., Zhelenkov S.R., Moiseev A.V., 2005, Bull.SAO, 58, 90
- (2) Appleton P.N., Davies R.D., Stephenson R.J., 1981, MNRAS, 195, 327
- (3) Begum A., 2006, private communication
- (4) Begum A., Chengalur J.N., Karachentsev I.D., Kajsin S.S., Sharina M.E., 2006, MNRAS, 365, 1220
- (5) Boyce P.J., Minchin R.F., Kilborn V.A. et al., 2001, ApJ, 560, L127
- (6) Feulner G., Hopp U., Botzler C.S., 2006, A&A, 451L, 13
- (7) Gallagher J.S., Hunter D.A., Tutukov A.V., 1984, ApJ, 284, 544
- (8) Gil de Paz, Madore B.F., Pevunova O., 2003, ApJS, 147, 29
- (9) Gutierrez C.M., Alonso M.S., Funes J.G., Ribeiro M.B., 2006, AJ, 132, 596
- (10) Hanish D.J., Meurer G.R., Ferguson H.C., et al., 2006, ApJ, 649, 150
- (11) Hodge P.W., Kennicutt R.C., 1983, AJ, 88, 296
- (12) Huchtmeier W.K., Karachentsev I.D., Karachentseva V.E., Ehle M., 2000, A&AS, 141, 469
- (13) Hunter D.A., Elmegreen B.G., 2004, AJ, 128, 2170
- (14) James P.A., Shane N.S., Beckman J.E., et al., 2004, A&A, 414, 23
- (15) Johnson R.A., Lawrence A., Terlevich R., Carter D., 1997, MNRAS, 287, 333
- (16) Juneau S., Glazebrook K., Crampton D. et al., 2005, ApJ, 619, 135
- (17) Kaisin S.S., Karachentsev I.D., 2006, Astrofizika, 49, 337
- (18) Kaisin S.S., Kasparova A.V., Kniazev A.Y., Karachentsev I.D., 2006, Astron. Lett. accepted
- (19) Karachentsev I.D., Dolphin A.E., Tully R.B., 2006, AJ, 131, 1361
- (20) Karachentsev I.D., 2005, AJ, 129, 178
- (21) Karachentsev I.D., Kajsin S.S., Tsvetanov Z., Ford H., 2005, A&A, 434, 935
- (22) Karachentsev I.D., Karachentseva V.E., Huchtmeier W.K., Makarov D.I., 2004, AJ, 127, 2031
- (23) Karachentsev I.D., Dolphin A.E., Geisler D., et al., 2002, A&A, 383, 125
- (24) Karachentsev I.D., Karachentseva V.E., Borngen F., 1985, MNRAS,
- (25) Karachentseva V.E., Karachentsev I.D., Borngen F., 1985, A&A Supp., 60, 213
- (26) Kennicutt R.C., 1998, ApJ, 498, 541
- (27) Kennicutt R.C., Edgar B.K., Hodge P.W., 1989, ApJ, 337, 761
- (28) Kennicutt R.C., 1989, ApJ, 344, 685
- (29) Lozinskaya T.A., Moiseev A.V., Avdeev V.Yu., Egorov O.V., 2006, Astron. Lett. 32, 361
- (30) Madau P., Ferguson H.C., Dickinson M.E., et al., 1996, MNRAS, 283, 1388
- (31) Makarov D.I., Karachentsev I.D., Burenkov A.N., 2003, A&A, 405, 951
- (32) Makarova L., Grebel E., Karachentsev I. et al., in ”Astrophysics and Space Sci., 2003, 285, 107
- (33) Martin D.C., Seibert M., Buat V., et al., 2005, ApJ, 619, 59
- (34) Miller B.W., 1996, AJ, 112, 991
- (35) Miller B.W., Hodge P., 1994, ApJ, 427, 656
- (36) Nakamura O., Fukugita M., et al., 2004, AJ, 127, 2511
- (37) Schlegel, D.J., Finkbeiner, D.P., & Davis, M., 1998, ApJ, 500, 525
- (38) Spergel D.N., et al., 2003, ApJS, 148, 175
- (39) Taylor E.N., Webster R.L., 2005, ApJ, 634, 1067
- (40) Taylor E.N., 2005, astro-ph/0509378
- (41) Tutukov A.V., 2006, Astronomy Reports, 50, 526
- (42) van Zee L., 2000, AJ, 119, 2757
- (43) de Vaucouleurs, G., de Vaucouleurs, A., & Corwin, H., 1976, Second Reference Catalogue of Bright Galaxies, Texas, Austin
- (44) Walter F., Martin C.L., Ott J., 2006, astro-ph/0608169
- (45) Walter F., Skillman E.D., Brinks E., 2005, ApJ, 627, 105
- (46) Walter F., Weiss A., Martin C., Scoville N., 2002, AJ, 123, 225
- (47) Young J.S., Allen L., Kenney J.D., Rownd B., 1996, AJ, 112, 1903
- (48) Yun M.S., Ho P.T., Lo K.Y., 1994, Nature, 372, 530