Cosmic gamma-ray bursts: observations and modeling.
Abstract
It is now commonly accepted that cosmic -ray bursts (GRBs) are of cosmological origin. This conclusion is based on the statistical analysis of GRBs and the measurements of line redshifts in GRB optical afterglows, i.e., in the so-called long GRBs. In this review, the models of radiation and models of GRB sources are considered. In most of these models, if not in all of them, the isotropic radiation cannot provide the energy release necessary for the appearance of a cosmological GRB. No correlation is noted between the redshift, the GRB-spectrum shape, and the total detected energy. The comparison between data obtained in the Soviet experiment KONUS and the American experiment BATSE shows that they substantially differ in statistical properties and the detection of hard x-ray lines. The investigation of hard gamma (0.1 10 GeV) afterglows, the measurement of prompt optical spectra during the GRB detection, and the further investigation of hard x-ray lines is of obvious importance for gaining insight into the GRB origin. Observations of two bright optical GRB afterglows point to the fact that an initially bright optical flare is directly related to the GRB itself, and the subsequent weak and much more continuous optical radiation is of a different nature. The results of observations of optical GRB afterglows are discussed. They point to the fact that the GRBs originate in distant galaxies with a high matter density, where intense star formation takes place. The interaction of the cosmological GRB radiation with a dense surrounding molecular cloud results in the appearance of long-duration (up to 10 years) weak optical afterglows associated with the heating and reradiation of gas. Results of 2D numerical simulation of the heating and reradiation of gas in various variants of the relative disposition of GRB and molecular clouds are presented. In conclusion, the possible relation between the so-called short GRBs and recurrent sources of soft rays in our Galaxy, the so-called soft gamma repeaters, is discussed.
1 Introduction
Nowadays, it is commonly accepted that cosmic -ray bursts (GRBs), the discovery of which was reported in 1973 [55], are of cosmological origin. The first cosmological model based on explosions in active galaxy nuclei (AGN) was proposed in [84]. GRB formation near a collapsing object due to neutrino antineutrino annihilation was investigated in [12]. Previously, the model of GRB formation during collapses and explosions of supernovae was considered in [23], where the following chain of reactions resulting in gamma-photon production was considered:
| (1) |
| (2) |
| (3) |
| (4) |
| (5) |
In brackets, we give photon energies. The reactions with heavy nuclei were also considered in [23]:
| (6) |
| (7) |
The starquake, the subsequent explosion, and the ejection of matter from a nonequilibrium layer in the neutron-star crust discovered in [22] are accompanied by the gamma rays induced by the fission of superheavy nuclei. This scenario was proposed in [23] as an alternative model of the galactic GRB origin. The total number of various galactic models exceeds one hundred. Even now, after the discovery of redshifts in optical afterglows, which became possible due to the x -ray observations of GRB with the Beppo-SAX satellite and their subsequent optical identification, the galactic models are of more than simply historical interest because the origin of short GRBs with the duration of less than 2 s remains uncertain. In [12], it was obtained that the efficiency of transformation of neutrino-flux energy erg into the energy of the - and -ray burst amounts to a fraction with a total GRB energy release erg. The 3D numerical simulation of two colliding neutron stars [86] and a hot torus around a black hole [87] showed higher efficiency of - and -ray production, reaching 0.5% in the first case and 1% in the second case. In part, the distinction with [12] can be associated with the geometry more preferential for the neutrino-flux out- flow when the annihilation rate increases in comparison with that estimated in the spherical geometry [12]. Nevertheless, even in such an optimistic variant, the GRB formation with a total energy yield in the - and -ray regions not exceeding erg is probable. This energy is insufficient for explaining the energy resource of many GRBs because only the direct optical GRB radiation can attain erg, and the isotropic flux in the gamma region reaches erg for GRB 990123 with the redshift [2, 56]. To explain such a high observable energy release, it is necessary to have a strong collimation, which, in turn, is seriously restricted. Here, we discuss various GRB observational data, analyze difficulties and problems of their interpretation in the cosmological model, and consider physical restrictions on the GRB models. In conclusion, we discuss the problems associated with the interpretation of soft gamma repeaters (SGRs) as magnetars and the possible relation between short GRBs and SGRs.
2 Possible energy sources of cosmic gamma-ray bursts
For explaining the GRB radiation, the models of fireball, cannon ball, and precessing jet are used. In these models, the key problem associated with searching for the possibility of an enormous ( erg) energy release over such a short (0.1 100 s) time is avoided. From the various proposed models, we select the following ones.
(i) The coalescence of two neutron stars or a neutron star and a black hole of a stellar mass.
This mechanism was numerically investigated in [86, 87]. The rays are produced here due to the () annihilation, and the energy yield proves to be insufficient for explaining the most powerful GRBs even assuming a strong collimation of the GRB radiation. The energy emitted only in the GRB 990123 optical afterglow [2, 56] exceeds the total radiation energy yield in this model approximately by an order of magnitude.
(ii) Magnetorotational explosion.
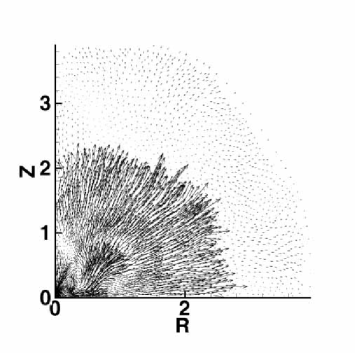
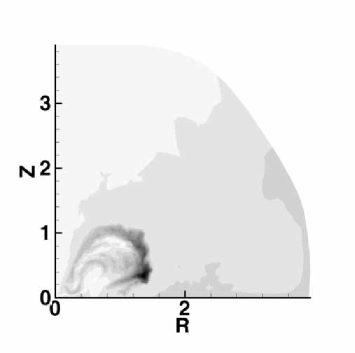
The magnetorotational explosion proposed in [76] as the cosmological GRB model was previously introduced in [15] for explaining supernova explosions associated with a stellar core collapse. The 2D numerical calculations of the explosion of a rotating magnetized gas cloud [5, 6] and the calculations of a magnetorotational supernova [71, 7, 8] showed that the efficiency of transformation of the rotation energy into explosive energy in both cases amounts to about 10%. The released energy is sufficient for explaining the explosion of a collapsing supernova but proves to be insufficient for cosmological GRB. The results of numerical simulation of a magnetorotational explosion are shown in Fig. 1 [71].
(iii) Hypernova.
This model proposed in [76] assumes the possibility of explosion of a very powerful supernova. Nowadays, this model is very popular because it assumes that traces of supernova outbursts are found in optical afterglows of several GRBs [98, 32, 100]. The radiation of a strongly magnetized quickly rotating newly born neutron star for the GRB origin was considered in [105]. Another model of hypernova assumes the collapse of a massive nucleus, the formation of a black hole with a mass surrounded by a massive disk, the fast accretion of which results in the GRB phenomenon [60]. This model seems to be the most promising now. To the collapse-onset moment, massive stars collapsing with the formation of black holes and GRBs were most likely [37, 104] in the Wolf Rayet state a very bright massive compact star which lost its hydrogen shell because of the outflow of matter during the prior evolution. The SN Ic type of supernova, which is presumably observed at site of GRBs and represents a product of the explosion of a massive star devoid of a hydrogen shell, also points to this fact.
(iv) Magnetized disk around a (Kerr) rotating black hole (RBH).
This model is based on extracting the RBH rotation energy for the GRB production due to its magnetic coupling with the RBH and the surrounding accretion disk or torus [106].
(v) Dyadosphere.
In the model [88], the GRB originates from an explosive formation of electron positron pairs and the electromagnetic pulse from an electrically charged black hole surrounded by a baryonic remnant. This model is based on the vacuum explosion in the dyadosphere, i.e., the region in which electric-field intensity supercritical with respect to the formation of pairs is present. The key problem here consists in the possibility of formation of such a strongly charged BH (see also [74]).
(vi) A shock wave beyond the neutron star formed after the supernova explosion in a double system was considered as the GRB source in [51].
(vii) An exotic model of production of GRBs from superconducting strings was proposed in [13].
(viii) The phase transition with the formation of a quark (strange) star.
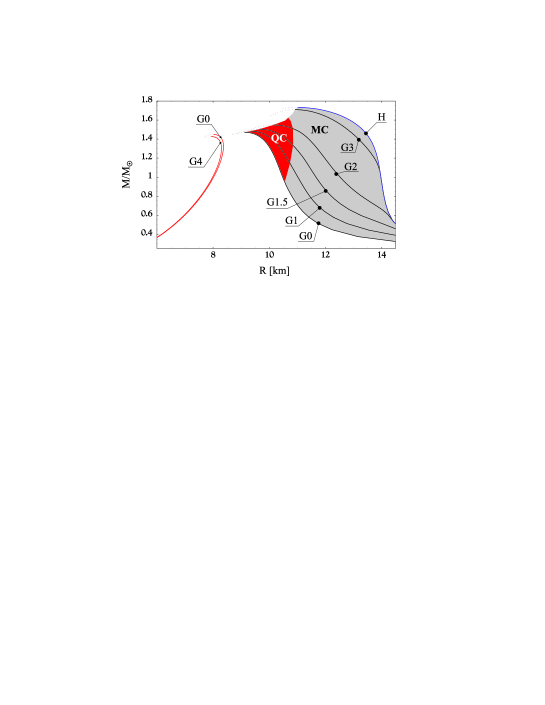
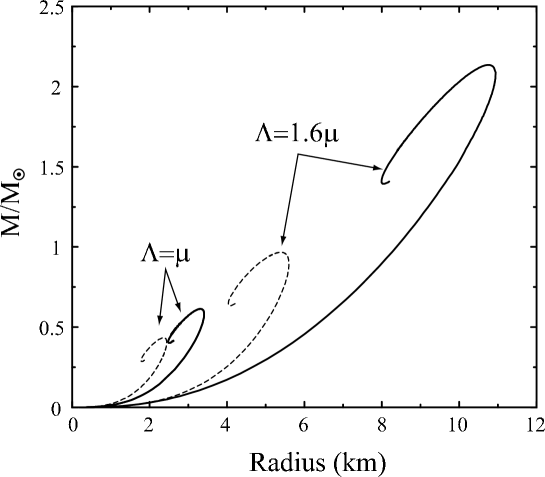
The energy release at the transition of a neutron star into a stable equilibrium state of a quark (strange) star was considered in [14] as the solution to the problem of cosmological GRB. This model could explain the relation of GRB to supernova explosions with the formation of a neutron star and the subsequent enormous energy release during its transition into the state of a quark star leading to the GRB. An attractive property of this model is the possibility of obtaining an arbitrary delay time between the SN explosion and the GRB, which is associated with the transition of hadrons in a quark state and very strongly depends on various parameters. In this model, the delay time can be arbitrarily large so that the majority of SN explosions should result in no GRBs according to observations if this time exceeds the Hubble lifetime of the Universe. Free quarks should not virtually interact, and the density in the case that noninteracting quarks enter an energetically favorable state is very uncertain [14]. In Figs. 2 and 3, the models of neutron and quark (strange) stars are shown on the mass radius plane, and a broad spread in theoretical predictions is seen. A greater spread in the properties of quark stars in Fig. 3 is obtained in [4] within the framework of the same model of quark matter as in Fig. 2, but for a wider variation of parameters.
In the presence of considerable theoretical problems, only observations can settle the question about the possible existence of quark stars. Even in the presence of theoretical uncertainties, it is impossible to obtain a neutron (purely hadronic) star with a radius essentially smaller than 10 km. The observational discovery of compact stars with such small radii would be evidence against their purely hadronic composition.
3 Statistical properties of cosmic gamma-ray bursts
The conclusion about the cosmological origin of GRBs is based on the analysis of their statistical properties and optical-afterglow spectra with strongly redshifted lines.
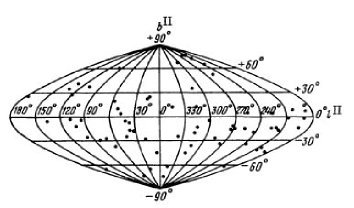
Statistical arguments for the cosmological origin of GRBs are associated with an observed isotropy of the GRB distribution over the sky together with a strong deviation of the distribution (or an equivalent) from the Euclidean homogeneous distribution with a slope of 3/2. The homogeneous GRB distribution over the celestial sphere was obtained first in the experiment KONUS [62] and then confirmed in the experiment BATSE [68] in which more than 3000 GRBs were detected in total during nine years (1991 2000) of observation in space. The results obtained in the experiment KONUS are shown in Fig. 4; in this experiment, 143 GRBs [63] were detected in 384 days.
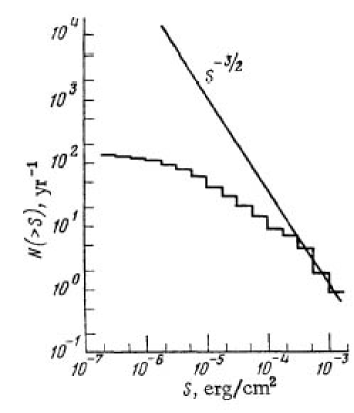
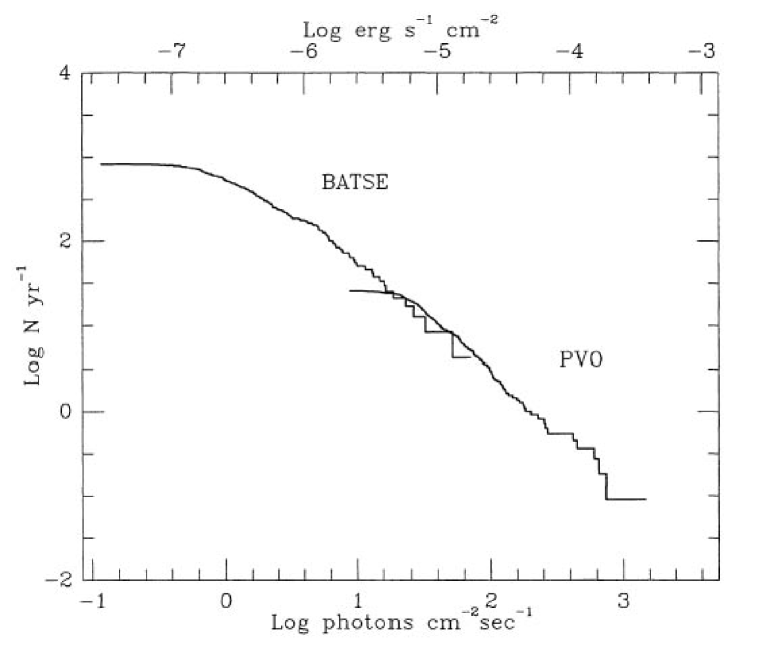
The authors of [62] assumed that the properties observed for the curve are associated with various selection effects and that the true distribution of GRB sources in space is homogeneous. The selection effects in the experiment KONUS taken into account in [42] led to the average value ; here, 0.5 corresponds to a homogeneous distribution of sources. The KONUS data were obtained in 1978 1980 under conditions of a constant background during the flight to Venus. The similar analysis of the BATSE data [91] obtained at a circumterrestrial orbit under conditions of a variable background gave . Figures 5 and 6 display the statistical characteristics of the BATSE data [68, 35] and the number of GRBs here is more than an order of magnitude higher. These two results seem to contradict each other. In the KONUS experiment, the sensitivity is approximately 3 times lower than in the BATSE experiment, and the deviations from a homogeneous distribution with began much earlier [35]. We show the BATSE PVO joint results in Fig. 7 from [35]. The PVO data on the brightest GRBs show good spatial uniformity for GRBs with a slope of 3/2. In [92], M. Schmidt made a detailed statistical analysis and processed the BATSE data by dividing the GRBs into four classes according to the degree of spectrum hardness; he calculated for each class individually. The results of this investigation are listed in Table 1, where determines the spectrum slope obtained from the counts in the second and third BATSE channels with the energy ranges of 100 300 keV and 50 100 keV, respectively. In the column obs, we list the observables corrected taking into account statistical errors in count peaks and, in the column corr, we give the same data assuming the existence of a luminosity degree-of-hardness correlation.
| number | ||||
|---|---|---|---|---|
| 348 | ||||
| 348 | ||||
| 347 | ||||
| 348 |
In the cosmological model, it was possible to expect a lower value of for softer GRBs in the case of a homogeneous set because, with an increase in the redshift, the spectrum becomes softer. The result proved to be the opposite soft sources had a greater value of than the hard ones: 0.47 and 0.27, respectively.

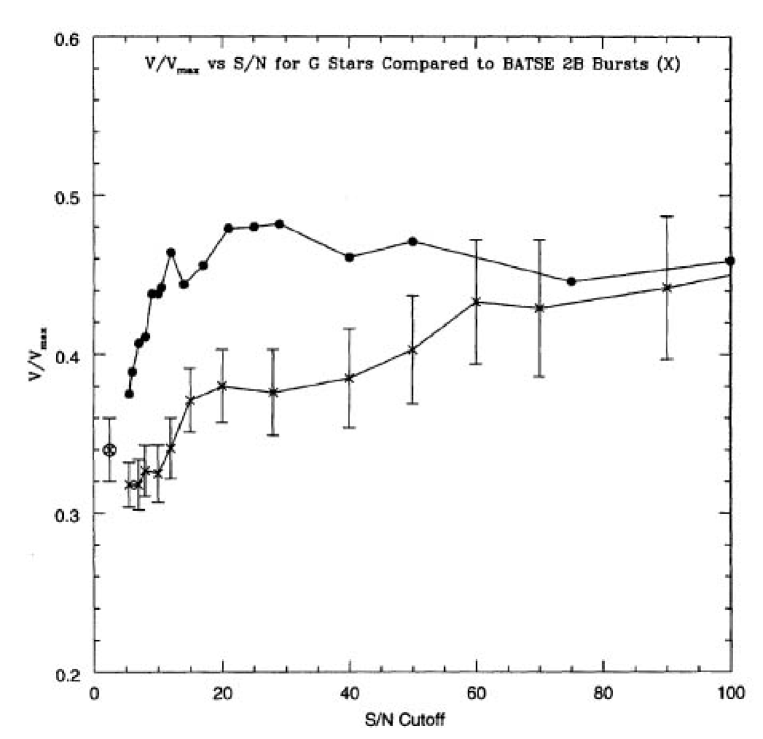
In [92], it was assumed that the increase in the GRB power with the degree of spectrum hardness is so significant that it outweighs the opposite effect caused by the redshift in a homogeneous sample of objects. Another explanation can be that the sample of softer GRBs is more complete because of selection effects. Figures 8 and 9 illustrate a possible key role of the selection effects (incompleteness of the data set and statistical errors in estimates of luminosity in the presence of threshold). The incompleteness of data affects the distribution of such well-investigated objects as G stars of the Sun type. It is possible to expect still greater effects when detecting such short transients as GRBs. The comparison of average values of as functions of the detection threshold for G stars and GRBs in Fig. 8 from [41] shows their qualitative agreement.
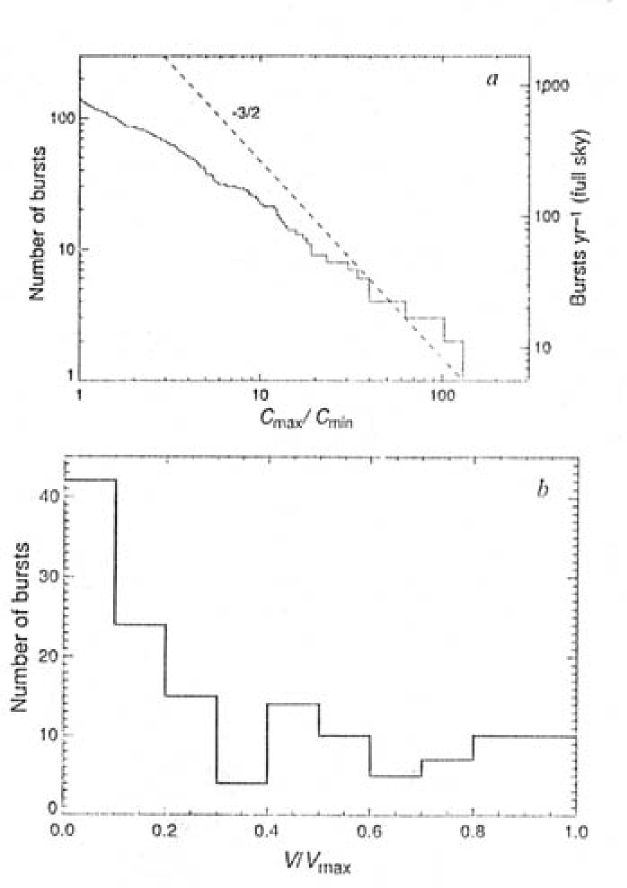
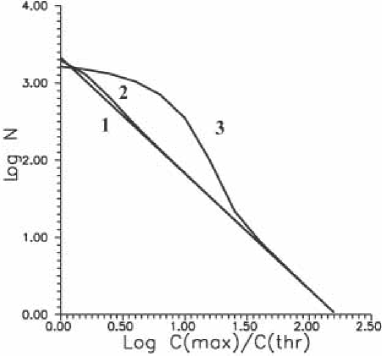
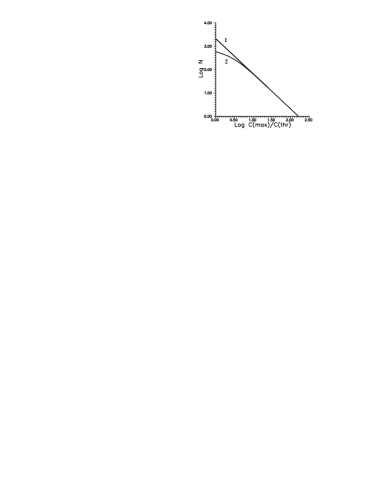
The effect of statistical errors in the presence of a detection threshold is investigated in [17]. The distributions with average statistical errors at the level of ten thresholds are shown in Fig. 9a for the normal distribution of counts and in Fig. 9b for the similar distribution over their logarithms. The distribution in Fig. 9a is similar to the BATSE distribution in Fig. 6.
4 Optical afterglows and redshifts
The x-ray afterglow discovered by the Italian Beppo-SAX satellite made it possible to identify GRBs optically and to obtain their spectra. These spectra showed the presence of a large redshift z, reaching 4.5, which points to the cosmological origin of GRBs and an enormous energy release. In most cases, the redshifts were measured for very weak parent galaxies. The list of certain redshifts is given in Table 2, where the redshift data taken from [34] are supplemented with the total radiated GRB energy [19]. In the table, we listed the numbers of triggers and total energy fluxes of GRBs from the 4B catalogue [75] and total energy fluxes from other sources. The location of optical afterglows in parent galaxies is given in [26]. The enormous energy yield in a short time (from 0.1 s to several hundreds of seconds) is the primary difficulty in the cosmological interpretation. In certain cases, for example, in GRB 990123, the burst isotropic energy ( erg) exceeds the rest energy of the Sun. All of the mechanisms discussed above, with the exception of the Dyadosphere model of Ruffini and collaborators, could give an energy release less than one percent of this quantity. In the case of Dyadosophere the Blackholic energy could fulfill the above requirement
| Trigger | GRB | mag | Z | Type a | Fe | Ref. |
|---|---|---|---|---|---|---|
| number | erg/cm2 | |||||
| 970228 | 25.2 | 0.695 | e | 10-5 | [45] | |
| 6225 | 970508 | 25.7 | 0.835 | a,e | (3+4) | |
| 6350 | 970828 | 24.5 | 0.9579 | e | [39] | |
| 6533 | 971214 | 25.6 | 3.418 | e | (3+4) | |
| 6659 | 980326 | 29.2 | 1? | (3+4) | ||
| 6665 | 980329 | 27.7 | 3.9 | (b) | (3+4) | |
| 6707 | 980425 c | 14 | 0.0085 | a,e | [36] | |
| 6764 | 980519 | 26.2 | (all 4) | |||
| 980613 | 24.0 | 1.097 | e | [114] | ||
| 6891 | 980703 | 22.6 | 0.966 | a,e | (3+4) | [96] |
| 7281 | 981226 | 24.8 | (3+4) | |||
| 7343 | 990123 | 23.9 | 1.600 | a,e | [52] | |
| 7457 | 990308 d | 28.5 | ||||
| 7549 | 990506 | 24.8 | 1.30 | e | [53] | |
| 7560 | 990510 | 28.5 | 1.619 | a | [54] | |
| 990705 | 22.8 | 0.86 | x | [61] | ||
| 990712 | 21.8 | 0.4331 | a,e | |||
| 991208 | 24.4 | 0.7055 | e | [44] | ||
| 7906 | 991216 | 24.85 | 1.02 | a,x | (3+4) | |
| 7975 | 000131 | 25.7 | 4.50 | b | [46] | |
| 000214 | 0.37–0.47 | x | [77] | |||
| 000301C | 28.0 | 2.0335 | a | [97] | ||
| 000418 | 23.9 | 1.1185 | e | [47] | ||
| 000630 | 26.7 | [48] | ||||
| 000911 | 25.0 | 1.0585 | e | [49] | ||
| 000926 | 23.9 | 2.0369 | a | [50] | ||
| 010222 | 24 | 1.477 | a | The brightest on | [80] | |
| BeppoSAX |
a e is the emission line, a is the absorption line, b is the continuum break, and x are the x-rays.
c Relation of this galaxy with SN or GRB is not quite reliable.
d Relation of optical transient with this GRB is unreliable.
e Number of BATSE channel with a maximal flux is indicated in parentheses [75];
otherwise, the estimates of the total energy flux are
given from other references.
4.1 Collimation
To avoid an enormous production of energy, it is assumed that the GRB radiation is collimated. In the cannon-ball model [32], it is assumed that a whole radiating object moves relativistically with a large factor that leads to a collimation solid angle . The analysis of the GRB collimation was made in [85]. A strong collimation-angle restriction follows from the analysis of the probability of the appearance of orphan optical afterglows, which are most likely poorly collimated or not collimated at all. The absence of certain rapidly alternating orphan optical objects results in the following restrictions. In the case of isotropic GRBs, it was expected to detect orphan afterglows so that the absence of such objects assumes that , which suffices for ruling out an especially strong collimation. The similar investigation using the data on afterglows in the radio-frequency band and the variable radio sources made in [79] leads to the restriction on the collimation angle . Because the afterglows in the radio-frequency band occur at the nonrelativistic stage of evolution of a GRB remnant, it is expected to be isotropic, and the restrictions following from the absence of radio orphans at establish a limit on the radiation collimation of the GRB itself.
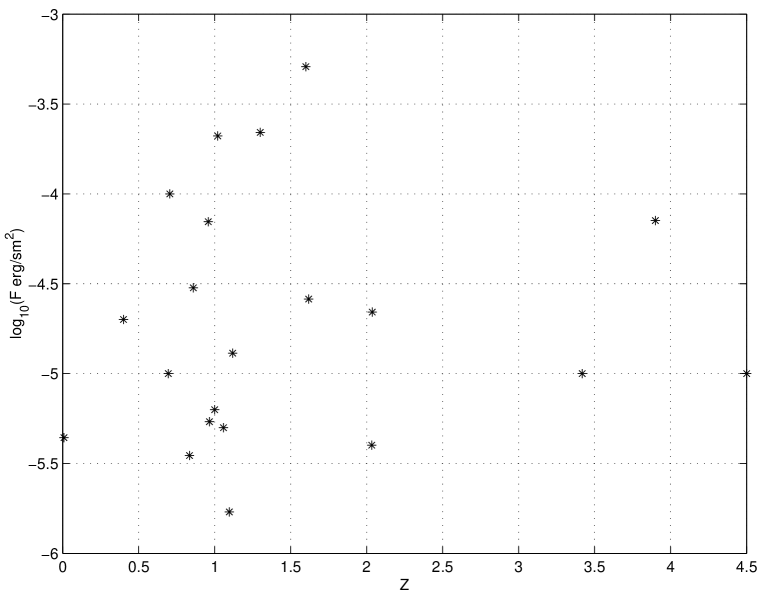
The comparison of redshifts and total energy fluxes from Table 2 shows no correlation between the distance and observable flux (see Fig. 10). This fact is usually explained by a strong collimation leading to a wide spread in observed fluxes due to observations of a narrow beam under different angles of view. If the collimation were associated with the relativistic motion of a source [32], the strong correlation between the observed radiated energy and the GRB duration would be detected in this case: powerful GRBs should have been shorter. The absence of such a correlation allows one to rule out the models based on the ultrarelativistic motion of sources.
4.2 Prompt Optical Afterglows
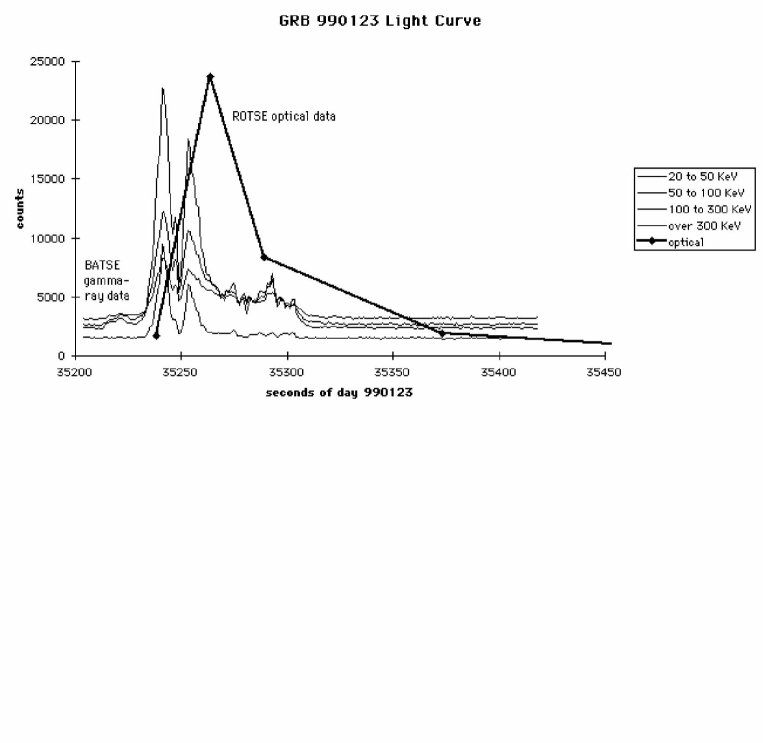
The optical afterglow of GRB 990123 was successfully observed 22 s after the beginning of its detection in the gamma region [3, 2]. GRB 990123 was detected by BATSE in 1999 on January 23.407594. The burst was strong with duration 100 s, involving several peaks (see Fig. 11), and revealed a strong spectrum evolution. The T50 and T90 durations at the 50 and 90% energy-flux levels were equal to 29.82 (0.10) and 63.30 (0.26) s, respectively. The peak of optical brightness at a level of 8.95m was achieved within 30 s after the burst onset, and the brightness decreased down to 14.5m within 95 s. Thus, the optical-radiation peak almost coincided, with a certain delay, with the gamma ray peak. The observed optical luminosity, which was related to the redshift , achieved erg/s, which is brighter by almost five orders of magnitude than the optical luminosity of any supernova. The energy release in the direct optical radiation reaches erg, and an isotropic gamma-ray flux exceeds erg, which is more than the Sun rest energy [2, 56]. Another bright afterglow was observed for GRB 021004 (, ), GRB 030329 (, ), and GRB 030418 (). In brackets, we list the brightest visual magnitudes and redshifts.
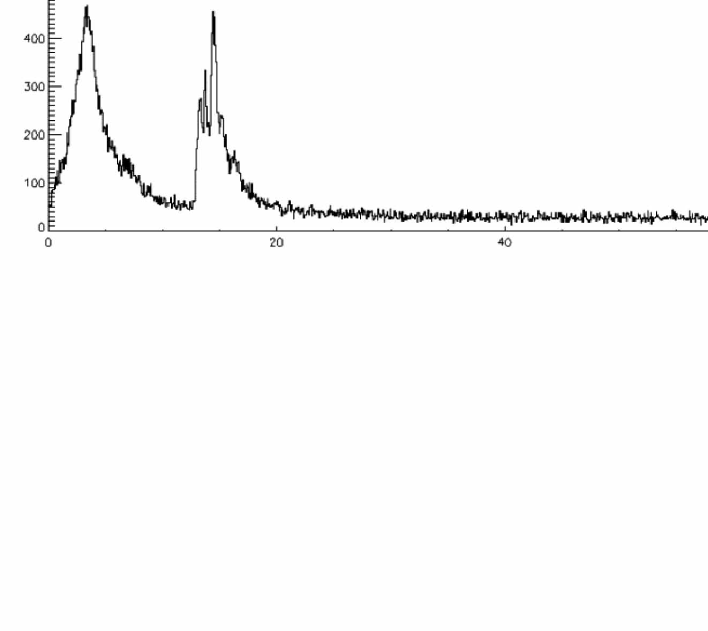
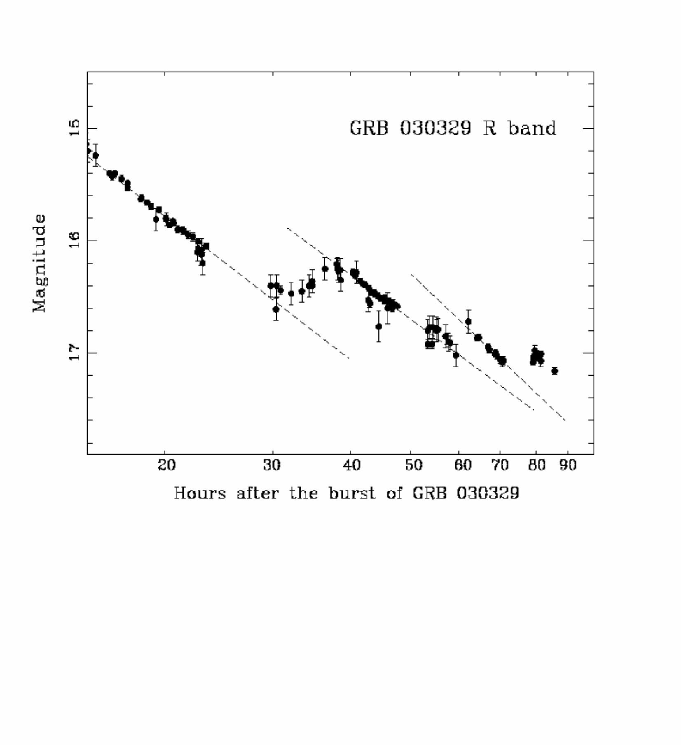
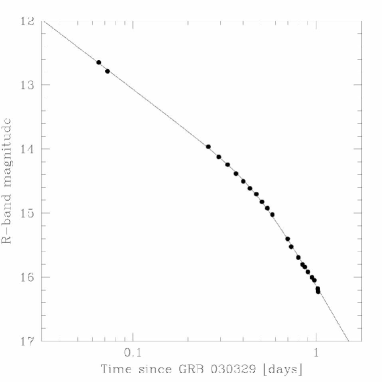
The GRB 030329 afterglow observed at many observatories is most interesting (see, for example, [89]). Features in the afterglow spectrum showed the presence of a supernova [100]. Figure 12 shows the .-ray observations for GRB 030329 in the KONUS WIND experiment, and Fig. 13 taken from [82] shows the light curve for the optical afterglow obtained at the Crimean observatory.


5 GRB and supernovae
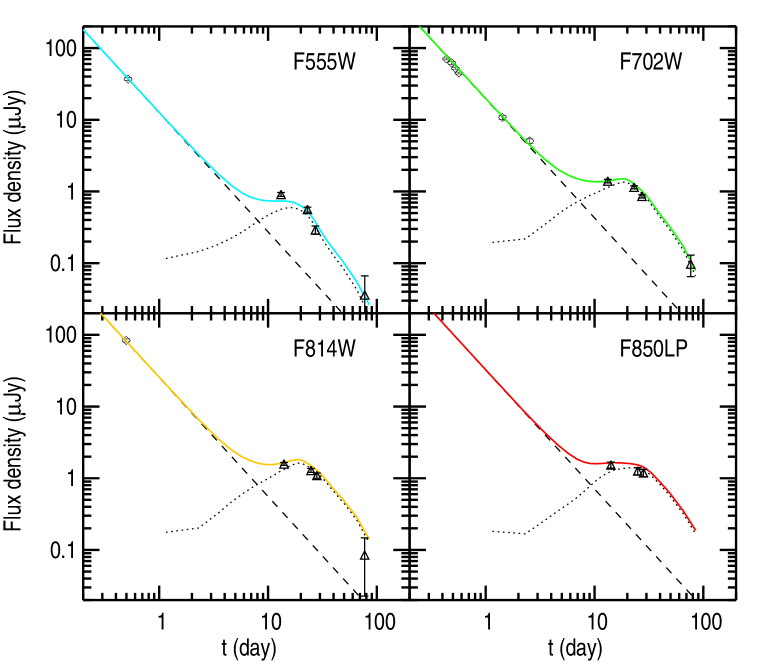
The observational indications of the relation to supernovae are found for the following GRBs: GRB 980425 (, 40 Mpc), GRB 980326 (), GRB 011121 (), GRB 020405 (), and GRB 030329 (). The light curves for certain optical afterglows have a red bump for 15 75 days, which may be induced by an accompanying supernova explosion (see [98], Fig. 16 from [27], and Figs. 18 and 19 from [43]). The indications of the relation between GRBs and supernova explosions were obtained in the observation of GRB 980425, which coincided in the sky with SN 1998bw. This supernova proved to be abnormally bright in comparison with other SNe (such as SN Ib/c) and had peculiar spectra and unusually high radio-luminosity at initial stages [78]. It exploded in a nearby galaxy with a much smaller redshift than those observed in the optical afterglows of other GRBs from Table 2, which points to a low energy release in GRB 980425. It is impossible to rule out that the SN and GRB approximate coincidence in time and projection to the celestial sphere is accidental, and the distances to them are very different. Nevertheless, even given the obvious peculiarity of nearby GRB 980425 with its relation to SN 1998bw, the idea of GRB origin in the explosion of the very bright peculiar supernova SN Ic (hypernova) became very popular. The features of light curves of optical afterglows and red bumps associated with their nonmonotonic behavior were interpreted as the accompanying supernovae, which would otherwise remain unnoticed because of the very large distances to a host galaxy.
Another piece of evidence in favor of the GRB SN relation is obtained from the detailed photometric and spectroscopic investigation of the bright optical afterglow of GRB 030329. At a certain stage, it was noted [100, 43] that the spectra of afterglow and peculiar supernova SN 1998bw are similar; this allowed the authors to declare the discovery of SN 2003dh associated with this GRB.

.
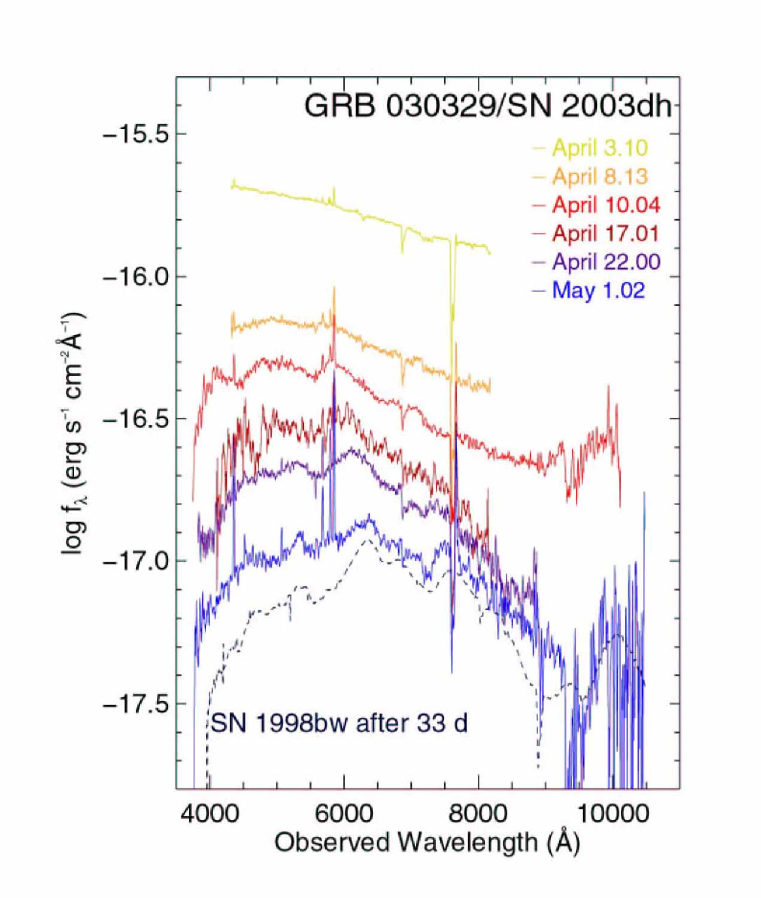
We give the comparison between the spectra of SN 2003dh and SN 1998bw in Figs. 17, 18, and 19. In Fig. 18, the upper spectrum is very well approximated by a power law, which is usually observed in the spectra of afterglows. The intermediate spectrum shows an appreciable difference from the power law similar to that observed in SN 1998bw at the same phase. At the lower spectrum, where SN 2003dh dominates, the supernova features are clearly seen. For comparison, we show the spectrum of SN 1998bw at the 33d day after the flare (the dashed line) shifted according to the GRB 030329 redshift. All the SN 2003dh spectra are presented in observed wavelengths without taking into account corrections on redshift. The lines of absorption in the atmosphere were also omitted. In the range of wavelengths longer than 9000 Å, the spectrum is strongly polluted with lines of the night airglow, but the wide detail around 10 000 Åcan be associated with a supernova. At all stages, the emission lines [O II]3727, Hβ, [O III]4959 and 5007, and Hα are identified as the lines most likely belonging the host galaxy. At the last stage (May 1), the following lines also were identified: [Ne III]3869, Hδ, H, [N II]6583, and the superimposed lines He I3889 + H8 [Ne III]3968 + Hε. Strong Balmer lines point to the fact that the absorption in the host galaxy is weak. The estimate of metallicity based on fluxes in the lines [O II], [O III], and Hβ gives [O/H] = 1.0. The estimate of a star-formation rate as 0.2 M⊙ yr is obtained based on the lines [O II] or Hα Taking into account the 3 upper limit R 22.5m obtained for the emission of the host galaxy when studying archive data, it was concluded that equivalent widths of emission lines are very large. Thus, the host galaxy is the dwarf with a low metallicity and an active star formation that qualitatively coincides with the host galaxy of GRB 980425 and SN 1998bw.
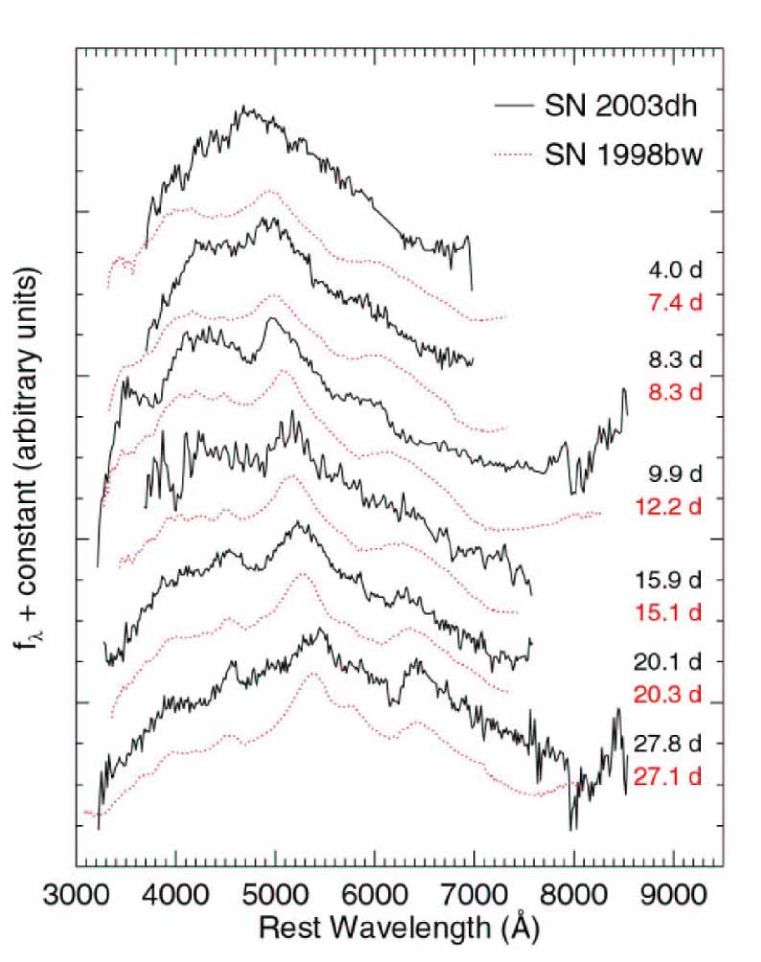
In Fig. 19, the solid lines set the SN 2003dh spectra obtained as a result of the processing described in [43]. The dashed lines set the SN 1998bw spectra observed at similar epochs. We give all the spectra in the restframe wavelengths and marked by indicating days from the GRB-flare moment with taking into account the cosmological time extension . The relative values of spectra along vertical are arbitrary. The SN 2003dh spectrum was divided into 15-Åregions, the lines of the host-galaxy radiation were removed, and an interpolation was made where it was necessary in the region of strong night-sky absorption lines at 6800 Å, 7200 7400 Å, and 7600 Å. The strong absorption ”edge” at 6150 Å(observed at 7200 Å) is likely associated with the night sky absorption. When processing the spectra, it was assumed that these are only the host-galaxy emission lines that were visible and subtracted. The spectrum was fit in the form of the sum of a power part () and the scaled spectrum of the sample SN 1998bw. Using the least square technique, three parameters have been obtained: the spectral index , the afterglow amplitude, and the supernova amplitude. In most cases, the best index was obtained equal to , which was used everywhere; however, this index and the sample spectrum shape only slightly affected the estimate of contribution of supernova in the spectrum shape. The spectral-peak wavelength redshifts in time for both supernova, and the average rate of such a shift amounts to Åper day for SN 2003dh that is similar to the early evolution of the SN 1998bw spectrum. In [43], an increase in opacity on absorption is assumed as the cause of such a shift for the motion in bluer region from 4900 Å(rest-frame wavelength).
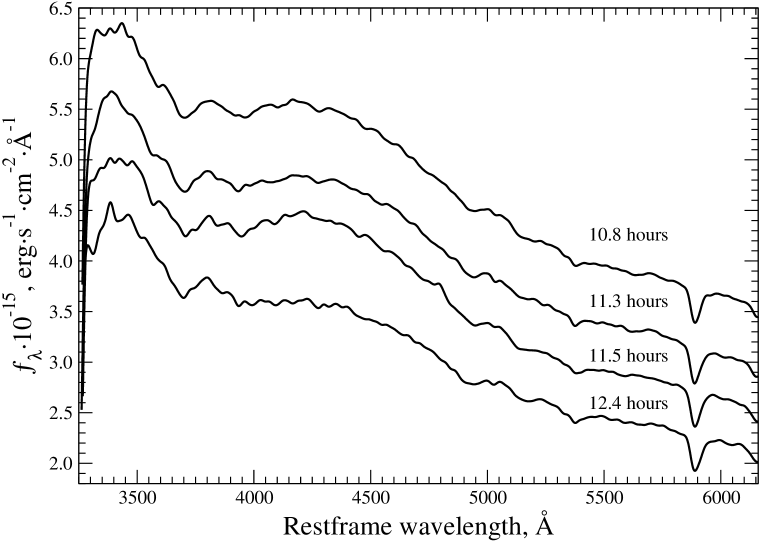
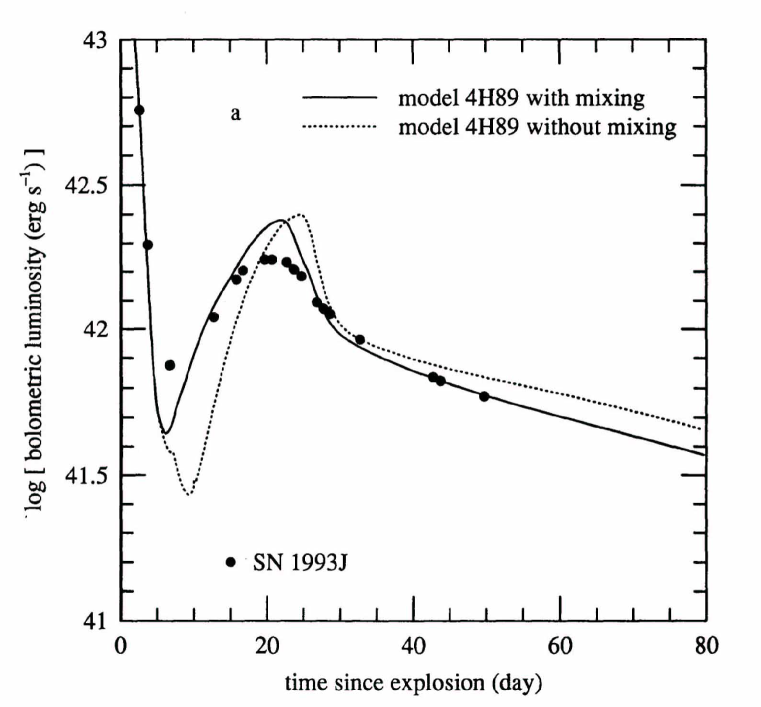
Figure 20 shows the earliest optical-afterglow spectra of GRB 030329 observed in [99]. From the comparison between Figs. 18 and 20, it follows that, at early moments, for example, within 10 12 h after the GRB, the spectral shape was far from that described by the power law to which it evolved within several days to April 3. In Fig. 20, it could be interpreted as the spectrum of an initial strong outburst of SN 2003dh similar to a short initial outburst observed on the light curve for SN 1993J shown in Fig. 21. The model of such an outburst was calculated in [95].
Despite such striking coincidences, the relation between GRB and SN still cannot be considered as firmly established. There are spectral distinctions, time scales differ from standard values, and the spectra of many GRB afterglows involve no indications of the presence of supernovae. In addition, in a unique case when the coinciding GRB and SN were discovered independently, a quite ordinary observable GRB 980425 appeared together with SN 1998bw proved to be very abnormal, being three orders of magnitude weaker than other cosmological GRBs with known redshifts of lines in afterglows (see Table 2).
6 Polarization of gamma rays in GRB
The authors of [30] reported on the discovery of the linear polarization of . rays from GRB 021206. The authors interpreted this fact as a synchrotron radiation of relativistic electrons in a strong magnetic field. Measurements were carried out at the Reuven Ramaty High Energy Solar Spectroscopic Imager (RHESSI). The RHESSI has a set of nine coaxial germanium detectors of a large fiducial volume (300 cm3) with a high spectral resolution for studying x and rays from the Sun in the energy range of 3 keV 17 MeV. The RHESSI has a high angular resolution (2′′) with a field of view of 1∘ of its optics; however, flat focal detectors are unscreened and cover the entire sky. Because of this fact, the RHESSI very frequently detects GRBs in the focal plane of detectors, although the probability to fall into the image-construction field is low. These observations allow the authors to obtain highly resolved spectra, while detection times and energies of individual photons are potentially suitable for measuring the polarization. The RHESSI is not optimized for use as a -polarimeter, but some features of its design make it the most sensitive of modern devices for astrophysical measurements of the -ray polarization [30].
For the soft rays with 0.15 -2.0 MeV, the basic mechanism of interaction of photons with RHESSI detectors is the Compton scattering. A small fraction of incident photons undergoes the single scattering in one of detectors before being scattered or photoabsorbed in another detector. The probability of this sequence of events depends on the polarization of the incident ray. The linearly polarized -rays scatter predominantly in the direction perpendicular to their polarization vector. In the RHESSI, this property of scattering can be used for measuring the polarization of astrophysical sources. The device sensitivity to the polarization depends on an effective scattering area and an average value of polarimetric modulation depth , which is equal to a maximal spread in the probability of azimuthal scattering of polarized photons. This depth is equal to , where , and are the Klein Nishina differential cross sections for the Compton scattering in perpendicular and parallel directions relative to the polarization direction, respectively. It is a function of the incident-photon energy and the Compton scattering angle between the direction of incident and scattered photons. For a source with the count number and the degree of polarization , the distribution of expected azimuthal scattering angles is equal to , where is the azimuthal scattering angle, is the polarization- vector direction, and is the average value of polarimetric modulation depth of the device. Although the RHESSI has a small effective area (20 cm2) for the events in which the scattering between detectors takes place, it has a very large modulation in the region of 0.15 2.0 MeV obtained in the Monte Carlo calculations. According to [30], the results of processing of observational data shown in Fig. 22 convincingly point to the discovery of a strong polarization for the GRB direct rays. The authors of [30] assumed that this result specifies the important role of the magnetic field in the GRB-explosion mechanism. It agrees with the GRB model in the form of a fireball inflated by the magnetic field. This field could be generated due to the rotational energy of an accretion disk differentially rotating around a central compact object, or the rotation energy of the Kerr black hole pierced by magnetic field lines, or the rotational energy of a strongly magnetized neutron star [105]. Another possible model is the generation of a large-scale magnetic field in a flux beyond the shock-wave front.
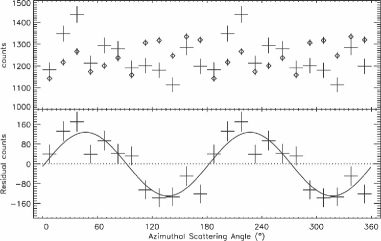
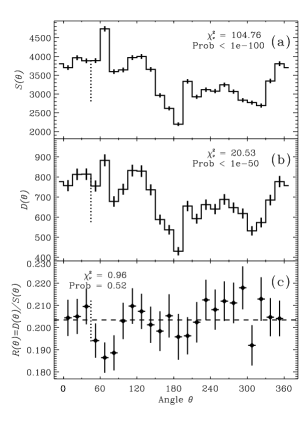
Data [30] were analyzed again in [90], where it was concluded that they give no hint of the detection of a polarized signal (see Fig. 23). First, it was found that the number of polarization events used for the measurement, where the photon passed from one detector to another as a result of scattering and was detected in both, was approximately ten times lower than that estimated in [30] instead of ). As a result, the signal-to-noise ratio proves to be too low for detecting a possible polarization even at the level of 100%. In [90], the authors used another method of data processing for detecting the polarization effect and revealed no indications of the polarization in the GRB 021206 radiation. It was shown that the detected signal can correspond to an unpolarized source, and the polarization observed in [30] is associated with neglecting a systematic error in the zero light curve used in processing. Because of the low signal-to-noise ratio in the RHESSI data, the analysis made in [90] by a method which can be employed only for the analysis of Poisson noise, demonstrated that the data could be consistent with any polarization up to 100%. This points to the fact that it is impossible to obtain estimates of polarization of the GRB 021206 radiation from the RHESSI observations.

In reply to [90], the authors published a new paper rejecting this criticism. It was noted that [90] ”raises many important problems associated with processing the observations, which will be considered in a separate paper being prepared for publication. However, it should be noted that the limit for the detected degree of polarization obtained in [90] with the use of the new method of processing developed there is strongly overestimated. Although we would like to learn in more detail the new statistical technique proposed in [90] (especially with the substantiation of the assumption that the obtained degree of polarization is independent of the instrumental response), we come to an inevitable conclusion that there is a serious gap in their statistical method. In addition, the authors of [90] declared that their analysis is insensitive to an arbitrary level of polarization. Hence, it does not contradict that level of polarization, which was presented in our original paper.” The investigation performed in [113] confirmed the conclusion of [90] that it is impossible to determine the degree of polarization of GRB radiation from the available data. It is possible that the further processing method development and new observations are necessary for overcoming this contradiction; however, the majority is on the side of skeptics.
Nevertheless, even without the assurance in reliability of measurements of the polarization for the direct GRB radiation, certain theoretical models were developed for explaining this phenomenon with the use of both synchrotron radiation [38] and inverse Compton scattering [57]. In [38], the degree of polarization was found for an ordered transverse magnetic field . At the same time, the field generated on the shock-wave front, which is chaotic but located completely in the shock-wave plane, can provide the degree of polarization up to in a solitary pulse on the GRB light curve. However, it is expected that the polarization in the integrated radiation of several pulses measured for GRB 021206 decreases approximately by half. The magnetic field normal to the shock-wave front can provide the degree of polarization for the total radiation of many pulses. However, the measurements of the polarization in GRB afterglows assume a more isotropic configuration of the field generated by the shock wave that should reduce times. Therefore, the ordered field arising in a source can explain the observed polarization most naturally, while is less probable, and is least expected.
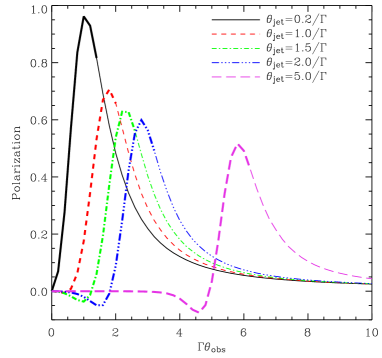
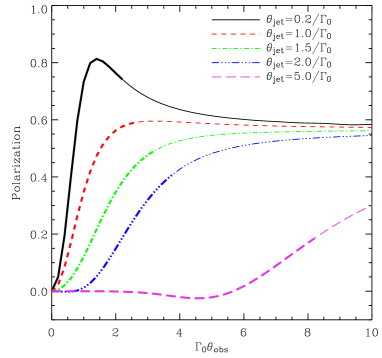
In [57], the inverse Compton scattered radiation of a fireball was considered as the directed jet with an opening angle comparable to or larger than the collimation angle associated with the relativistic contraction of the beam. The degree of linear polarization as a function of the jet-opening angle and the direction to observer were numerically calculated for the Compton upward scattering along the flux for a large-scale motion (see Fig. 24). Note that the gamma factor of the large-scale motion cannot be large due to the absence of apparent inverse dependence of the GRB duration on its power, which is inherent to the model with a large-scale relativistic motion (see section 4.1).
7 Observation of x-ray echo
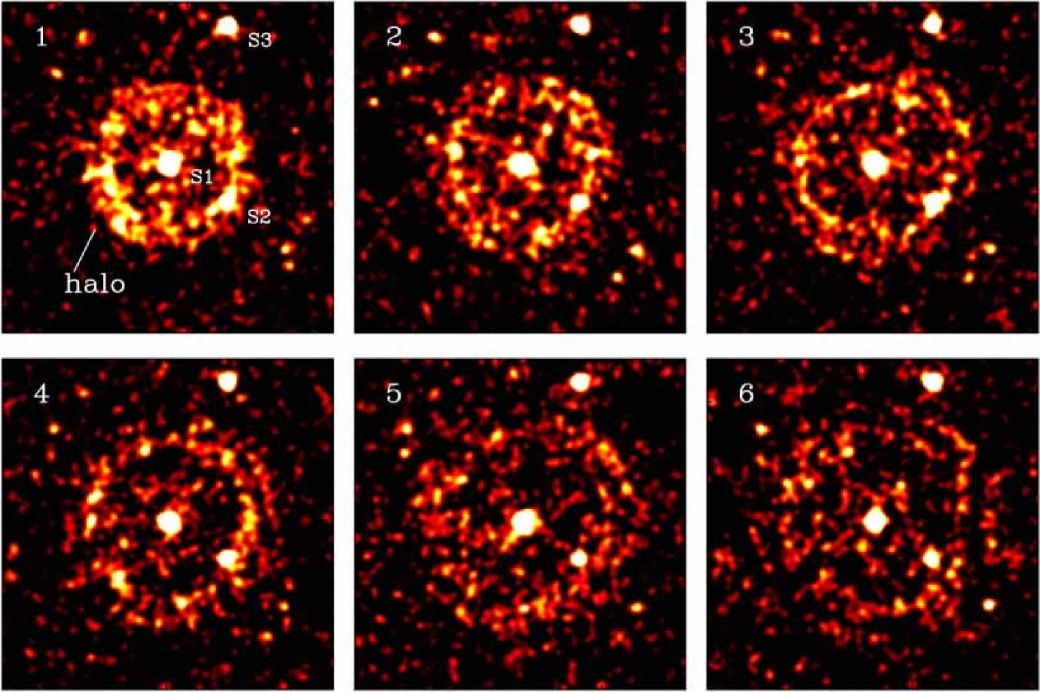
The observations of GRB 031203 at the Newton x-ray observatory (XMM-Newton) began on December 4, 2003 at 04:09:29 UT and lasted 58 211 s. This GRB was detected for the first time by the IBIS device on the satellite INTEGRAL 2003-12-03 at 22:01:28 UT. The analysis of the first observations by the Newton telescope found a diffusive x-ray halo around the afterglow site. All three chambers of the EPIC device observed this halo, and it is not associated with the scattering of optical or -ray photons inside the device. The halo shape was almost a perfect circle, the radius of which increased in time. This recalls the behavior of the light echo going from x-ray photons scattered by the dust of a cloud located at a distance of about 700 pc from the observer [59]. GRB 031203 has galactic coordinates l = 255.74∘ and b = 4.80∘ in the direction of which the Gum Nebula, other nebulas, and infrared sources are located. The distance to the scattering cloud points to its location inside our Galaxy. The -ray spectrum of GRB 31203 is well approximated by the power law with a photon index of . As expected, the scattered x-rays have a softer spectrum with a photon index of [59]. The subsequent analysis shows [107] that the halo appears in the form of concentric circular rings with the center at the GRB localization (see Fig. 25). The radii of these rings grow in time as , which is compatible with a small angle of scattering of -ray photons on a large dust column along the direction of observation of the cosmological GRB (Fig. 26). The appearance of two rings is associated with two different dust layers in the Galaxy located at distances of 880 and 1390 pc, which agrees with known features of the Galaxy structure. The halo brightness points to an initial momentum of the soft rays emitted simultaneously with the observed GRB.
We note that the same law for an increase of the ring radius in time takes place for an arbitrary variant when the ring radius is much less than the distance from a dust cloud to both the observer and the GRB source . Always assuming that , we obtain
| (8) |
Here, is arbitrary, and the time is counted from the moment of detection of the direct GRB -ray (-ray) pulse. When the source is inside the cloud (), we have from Eq. (8) that
| (9) |
In the case of , we have
| (10) |
i.e., the same square-root time dependence. Here, the only requirement is large distances and in comparison with , which can be fulfilled even for the GRBs located at noncosmological distances. Thus, an increase in the radius according to the square-root law is compatible with the cosmological GRB nature, but cannot be considered as proof of this nature.

8 Reaction of a dense molecular cloud to a nearby cosmological GRB
8.1 Optical afterglow from interstellar-gas reradiation
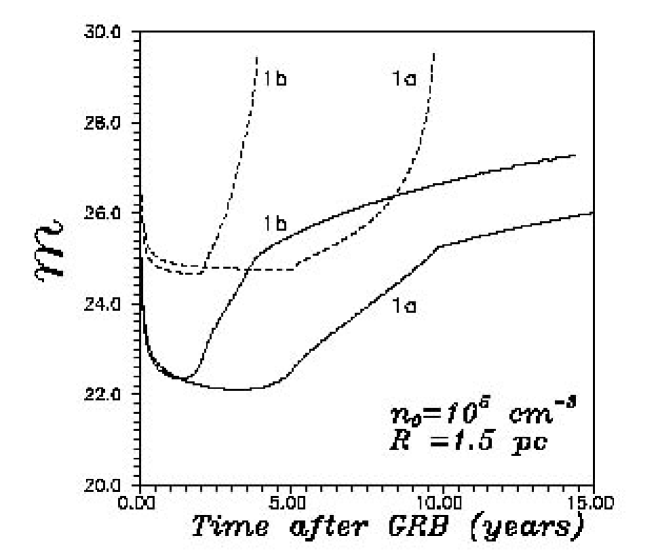
As was noted for the first time in [76] (see also [81]), the GRB-afterglow properties are better explained under the assumption that GRB sources are located in the star-formation regions with a high gas and dust density. The interaction of a powerful GRB pulse with the surrounding gas of a density -3 results in the occurrence of a special-form optical afterglow the duration of which can reach ten years. The light curve and the spectrum of such an afterglow were calculated in [25] (see Fig. 27). It was shown that the duration and spectrum of the GRB optical afterglow depend on the GRB location with respect to the dense cloud because of the interaction of rays with the dense interstellar medium. In the case of an anisotropic GRB, they depend also on the orientation of the observer and the cloud with respect to the GRB axis. During the explosion in a homogeneous cloud, the optical afterglow can endure for ten years. The GRB optical afterglow can be distinguished from a supernova radiation with the same energy yield by the light-curve and spectral features. The and emission lines are strongest in the optical afterglow. The discovery of the similar afterglow would give important information on the GRB-source properties and the surrounding medium.
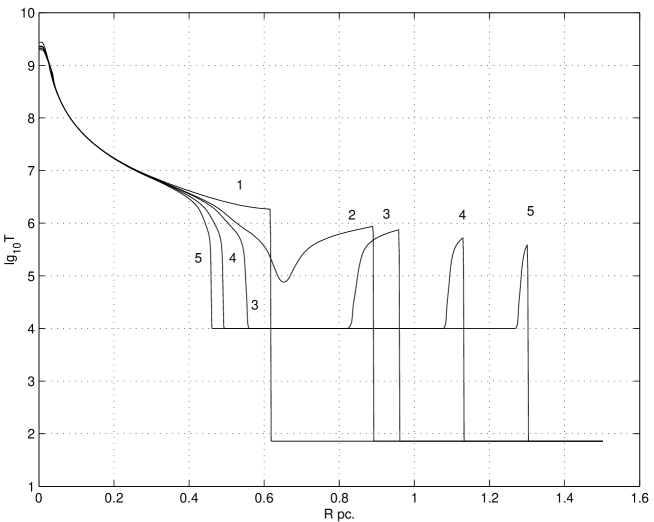
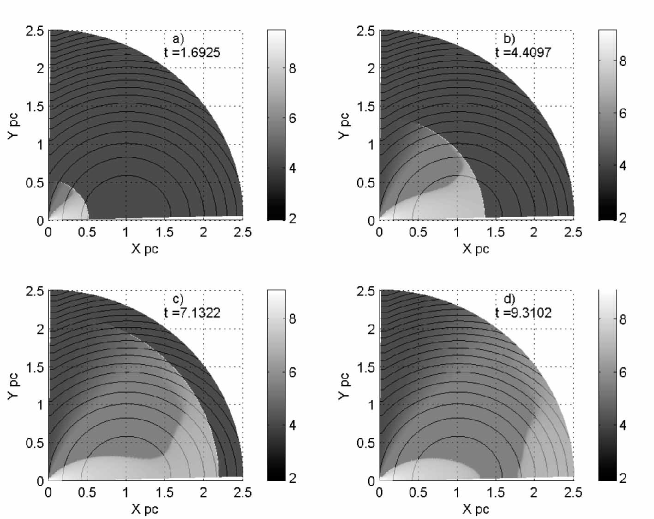
More detailed 2D calculations of the GRB afterglow after the explosion in the star-formation region nearby a cold molecular cloud were made in [9, 10]. Optical light curves qualitatively coincide with those in Fig. 27; however, the large variety of spectra and light curves takes place depending on initial distributions of density in cloud, the anisotropy of density distribution, and GRB radiation. For solving the equations of hydrodynamics with the radiation heating and cooling in the complete-transparency approximation, the PPM method was used. As in [25], the GRB propagation through a cloud was approximated by a very narrow spherical or directed gamma-photon wave leaving behind a completely ionized gas heated by the Compton interaction. When calculating the heating, the Klein Nishina corrections to the Thomson cross section [11] were taken into account. The temperature distribution after an isotropic GRB explosion in the center of a homogeneous spherical cloud is given in Fig. 28. Inside a cloud, the retarded cooling wave, which is associated with a high peak at the curve of cooling in the area of hydrogen helium recombination, is formed. An inverse temperature dependence of the cooling rate results in the development of a thermal instability and the appearance of a thick cold layer between the hot center and thin external heated layer. It is interesting to note that the phase velocity of the external boundary of the cooling wave exceeds the velocity of light, which leads to the con- finement of photons produced in the recombination inside the cold layer [25, 10].
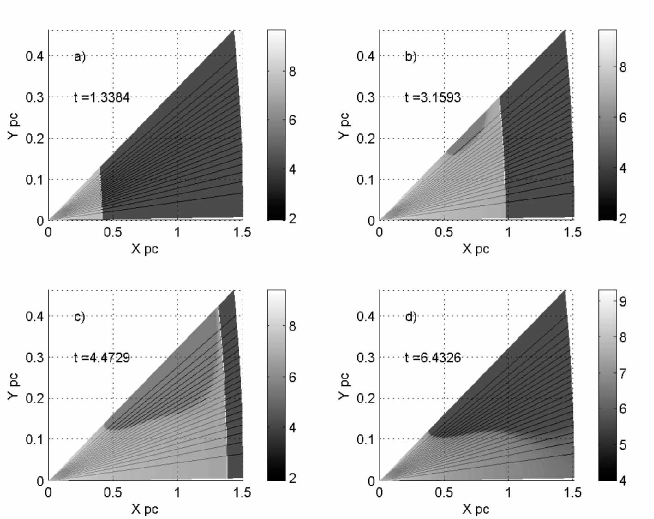
The molecular cloud can be nonuniform, and the GRB flare can take place generally outside its center. It is conventionally assumed that the GRB radiation should be anisotropic being a narrow beam. The results of calculations of the distribution of density for such a general case are shown in Fig. 29. Here, the cooling proceeds faster in the higher-density region so that a thin hot layer is formed behind the GRB-propagation front, and a much thicker hot layer remains in the lower-density region behind the GRB.
8.2 Hydrodynamic motions of gas caused by cosmological GRB
The maximal velocities attained by the matter of a homogeneous molecular cloud after the GRB flare inside it with a total energy release of or erg and the maximal photon energy MeV in a flat spectrum are equal to and km/s, respectively. The further increase in the GRB energy does not lead to increasing the velocity behind the shock-wave front because of the Compton-heating properties [10]. Fast cooling of matter hampers shockwave enhancement even in the case of a nonuniform cloud with a moderate density gradient.
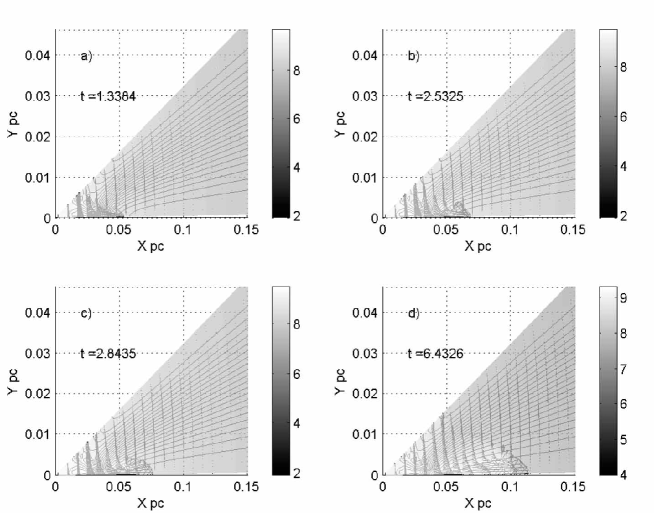
It is possible to achieve a higher acceleration of matter after the GRB flare in some cases of a special distribution of matter around the GRB. When the GRB flares inside a low-density cone inside the molecular cloud, the density gradient is formed inside this cone and results in the jet of matter with a high velocity along the cone axis. The molecular-cloud matter nearby the GRB including that in the cone is heated to almost identical temperatures so that the arising pressure gradient follows the initial density gradient. The motion of matter to the cone axis under the action of this gradient results in the appearance of a cumulative jet along the cone axis, the matter in which is accelerated to the velocity of km/s. The evolution of the temperature distribution and the induced velocity field are shown in Figs. 30 and 31. The conic-type density distribution arises when the GRB flares between molecular clouds in the low-density region (in this case, the jet is ringshaped), or the similar cone can be formed by an anisotropic star wind of a GRB-progenitor star.
The afterglows from an anisotropic GRB flare can have a strong angular dependence because of a strong absorption of light by dust, which is not evaporated after the flare along the directions perpendicular to the GRB axis. This fact can weaken the restrictions on a collimation angle following from the lack of optical orphan bursts because the optical afterglow of similar type is collimated almost the same as the GRB itself. The reradiation on the dust leads to the appearance of an infrared GRB afterglow, which should be more isotropic than the optical one. Therefore, the search for infrared orphan bursts accompanying an anisotropic GRB seems to be more promising.
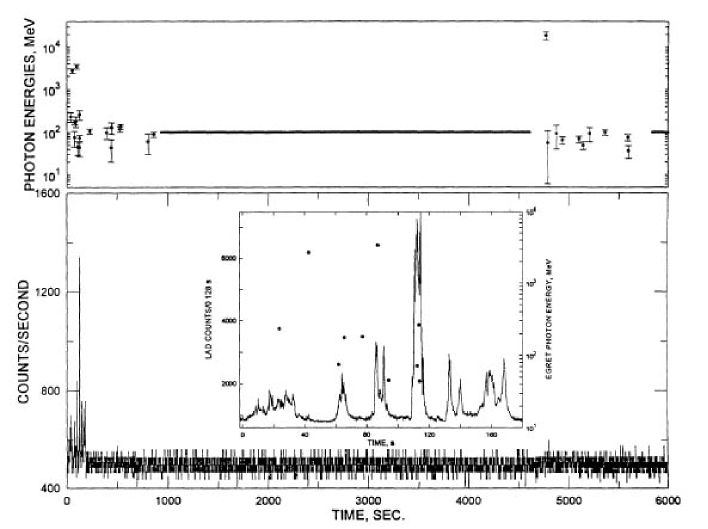
9 Afterglows in high-energy region
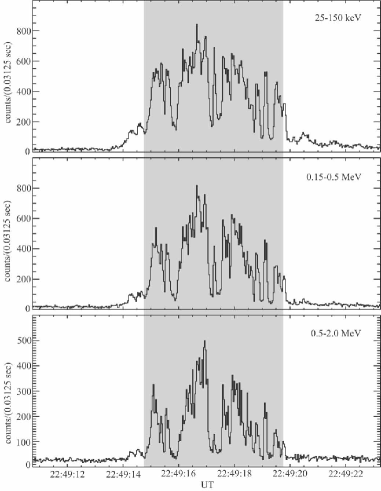
Observations in the EGRET experiment onboard of the orbital Compton -ray observatory (CGRO) show that the GRBs radiate also in hard gamma regions up to an energy of 20 GeV [35]. Hard rays were detected approximately for 10 GRBs, photons with energies over 100 MeV being observed for 5 GRBs listed in Table 3 from [93]. As a rule, the hard rays last longer than the basic soft GRB by up to 1.5 h in GRB 940217 (see Fig. 32). The comparison of the angular aperture in the experiments EGRET and BATSE and also the duration of their operation at the orbit results in the conclusion that the hard rays should be observed during a significant part (approximately one third to half) of the entire GRB. The slope of the spectrum in the hard gamma region is in the range between 2 and 3.7 and quickly varies becoming softer with time (GRB 920622 from [94]). According to the observations in the hard gamma region of a radio pulsar in the Crab nebula [73] and PSR B1055-52 [102], the slope and the variation of their spectra have properties similar to those of a GRB. Taking into account the nonpulsing component of the Crab-nebula radiation, the slope of its gamma spectrum varies between 1.78 and 2.75. If a GRB is associated with the supernova explosion and the neutron-star birth, the residual neutron-star vibrations after explosion can be responsible for a long afterglow in the hard gamma region [16, 103, 33].
| GRB name | Maximal energy | Radiation | Spectral | Delayed |
|---|---|---|---|---|
| (GeV) | duration | function | radiation | |
| GRB910503 | s | X | ||
| GRB910601 | s | X | ||
| GRB930131 | s | X | ||
| GRB940217 | h | X | ||
| GRB940301 | s |
All existing projects in the hard gamma region assume the investigation of GRBs as the primary problem. For this purpose, it is required to have the angular aperture as large as possible. It is expected that the nearest-in-time launch will be that of the small astronomical gamma satellite of the Italian Cosmic Agency (AGILE) of about 130 kg in weight, which should operate within 3 years in the energy range from 30 MeV to 30 GeV according to the project. In the AGILE experiment, it is proposed to use solid-state silicon detectors the fabrication technology of which is well developed. It is proposed to achieve the optimum angular resolution when constructing the images in the gamma region at a level of - for powerful sources and to perform the observation in an unprecedented large field of view of about 3 sr. This results in an effective sensitivity which is comparable with that of the EGRET for point sources observed along its axis and much higher for the sources away from the axis. The detection of GRB is expected in the range above 50 MeV at a level of 5 - 10 events per year [1].
The gamma large-area space telescope (GLAST), slated for launch later, is an international space project with the participation of the space agencies of various countries. The project is purposed for the space investigations in the energy range from 10 keV to 300 GeV. After the realization of several successful research space projects in the field of gamma-ray astronomy, the EGRET project was realized onboard of the CGRO launched in 1991. In the EGRET experiment, the first complete survey of the sky in the energy range from 30 MeV to 10 GeV was performed, and the majority of sources discovered in this survey remained unidentified. In the GLAST experiment, the investigations of the gamma region will be carried out in the range 20 MeV - 300 GeV. The comparative characteristics of GLAST (EGRET) are as follows. The maximal effective region amounts to 8000 cm2 (1500 cm2), the field of view exceeds 2 sr (0.5 sr), the angular resolution is better than 3.5∘ at 100 MeV and better than 0.15∘ at energies higher than 10 GeV (5.8∘ at 100 MeV), the energy resolution is better than 10% (10%), and the localization accuracy (radius at the 1- level) for steady high-altitude sources with large and a flux of 10-7 cm-2s-1 in the energy range higher than 100 MeV amounts to less than (15′). On board GLAST, the almost-all-sky monitor in the soft gamma region is specially mounted to obtain simultaneously the data in soft and hard gamma-photon energy regions for the independent detection of GRBs. As in the experiment AGILE, the detector for detecting hard gamma photons comprises 18 silicon strips. This technology has a long and successful history of application in experimental high-energy physics in accelerators. It has a high detection efficiency (99%), an excellent positional resolution (60 m in this design), and a high signal-to-noise ratio (20 : 1). GLAST is expected to have high detection efficiency at energies above 10 GeV and the possibility of GRB localization with accuracy reasonably high for the fast search of their radiation at all larger wavelengths. GLAST is expected to detect about 200 GRBs per year, half of them located in the radius of no more than 10 arcmin, giving a good possibility to obtain the image of the region with GRBs using a large-aperture optical telescope [72].
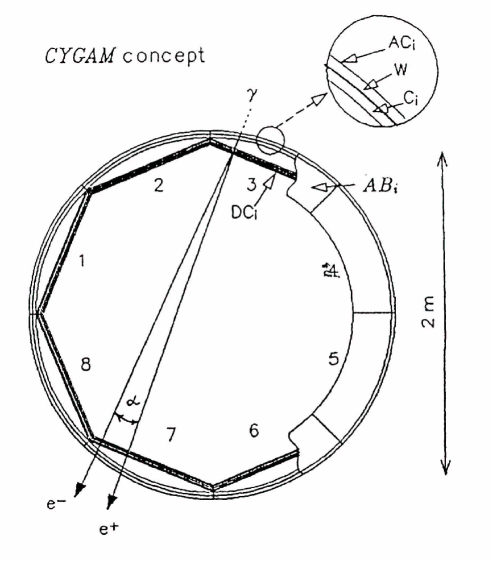
The original design of the gamma telescope in the energy region higher than 0.5 – 1 GeV was considered in [24, 58, 31] and named CYGAM Cylindrical Gamma Monitor. The principal schematic drawing of CYGAM is shown in Fig. 33. The hollow inside cylindrical shape allows the authors to reduce the weight of the device several times for the same sensitivity and the best angular resolution at an energy of about 1 GeV. In this scheme, the drift chambers [31] were stipulated for detectors; however, the above silicon strips can also be used instead of them. It is possible to expect that, in the energy range of 1 – 10 GeV, the CYGAM should have characteristics comparable to or even exceeding those of the GLAST, being almost three times lighter and, correspondingly, cheaper to manufacture. The large field of view of approximately 7 sr will be highly suitable for detecting GRBs.
10 Lines in the hard -ray region
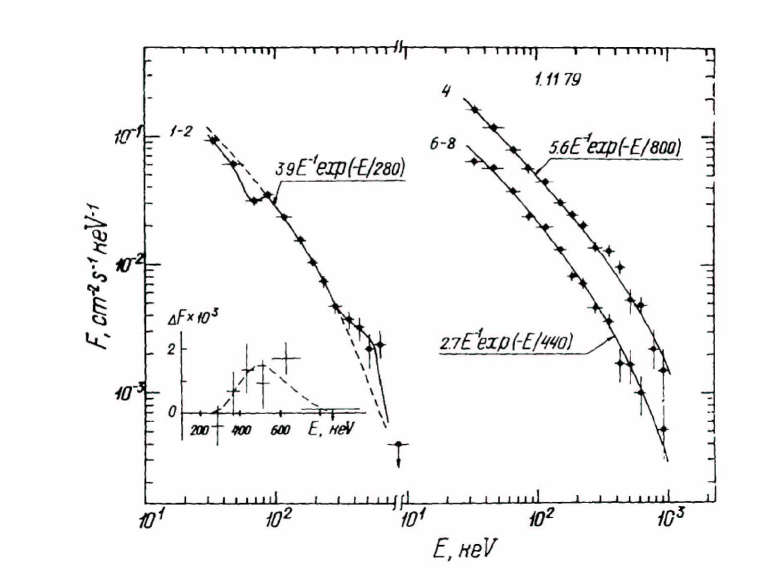
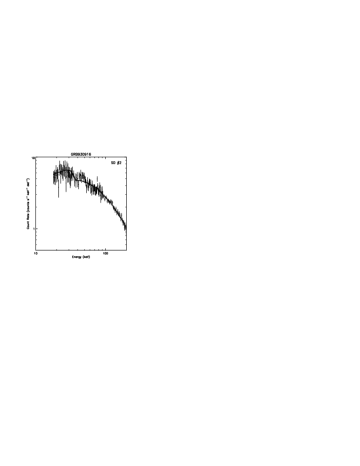
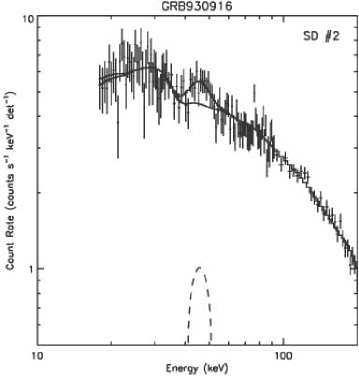
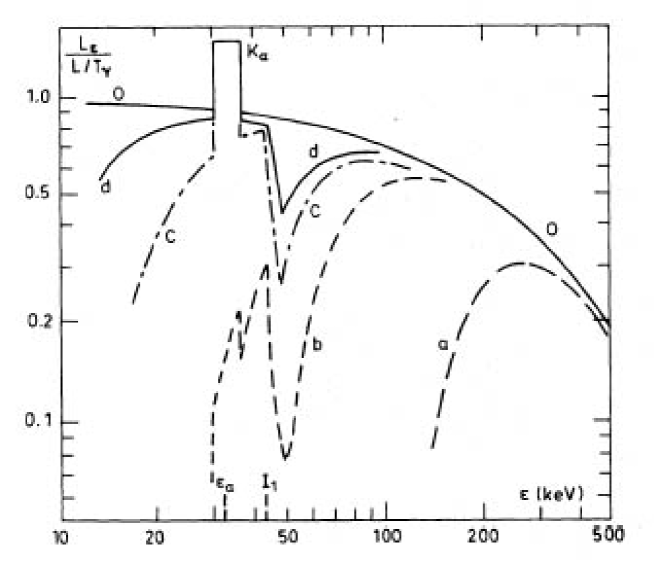
Lines in the hard x-ray region of GRB spectra were discovered in the experiment KONUS [64]. They were interpreted as cyclotron lines and observed in approximately 30% of GRBs. The lines and spectra were strongly variable: an observed absorption-line depth decreased in time (Fig. 34). The BATSE detector had the lower spectral resolution, and, for a very long time, no lines were found in the observed spectra. In later publications, at last, the presence of spectral details in the hard-x-ray region of BATSE GRB spectra was reported [29]. In this paper, when investigating the spectra of 117 GRBs, statistically significant lines were found in 13 GRB spectra. A good example is GRB941017 for which the consistent lines are well seen in the spectra of two detectors. For some GRBs, one detector observed a line, while it proved to be statistically insignificant for another detector. Figure 35 shows the spectrum of GRB 930916 with the statistically significant line from [29]. In this paper, the authors affirmed that the doubts about the reality of the spectral details of GRBs in the hard -ray region will remain until the causes for the differences between spectra of the same GRB observed by different detectors are understood. However, we note that the GRB 930916 spectra were obtained only within 20 s after the flare onset, and, according to [64], the strongest spectral details were observed at the GRB initial stage (see Fig. 34). The only study devoted to the interpretation of such lines in the cosmological model [40] is based on considering the spectrum strongly shifted in the blue region (the corresponding relativistic factor ) for the gas cloud illuminated by the fireball rays. A similar model was proposed in [21] for an explanation of the lines observed in the experiment KONUS within the framework of the GRB galactic model [23]. The model was based on the explosion near the neutron-star surface resulting in the jet of an expanding cloud with in which a line absorption occurs (see Fig. 36). In this model, the observed attenuation in the absorption versus time (Fig. 34) was related to a decrease of the absorption thickness during the expansion of the cloud.
11 GRB and origin of ultrahigh-energy cosmic rays (UHECRS)
In [69], it was noted that the squares of errors of two events associated with cosmic rays (CRs) of the highest energies overlap with the squares of errors of strong GRBs. GRB 910503 and GRB 920617 were observed 5.5 and 11 months before the corresponding CRs, respectively. In one of the cases, the most powerful CRs coincide with the most powerful GRB from the BATSE catalogue. Accidental coincidences of such events is very low; therefore, it was assumed in [69, 70] that the same phenomenon results in the occurrence of both GRBs and ultrahigh-energy CRs. A time delay, as well as a small divergence at the celestial sphere is expected because the magnetic field affects the trajectory of a CR charged particle and makes it curvilinear. The estimates show that only the Galaxy field taken alone can lead to an observed delay of CRs in comparison with GRBs. If we assume that the energy release in CRs and GRBs is approximately identical [69], several tens of percents of the strongest GRBs can explain the available experiments on detecting ultrahigh-energy CRs (UHECRs).
The assumption that GRBs are the sources of UHECRs was almost simultaneously made in [110, 111, 108]. The isotropy of distribution of both events in the sky and their cosmological origin point to the GRB UHECR relation. In addition to this, the observed energy-release rate (per unit volume) in GRB rays proves to be comparable with the high-energy-proton energy, which is necessary for explaining the observable UHECR flux. The energy-release rate was estimated in [112] (see also [109]). It was assumed that the extragalactic protons in the energy range from to eV are produced in cosmologically distributed sources with the following density and spectrum:
| (11) |
The energy-release rate in a GRB can be estimated assuming that a local () GRB frequency amounts to [92]. In this case, an average GRB energy with known redshifts in the MeV range of the -photon energy is equal to erg. The GRB frequency with known redshifts is less than the total observed GRB frequency by a factor of . The factor 0.7 is associated with the GRB detection threshold by the satellite Beppo-SAX, which is approximately two times higher than that found from the BATSE data used for estimating the total GRB frequency. The factor 0.5 is associated with the fact that optical afterglows are detected only for approximately half of GRBs. Thus, the local () energy release rate in the MeV-photon region during the GRB flares is equal to
| (12) |
This energy-release rate is comparable with that for UHECRs from Eq. (11).
The energy-release rate can be estimated in another way using the luminosity function obtained in [92]. On the basis of the large set of GRB events, it was found that the number of GRBs as a function of the peak luminosity follows a power law in the range from to erg/s and then abruptly falls. Using a value of erg/s for the peak luminosity and 10 s as an average equivalent time of the total energy release, we estimate the total GRB energy-release rate to be approximately an order of magnitude less than that followed from Eq. (12). This value is more than ten times less than the UHECR energy-release rate from Eq. (11). With taking into account the large number of uncertainties, even the divergence in order of magnitude cannot be the basis for the final refusal to consider the hypothesis about the GRB - UHECR relation.
12 Short GRBs and SGRs
The cosmological GRB origin creates many problems when constructing a realistic physical model. The basic problem consists in the difficulty of obtaining an enormous energy release over such a short time in a small volume. For a collimated GRB, the requirements on the energy release decrease; however, the collimation angle cannot be too small. Observations of optical orphan bursts during the complete sky survey by optics can essentially improve the restrictions on the collimation angle. The measurements of optical spectra of prompt afterglows, while optical luminosity is still reasonably high, and the investigation of the polarization in optical and x-ray regions are very important at this stage for clarifying the radiation mechanism.
It is probable that GRBs do not represent a homogeneous set of events and consist in bursts of completely different origins. The statistical analysis reveals at least two separate sets consisting of long-duration (2 s) and short-duration bursts. We note that optical afterglows with determining the redshifts were measured only for long bursts. Therefore, it is possible that the short bursts are of another origin (possibly, even galactic).
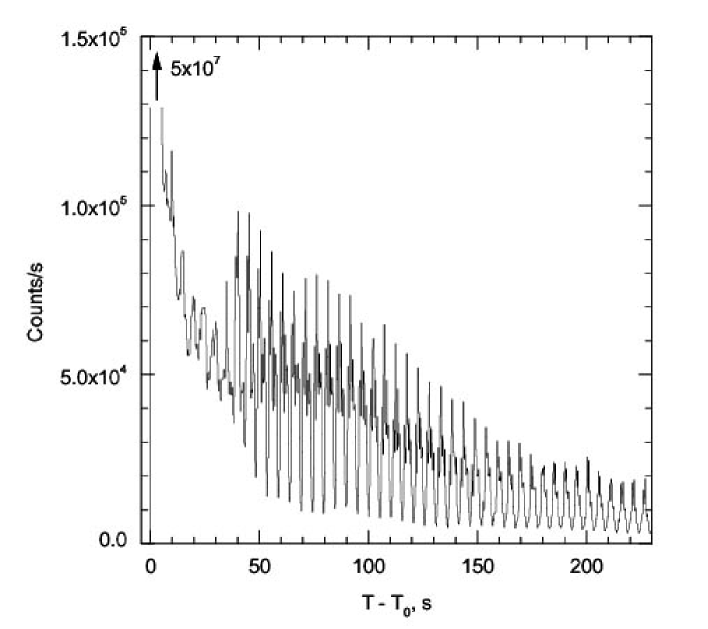
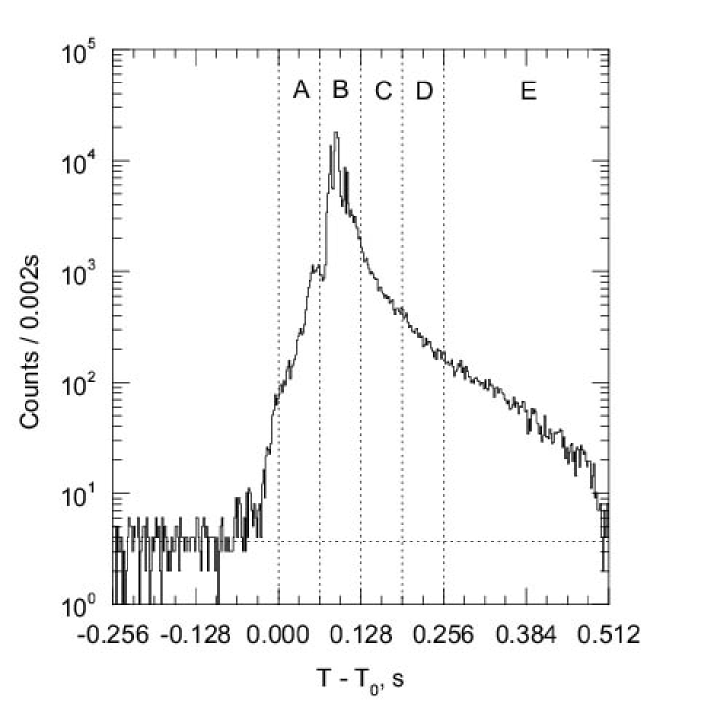
It is interesting to compare the properties of short GRBs with giant flares of soft gamma repeaters (SGRs) located inside the Galaxy. If the SGRs were located at a greater distance on which a usual activity of SGRs would not be seen, and only giant bursts would be detected, these last would be attributed, without doubt, to conventional short GRBs. The light curves of two giant bursts are shown in Figs. 37 and 38 according to the observations by the KONUS -WIND device [66, 67]. The frequency and power of giant SGR bursts observed already in all four reliably identified SGRs in the Galaxy and in the Large Magellanic Cloud (LMC) are such that there is a real possibility of their observations from local-group adjacent galaxies as short GRBs. The estimates show that, by statistics, more than 10 short GRBs of similar type should be observed from the Andromeda Nebula (M 31) and other local-group galaxies [18]. No GRBs in nearby adjacent galaxies could point to the fact that the observed SGRs are closer and weaker objects than it is believed now on the basis of their possible genetic relation to supernova remnants (SRs), the distances to which can be estimated. It is possible that this relation does not exist at all [18].
.
13 Conclusions
Despite more than 30 years of observations and numerous attempts at constructing theoretical models, until now, there is no authentic model either for the formation of observable radiation or for the GRB energy source. Although long GRBs are most likely of the cosmological origin, it is possible that short GRBs have another origin (probably, even galactic) and are associated with giant SGR flares [65].
Critical experiments, which could finally clarify the GRB nature, are associated with observations in all regions of the electromagnetic spectrum. In optics (from infrared to ultraviolet), it is necessary to obtain GRB spectra at the earliest stages as close as possible to the time of the -ray burst itself. This problem is formulated for wide-angle automatic telescopes, which already operate or are being designed in various countries. They should be quickly directed to a sky region using the information obtained from a gamma satellite right after the detection of a GRB. Similar problems is solved by the specialized satellite SWIFT launched on November 20, 2004 and purposed for observations of GRBs in a wide range from hard x rays (150 keV) to the optical band. SWIFT registers about 100 GRBs with a localization accuracy of about 1’ within one year of operation. An important observational problem in optics is the search for the orphan bursts not accompanied by a -ray pulse. about the degree of collimation of the gamma pulse. Such observations require a long-term all-sky scanning using optics; they are possible with either a system of continuously operating very wide-angle telescopes covering the entire sky or a specialized satellite with an optical telescope (or system of telescopes) the all-sky monitor. In addition to the gamma observations for detecting GRBs in the energy region of about one MeV, the essential information can be obtained from observations in the hard gamma region with a photon energy ranging from a hundred MeV to tens of GeV. Such observations in the same energy range are planned to be carried out by the gamma large-angle space telescope (GLAST) with the expected launch in 2007 and by the gamma small space telescope AGILE, which should be launched earlier. The collapse of a high-mass star nucleus with the formation of a black hole surrounded by a massive rotating disk represents the probable cosmological GRB model. The fast fall of the disk onto the black hole as a result of the magnetorotational processes accompanied by an enormous energy release in the form of neutrino, radiation, and electron positron pairs can be the origin of GRBs. The possibility of originating GRBs in exotic processes associated with cosmic strings, antimatter, etc., is also not excluded.
References
- [1] AGILE Homepage, 2004, http:agile.mi.iasf.cnr.it.
- [2] Akerlof C. W., Balsano R., Barthelemy S. et al., 1999, Nature, 398, 400.
- [3] Akerlof C. W., McKay T. A., 1999, GCN 205 (GRB990123).
- [4] Andersen J. O., Strickland M., 2002, Phys.Rev., D66, 105001.
- [5] Ardeljan N. V., Bisnovatyi-Kogan G. S., Moiseenko S. G., 1997, Physics-Uspekhi, 40, 1076.
- [6] Ardeljan N. V., Bisnovatyi-Kogan G. S., Moiseenko S.G., 2000, Astronomy and Astrophys., 355, 1181.
- [7] Ardeljan N. V., Bisnovatyi-Kogan G. S., Moiseenko S.G., 2004, Astrofizika, 47, 47.
- [8] Ardeljan N. V., Bisnovatyi-Kogan G. S., Moiseenko S.G., 2004, astro-ph/0410234.
- [9] Barkov M.V., Bisnovatyi-Kogan G. S., 2003, Preprint IKI Pr.2091
- [10] Barkov M.V., Bisnovatyi-Kogan G. S., 2005, Astron. Rep., 49, 204.
- [11] Berestetsky V.B., Lifshits E.M., Pitayevsky A.P. 1968, Relativistic quantum theory, vol. 1. Moscow. Nauka.
- [12] Berezinsky V. S., Prilutsky O. F., 1987, Astronomy and Astrophys., 175, 309.
- [13] Berezinsky V., Hnatyk B., Vilenkin A., 2001 Phys. Rev., D64, 043004.
- [14] Berezhiani Z., Bombaci I., Drago A., Frontera F., Lavagno A., 2003, Astrophys. J., 586, 1250.
- [15] Bisnovatyi-Kogan G. S., 1971, Sov. Astron., 14, 652.
- [16] Bisnovatyi-Kogan G. S., 1995, Astrophys. J. Suppl., 97, 185.
- [17] Bisnovatyi-Kogan G. S., 1997, Astronomy and Astrophys., 324, 573.
- [18] Bisnovatyi-Kogan G. S., 2002, Proc Vulcano99 Workshop: Mem. Soc. Astron. It., 73, 318 (astro-ph/9911275).
- [19] Bisnovatyi-Kogan G. S., 2003, astro-ph/0310361
- [20] Bisnovatyi-Kogan G. S., 2004, astro-ph/0401369.
- [21] Bisnovatyi-Kogan G. S. and Illarionov A. F., 1989, Astronomy and Astrophys., 213, 107.
- [22] Bisnovatyi-Kogan G. S., Chechetkin V. M., 1974, Astrophys. Space Sci., 26, 25.
- [23] Bisnovatyi-Kogan G. S., Imshennik V. S., Nadyozhin D. K., Chechetkin V. M., 1975, Astrophys. Space Sci., 35, 23.
- [24] Bisnovatyj-Kogan G. S., Lejkov N. G., 1993, Astrophys. Space Sci., 204, 181.
- [25] Bisnovatyi-Kogan G. S. and Timokhin A. N.,1997, Sov. Astron., 41, 423.
- [26] Bloom J. S., Kulkarni S. R., Djorgovski S. G., 2000, astro-ph/0010176.
- [27] Bloom J. S., Kulkarni S. R., Price P. A. et al. 2002, Astrophys. J. Lett., 572, L45.
- [28] Boggs S. E., Coburn W., 2003, astro-ph/0310515.
- [29] Briggs M. S., Band D. L., Preece R. D., Paciesas W. S., Pendleton G. N., 1999, astro-ph/9901224.
- [30] Coburn W., Boggs S. E., 2003, Nature, 423, 415.
- [31] CYGAM homepage, 2004, http://www.iki.rssi.ru/cygam/.
- [32] Dado S., Dar A., De Ru’jula A., 2002, Astronomy and Astrophys., 388, 1079.
- [33] Ding K. Y., Cheng K. S., 1997, Monthly Not. Roy. Astron. Soc., 287, 671.
- [34] Djorgovski S. G., Kulkarni S. R., Bloom J. S. et al., 2001, astro-ph/0107535.
- [35] Fishman G. J., Meegan C. A., 1995, Ann. Rev. Astron. Ap., 33, 415.
- [36] Galama T. J., Vreeswijk P. M., van Paradijs J. et al., 1998, Nature, 395, 670.
- [37] S.S. Gershtein, 2000, Astronomy Letters, 26, 730.
- [38] Granot J., 2003, Astrophys.J., 596, L17.
- [39] Groot P. J., Galama T. J., van Paradijs J. et al., 1998, Astrophys. J. Lett., 493, L27.
- [40] Hailey C. J., Harrison F. A., Mori K., 1999, Astrophys. J. Lett., 520, L25.
- [41] Harrison T. E., Webber W. R., McNamara B. J., 1995, Astron. J., 110, 2216.
- [42] Higdon J. C., Schmidt M., 1990, Astrophys. J., 355, 13.
- [43] Hjorth J., Sollerman J., Møller P. et al., 2003, Nature, 423, 847.
- [44] Hurley K. et al., 1999, GCN 450 (GRB991208).
- [45] Hurley K., Costa E., Feroci M. et al., 1997, Astrophys. J. Lett., 485, L1.
- [46] Hurley K. et al., 2000, GCN 529 (GRB000131).
- [47] Hurley K. et al., 2000, GCN 642 (GRB000418).
- [48] Hurley K. et al., 2000, GCN 736 (GRB000630).
- [49] Hurley K. et al., 2000, GCN 791 (GRB000911).
- [50] Hurley K. et al., 2000, GCN 802 (GRB000926).
- [51] Istomin Ya. N., Komberg B. V., 2002, Astron. Zh., 79, 1008.
- [52] Kippen R. M. et al., 1999, GCN 224 (GRB990123).
- [53] Kippen R. M. et al., 1999, GCN 306 (GRB990506).
- [54] Kippen R. M. et al., 1999, GCN 322 (GRB990510).
- [55] Klebesadel R. W., Strong I. B. and Olson R. A., 1973, Astrophys. J. Lett., 182, L85.
- [56] Kulkarni S., Djorgovski S. G., Odewahn S. C et al., 1999, Nature, 398, 389.
- [57] Lazzati D., Rossi E., Ghisellini G., Rees M.J., 2004, Mon.Not.Roy.Astron.Soc. 347, L1.
- [58] Leikov N. G., Bisnovatyi-Kogan G. S., 1994, Astrophys. J. Suppl., 92, 679.
- [59] Levan A., Vaughan S., Willingale R., et al., 2003, GCN 2489 (GRB031203).
- [60] MacFadyen A. I., Woosley S. E., 1999, Astrophys. J., 524, 262.
- [61] Masetti N., Palazzi E., Pian E. et al., 2000, Astron. Ap., 354, 473.
- [62] Mazets E. P., Golenetskij S. V., Aptekar R. L., Guryan Y. A., Ilinskij V. N., 1980, Sov. Astron. Lett., 6, 318.
- [63] Mazets E. P., Golenetskij S. V., Ilinskii V.N., et al., 1981 Astrophys. Space Sci., 80, 3.
- [64] Mazets E. P., Golenetskii S. V., Ilinskii V. N., Gurian Iu. A., Aptekar’ R. L., Panov V. N., Sokolov I. A., Sokolova Z. Ia., Kharitonova T. V., 1982a, Astrophys. Space Sci., 82, 261.
- [65] Mazets E. P., Golenetskii S. V., Gurian Iu. A., Ilinskii V. N., 1982b, Astrophys. Space Sci., 84, 173.
- [66] Mazets E. P., Cline T. L., Aptekar’ R. L., Butterworth P. S., Frederiks D. D., Golenetskii S. V., Il’Inskii V. N., Pal’Shin V. D., 1999, Astron. Lett., 25, 635.
- [67] Mazets E. P., Aptekar’ R. L., Butterworth P. S., Cline T. L., Frederiks D. D., Golenetskii S. V., Hurley K., Il’Inskii V. N., 1999 Astrophys. J. Lett., 519, L151.
- [68] Meegan C. A., Fishman G. J., Wilson R. B., Horack J. M., Brock M. N., Paciesas W. S., Pendleton G. N., Kouveliotou C. 1992, Nature 355, 143.
- [69] Milgrom M., Usov V., 1995, Astrophys.J. Lett, 449, L37.
- [70] Milgrom M., Usov V., 1996, Astropart.Phys., 4, 365.
- [71] Moiseenko S. G., Bisnovatyi-Kogan G. S., Ardeljan N. V., 2003, astro-ph/0310142.
- [72] Morselli A., 2002, astro-ph/0202340.
- [73] Much R., Harmon B. A., Nolan P. et al., 1996, Astrophys. Space Sci., 120, 703.
- [74] Novikov I. D., Frolov V. P. 1998. Black hole physics: basic consepts and new developements. Kluwer. Dordrecht.
- [75] Paciesas W. S., Meegan C. A., Pendleton G. N. et al., 1999, The Fourth BATSE Gamma-Ray Burst Catalog (Revised). On-line Data Catalog: IX/20A. Originally published in Astrophys. J. Suppl. 122, 465, 497.
- [76] Paczynski B., 1998, Astrophys. J. Lett., 494, L45.
- [77] Paolino A. et al., 2000, GCN 557 (GRB000214).
- [78] Patat F., Cappellaro E., Danziger J. et al., 2001, Astrophys. J., 555, 900.
- [79] Perna R., Loeb A., 1998, Astrophys. J. Lett., 509, L85.
- [80] Piro L., 2001, GCN 959 (GRB010222).
- [81] Piro, L.; Garmire, G.; Garcia, et al., 2001, Astrophys. J., 558, 442.
- [82] Pozanenko A. S., 2003, Private communication.
- [83] Price P. A., Fox D. W., Kulkarni S. R. et al.,2003, Nature, 423, 844.
- [84] Prilutsky O. F., Usov V. V., 1975, Astrophys. Space Sci., 34, 387.
- [85] Rhoads J. E., 2001, astro-ph/0103028.
- [86] Ruffert M., Janka H. -Th., 1998, Astronomy and Astrophys., 338, 535.
- [87] Ruffert M., Janka H. -Th., 1999, Astronomy and Astrophys., 344, 573.
- [88] Ruffini R., Salmonson J. D., Wilson J. R., Xue S. -S., 2000, Astronomy and Astrophys., 359, 855.
- [89] Rumjantsev V. et al., 2003, GCN 2005 (GRB030329).
- [90] Rutledge R. E., Fox D. B., 2004, Monthly Not. Roy. Astron. Soc. 350, 1288.
- [91] Schmidt M., 1999, Astrophys. J. Lett., 523, L117.
- [92] Schmidt M., 2001, Astrophys. J., 2001, 552, 36.
- [93] Schneid E. J., Bertsch D. L., Fichtel, C. E. et al., 1995, Ann. NY Acad. Sci., 759, 421.
- [94] Schneid E. J., Bertsch D. L., Dingus B. L. et al., 1995, Astrophys. J., 453, 95.
- [95] Shigeyama T., Suzuki T., Kumagai Sh., Nomoto K., Saio H., Yamaoka. H., 1994, Astrophys. J., 420, 341.
- [96] Smith D. A. et al., 1998, GCN 126 (GRB980703).
- [97] Smith D. A. et al., 2000, GCN 568 (GRB000301C).
- [98] Sokolov V. V., 2001, astro-ph/0102492.
- [99] Sokolov V. V., Fatkhullin T. A., Komarova V. N. et al., 2003, astro-ph/0312359.
- [100] Stanek K. Z., Matheson T., Garnavich P. M. et al., 2003, Astrophys. J. Lett., 591, L17.
- [101] Thoma M. H., Trümper J., Burwitz V., 2003, astro-ph/0305249.
- [102] Thompson D. J., Bailes M., Bertsch D. L. et al., 1999, Astrophys. J., 516, 297.
- [103] Timokhin A. N., Bisnovatyi-Kogan G. S., Spruit H. C., 2000, Monthly Not. Roy. Astron. Soc., 316, 734.
- [104] A.V. Tutukov, A.M. Cherepashchuk, 2003, Astronomy Reports, 47, 386.
- [105] Usov V. V., 1992, Nature, 357, 472.
- [106] van Putten M. H. P. M., 2001 Phys. Rep. 345, 1.
- [107] Vaughan S., Willingale R., O’Brien P. T. , et al., 2004, Astrophys. J. Lett., 603, L5.
- [108] Vietri M., 1995, Astrophys.J., 453, 883.
- [109] Vietri M., De Marco D, Guetta D., 2003, Astrophys.J., 592, 378.
- [110] Waxman E., 1995, Phys.Rev.Lett., 75, 386.
- [111] Waxman E., 1995, Astrophys.J. Lett., 1995, 452 L1.
- [112] Waxman E., 1995, Pramana, 2004, 62, 483.
- [113] Wigger C., Hajdas W., Arzner K., Gu”del M., and Zehnder A., 2004, Astrophys.J., 613, 1088.
- [114] Woods P., Kippen R. M. et al.,1998, GCN 112 (GRB980613).