INAF - Osservatorio Astronomico di Brera \PACSes\PACSit98.70.Rz - 95.85.Pw - 95.75.Fg
On the spectra and distance scale of short Gamma Ray–Bursts
Abstract
I discuss the spectral properties of short GRBs detected by BATSE and compare them with long events. The detailed modeling of short GRB spectra shows that their being (on average) harder than long events (as it has been found by comparing their hardness ratios) is indeed due to a harder low energy spectral component (i.e. the powerlaw of the Band or cutoff-powerlaw model) in short GRBs which, instead, have a peak energy similar to long events. Another open issue is the distance scale to short GRBs. While the few redshift measurements suggests that they are at , statistical studies (with local galaxies or X–ray selected clusters) suggest that they should be even more local.
1 Short GRB spectra
One of the still open issues of the population of short GRBs (i.e. lasting less than 2 sec according to the BATSE duration distribution) is the nature of their progenitors. The recent discoveries of their afterglow emission (e.g. [1]) and the first measurements of their redshifts enriched the limited observational picture based on the study of their prompt emission alone. However, the understanding of their emission mechanism and progenitors still requires to study their prompt emission up to few MeV energies.
In fact, from the light curves of short and long GRBs detected by BATSE (in its 9 years of activity), it was discovered (e.g. [2, 3, 4]) that, on average, short GRBs are spectrally harder than long events (i.e. the Hardness–Duration paradigm). This result was based on the hardness ratio (i.e. the ratio of the fluence detected in two broad contiguous energy bands) which, however, is a rough indicator of the real spectral properties of GRBs. Indeed, it has been shown (e.g. [5]) that GRB spectra are described by different spectral slopes in different energy ranges and that they often present a strong spectral evolution (e.g. [6, 9]).
A detailed spectral analysis, limited to 28 bright short BATSE GRBs ([8]) with peak flux larger than 10 phot cm-2 sec-1, showed that their spectra are harder than those of long bright GRBs (from [9, 6]) due to a harder low energy spectral component rather than to a harder peak energy. Moreover, this analysis indicated that the spectra of short GRBs are similar to the spectra of the first 2 sec of emission of long events.
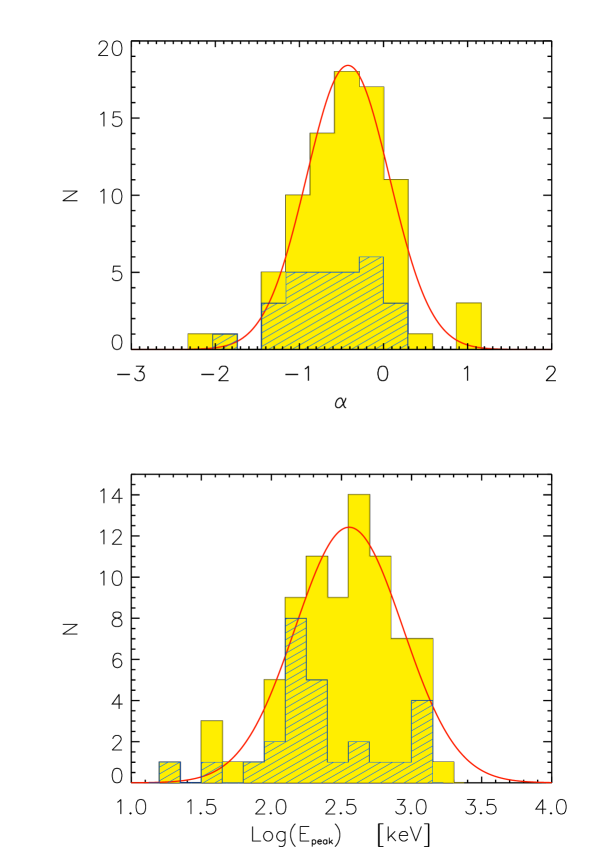
We recently extended the spectral analysis to short GRBs with a lower peak flux cut, i.e. 3 phot cm-2 sec-1 (in the 50–300 keV energy range). Only in 81 (out of 157 selected) bursts we could properly constrain the spectral parameters and in most cases the spectrum was better fitted with an exponential cutoff powerlaw model. However, due to the low signal–to–noise of the high energy spectrum (above 300 keV), it cannot be concluded that the preference for a cutoff–powerlaw model fit is a characteristic of short GRB spectra ().
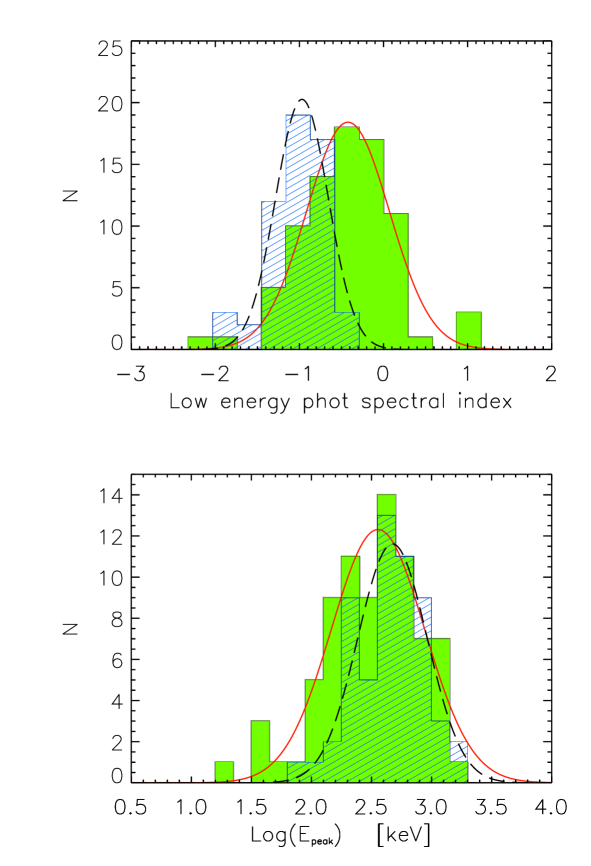
These results (Fig. 1 - left panels) indicate that the spectral parameters distribution (i.e. low energy photon spectral index and peak energy ) of the bright short bursts and of the larger sample (extended to lower peak fluxes) are similar. When compared with the population of long GRBs111Note that the comparison sample is with bright long GRBs. The analysis of a larger sample of long GRBs with a similar peak flux cut is in progress (Nava et al. in prep.). (Fig. 1 - right panels) it is confirmed that the Hardness-Duration paradigm is due to a harder low energy spectral component in short GRBs with respect to long events, while the peak energy distributions of short and long GRBs are similar.
2 Redshifts
Another still open issue related to short GRBs is their distance scale. On the one side the few redshifts measured so far suggest that they are relatively local (i.e at , see [10]) while on the other side there are statistical results, based on the BATSE short GRB population, that indicate that short GRBs should be even more local ([11]). The problem of the distance scale reflects on the energetic of short bursts and also on their progenitor nature. As a consequence of the double compact evolved star merger model for short bursts, it was expected to find them preferentially associated to evolved ellipticals. However, there are growing theoretical and observational evidences showing that short bursts can also be found in late type star forming galaxies (e.g. [12]). Few recent cases have also been found in cluster members (e.g. [13, 14]).
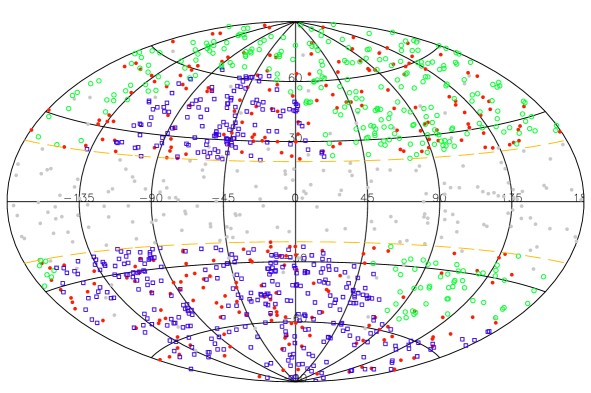
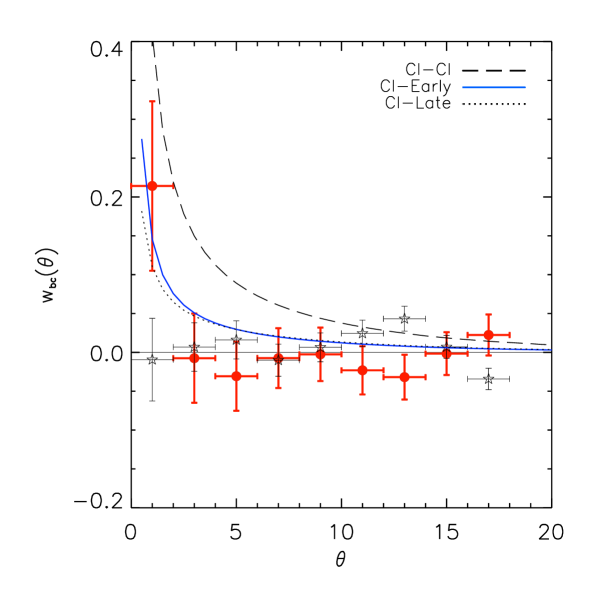
We studied ([15]) the possible correlation between BATSE GRBs (497 short and 1540 long events) and X-ray selected clusters of galaxies (763, 314 from the NORAS and 484 from the REFLEX samples - [16, 17]). The results indicate that short GRBs are correlated with clusters while we do not find any correlation with the population of long GRBs. Moreover, by comparing the burst–cluster correlation function with the cluster–cluster auto–correlation function we can exclude that short bursts trace the cluster distribution. Instead, through the comparison with the cluster–galaxy correlation functions we conclude that short GRBs are associated with “normal” galaxies.
By selecting local cluster sub–samples (or flux cuts in the flux limited cluster sample) we find a higher correlation signal with local () or sub-luminous clusters. This result is in agreement and further supported by the finding of a short GRB–cluster cross correlation function similar to the galaxies–cluster cross–correlation function and the fact that the short GRBs auto–correlation function is similar to that of local () galaxies ([18]).
These results are still a challenge for the (still) few spectroscopic redshift measurements of short bursts. However, if correct they predict a typical energy of short GRBs of erg, i.e. a factor smaller than long GRBs.
Acknowledgements.
I am grateful to A. Celotti, G. Ghisellini, L. Guzzo, M. Magliocchetti for valuable collaboration.References
- [1] \BYGerhels N. et al. \INNature4372005851.
- [2] \BYKouveliotou C. et al. \INApJ4131993L101.
- [3] \BYTavani M. et al. \INApJ4971998L21.
- [4] \BYCline B. D., Matthey C. \atqueOtwinowski S. \INApJ5271999827.
- [5] \BYBand D. L. et al. \INApJ4131993218.
- [6] \BYPreece R. D. et al. \INApJS126200019.
- [7] \BYGhirlanda et al. \INA&A2005Submitted.
- [8] \BYGhirlanda G., Ghisellini G. \atqueCelotti A. \INA&A4222004L55.
- [9] \BYGhirlanda G., Celotti A. \atqueGhisellini G. \INA&A3932002409.
- [10] \BYBerger E. \IN“Gamma Ray Bursts in the Swift Era”, eds. S. Holt, N. Gehrels and J. Nousek2006astro-ph/0602004.
- [11] \BYTanvir N. et al. \INNature4382005991.
- [12] \BYCovino S. et al. \INGCN20053665.
- [13] \BYBloom J. et al. \INApJ6382005354.
- [14] \BYGladders G. et al. \INGCN20053798.
- [15] \BYGhirlanda G. et al. \INMNRAS3682006L20.
- [16] \BYBoeringher H. et al. \INApJSS1292004435.
- [17] \BYBoeringher H. et al. \INA&A4252006367.
- [18] \BYMagliocchetti M., Ghirlanda G. \atqueCelotti A. \INMNRAS3432003255.